
Qianwen Ying, Hongliang Zhang, Zhichao Ruan. Progress and Application of Spatial Modulation Spectroscopy Technique for Detection of Extinction Cross Section of Single Nanoparticle[J]. Laser & Optoelectronics Progress, 2022, 59(17): 1700001
- Laser & Optoelectronics Progress
- Vol. 59, Issue 17, 1700001 (2022)
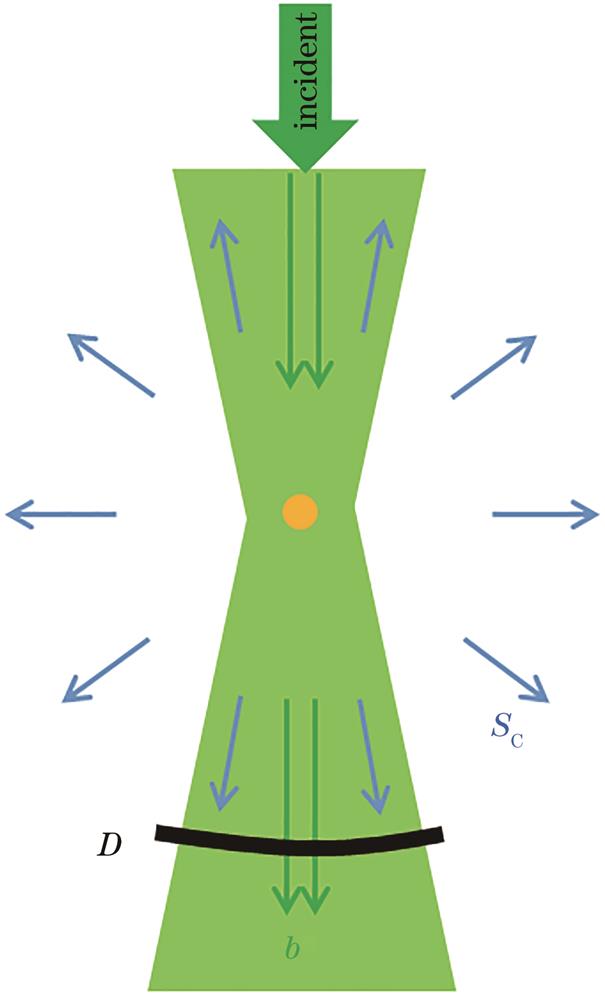
Fig. 1. Schematic of field propagation direction and detection area of a Gaussian beam incident on a single nanoparticle from above down
![Typical example of SMS technique. (a) Schematic setup for SMS technique[33]; signal components of (b) f and (c) 2f of particles at different x,y relative to beam measured by SMS technique[19]](/richHtml/lop/2022/59/17/1700001/img_02.jpg)
Fig. 2. Typical example of SMS technique. (a) Schematic setup for SMS technique[33]; signal components of (b)
Fig. 3. Comparison of schematic setups for T-SMS and R-SMS. (a) T-SMS technique[33]; (b) R-SMS technique[34]
Fig. 4. Schematic of experimental setup for modulating beam position[37]. Beam modulation is realized by changing angle at back focal plane by using a Glavo mirror; inset shows that modulation can also be achieved by an acousto-optic deflector (AOD)
Fig. 5. Experimental schematic of modulating polarization[44]. (a) Experimental setup of rotating linear polarization of laser at
Fig. 6. Schematic of ultrafast time-resolved pump-probe spectroscopy for sample nonlinearity measurement[48]
Fig. 7. Schematic of FT-SMS setup[62]
Fig. 8. Experimental setup for separation of scattering and absorption cross section spectra using a common-path interferometer[63]
Fig. 9. SMS technique combined with incoherent imaging system[36]. (a) Schematic of SMS technology combined with incoherent imaging; (b), (c) comparison of stability effects of extinction cross section with and without defocus feedback
Fig. 10. Relationship between size of nanostructure and its spectrum[79].(a)Diagram of environment-controlled
Fig. 11. Comparison of polarized light spectra in different directions for asymmetric particles. (a) Absorption cross section spectra (approximately equal to extinction) of a single elliptic gold nanoparticle[82]; (b) extinction cross section spectra of a single gold nanorod[81]
Fig. 12. Spectra comparison of bare nanorods and silicon-coated nanorods in different environments[93]
Fig. 13. Relationship between extinction cross section spectrum
|
Table 1. Major modulation schemes of SMS technique

Set citation alerts for the article
Please enter your email address
© Copyright 2018-2021 | Chinese Laser Press. All Rights Reserved 沪ICP备15018463号-20