
Feng Gao, Hong Zhou, Chao Huang. Improved Poisson Reconstruction Algorithm Based on Vector Field and Isosurface[J]. Laser & Optoelectronics Progress, 2020, 57(10): 101016
- Laser & Optoelectronics Progress
- Vol. 57, Issue 10, 101016 (2020)
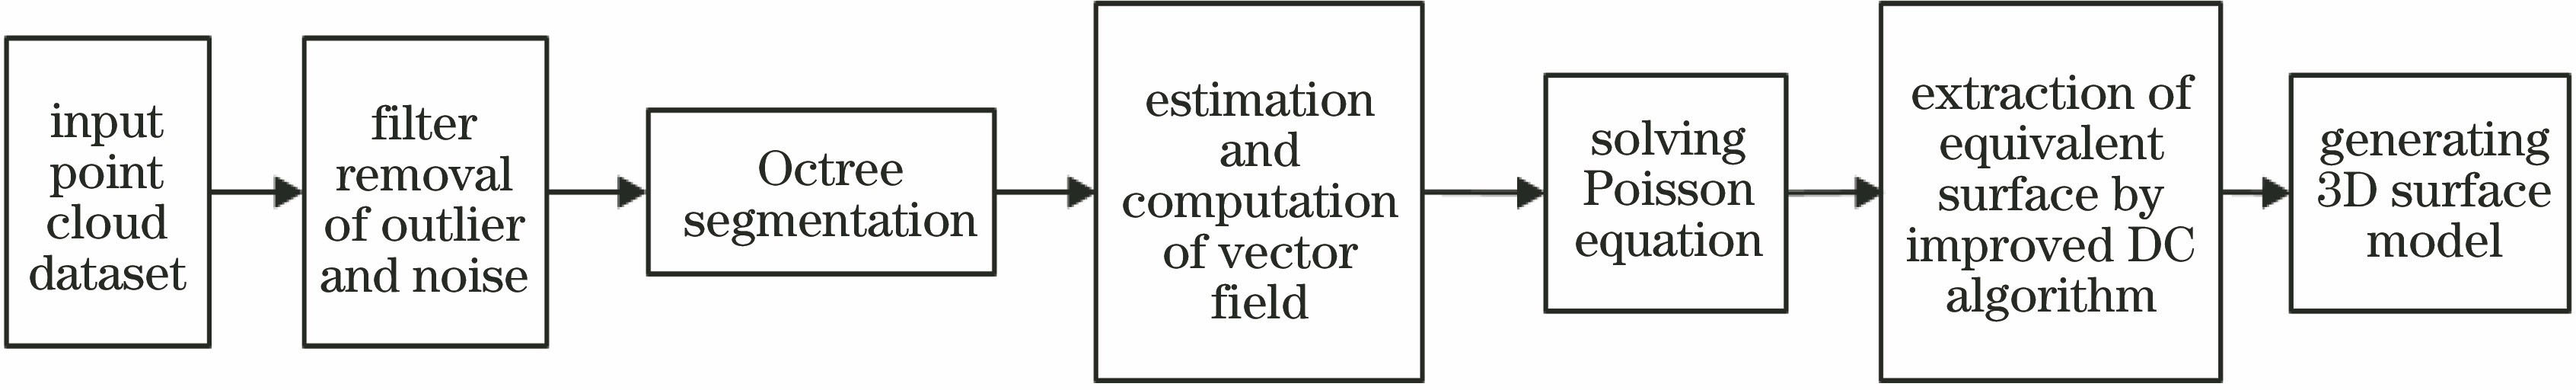
Fig. 1. Flow chart of improved Poisson surface reconstruction algorithm
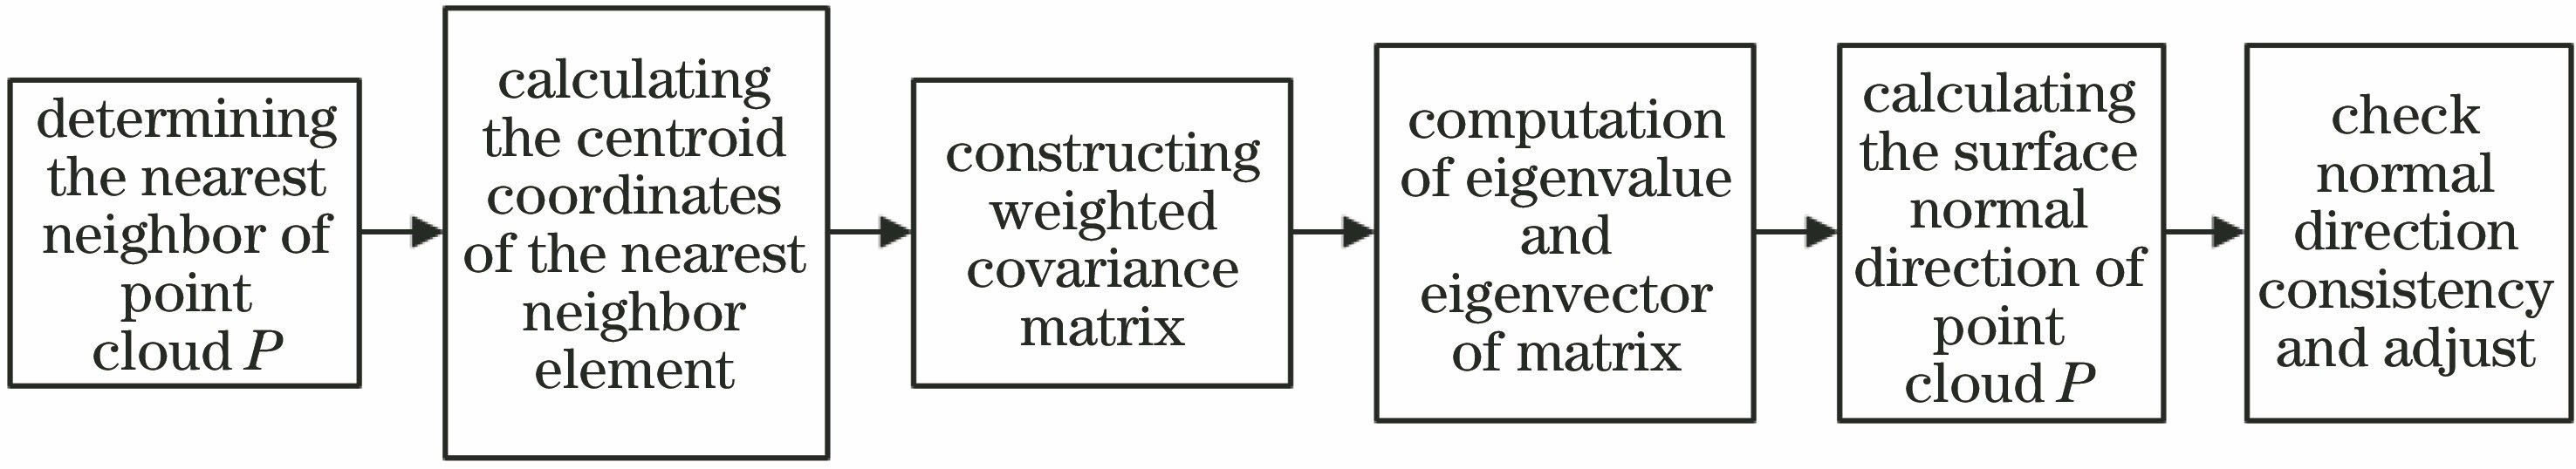
Fig. 2. Flow chart of normal estimation
Fig. 3. Normal vector fitting structure diagram
Fig. 4. Results of ambiguity of MC algorithm. (a) Two forms, (b) four results
Fig. 5. Structure diagram of different algorithms. (a) MC algorithm; (b) improved DC algorithm
Fig. 6. Comparison of filtering effect of the proposed algorithm. (a) Original point cloud dataset; (b) K=30; (c) K=50; (d) K=70
Fig. 7. Visualization of normal estimation. (a) (e)(i) Point cloud after preprocessing; (b)(f)(j) normal estimation of two traditional algorithms; (c)(g)(k) normal estimation of Ref. [18]; (d)(h)(l) normal estimation of improved algorithm
Fig. 8. Comparison of time complexity between four algorithms
Fig. 9. Comparison of surface reconstruction with four algorithms. (a)(e) Reconstruction of traditional Poisson algorithm; (b)(f) reconstruction of algorithm in Ref. [18]; (c)(g) reconstruction of greedy projection triangulation algorithm; (d)(h) reconstruction of improved algorithm in this paper
Fig. 10. Improved algorithm for surface reconstruction of different point cloud data. (a) Table model reconstruction; (b) pig model reconstruction; (c) horse model reconstruction
| |||||||||||||||||||||||
Table 1. Comparison of number of point clouds before and after denoising of different point clouds
| |||||||||||||||||||||||||||||||||||
Table 2. Comparison of reconstruction time for different point cloud data
| |||||||||||||||||||||||||||||||||||
Table 3. Patch number of the reconstructed model of four algorithms
|
Table 4. Reconstructed model accuracy of four algorithms

Set citation alerts for the article
Please enter your email address
© Copyright 2018-2021 | Chinese Laser Press. All Rights Reserved 沪ICP备15018463号-20