• Advanced Photonics
  • Vol. 3, Issue 3, 036002 (2021)
Rocio Camacho-Morales1、*, Davide Rocco2, Lei Xu1、3、4, Valerio Flavio Gili5、6, Nikolay Dimitrov7, Lyubomir Stoyanov7, Zhonghua Ma1, Andrei Komar1, Mykhaylo Lysevych1, Fouad Karouta1, Alexander Dreischuh7, Hark Hoe Tan1, Giuseppe Leo5, Costantino De Angelis2, Chennupati Jagadish1, Andrey E. Miroshnichenko3, Mohsen Rahmani1、4, and Dragomir N. Neshev1
Author Affiliations
  • 1The Australian National University, Research School of Physics, ARC Centre of Excellence for Transformative Meta-Optical Systems, Department of Electronic Materials Engineering, Canberra, ACT, Australia
  • 2University of Brescia, Department of Information Engineering, Brescia, Italy
  • 3University of New South Wales, School of Engineering and Information Technology, Canberra, ACT, Australia
  • 4Nottingham Trent University, School of Science and Technology, Advanced Optics and Photonics Laboratory, Department of Engineering, Nottingham, United Kingdom
  • 5Université Paris Diderot, Matériaux et Phénomènes Quantiques, Paris, France
  • 6Friedrich Schiller University Jena, Institute of Applied Physics, Abbe Center of Photonics, Jena, Germany
  • 7Sofia University, Department of Quantum Electronics, Faculty of Physics, Sofia, Bulgaria
  • show less
    DOI: 10.1117/1.AP.3.3.036002 Cite this Article Set citation alerts
    Rocio Camacho-Morales, Davide Rocco, Lei Xu, Valerio Flavio Gili, Nikolay Dimitrov, Lyubomir Stoyanov, Zhonghua Ma, Andrei Komar, Mykhaylo Lysevych, Fouad Karouta, Alexander Dreischuh, Hark Hoe Tan, Giuseppe Leo, Costantino De Angelis, Chennupati Jagadish, Andrey E. Miroshnichenko, Mohsen Rahmani, Dragomir N. Neshev. Infrared upconversion imaging in nonlinear metasurfaces[J]. Advanced Photonics, 2021, 3(3): 036002 Copy Citation Text show less
    (a) Energy level scheme of SFG mediated by a second-order nonlinear process. Here, ω1 and ω2 are the angular frequencies of the incident signal (ωs) and pump (ωp) beams while ωSFG is the angular frequency of the nonlinear SFG emission. The solid and dashed black lines indicate real and virtual energy levels, respectively. (b) Schematic illustrating the concept of IR nonlinear imaging. The pump beam (ωp) and the IR signal beam (ωs), encoding the image of a target (i.e., a Siemens star), are simultaneously focused by a lens on a (110) GaAs metasurface. At the output of the metasurface, a visible image of the target is obtained through the SFG emission (ωSFG). In the schematic, the focused pump and signal beams are not spatially overlapped on the metasurface only for visualization purposes.
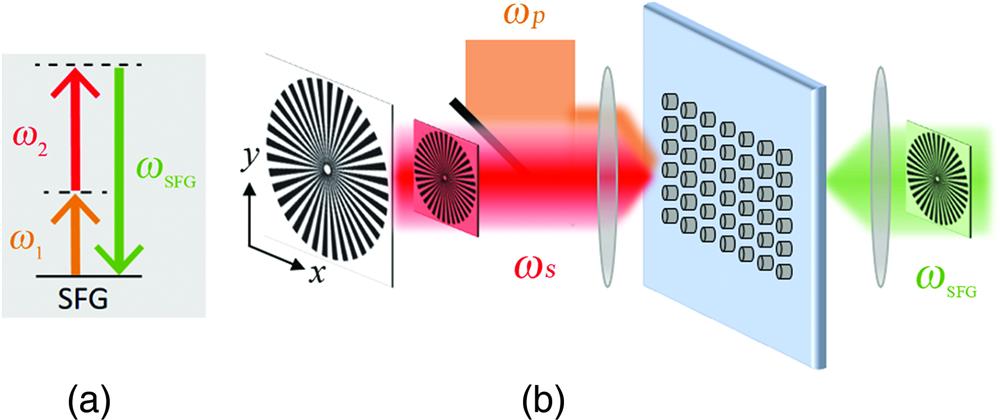
    Fig. 1. (a) Energy level scheme of SFG mediated by a second-order nonlinear process. Here, ω1 and ω2 are the angular frequencies of the incident signal (ωs) and pump (ωp) beams while ωSFG is the angular frequency of the nonlinear SFG emission. The solid and dashed black lines indicate real and virtual energy levels, respectively. (b) Schematic illustrating the concept of IR nonlinear imaging. The pump beam (ωp) and the IR signal beam (ωs), encoding the image of a target (i.e., a Siemens star), are simultaneously focused by a lens on a (110) GaAs metasurface. At the output of the metasurface, a visible image of the target is obtained through the SFG emission (ωSFG). In the schematic, the focused pump and signal beams are not spatially overlapped on the metasurface only for visualization purposes.
    Calculated transmittance of GaAs metasurface as a function of radius and periodicity of the nanoantennas for an incident wavelength of (a) 860 nm (pump) and (b) 1530 nm (signal). The nanoantenna height is fixed at 400 nm. In each plot, the transmittance is indicated by the top color bar. A simultaneous double-resonant behavior is achieved when the periodicity is 750 nm and the radius is 225 nm (see orange and red dots). (c) Side view of the designed metasurface illustrating the height (h), radius (r), and middle xy-plane of the nanoantenna, as well as periodicity (P). Calculated modulus of the electric field distribution in a metasurface unit cell (r=225 nm, h=400 nm) for an incident wavelength of (d) 860 nm and (e) 1530 nm. The field intensity in both plots is represented by the top color bar. The calculations show the middle xy-plane cut view of a nanoantenna.
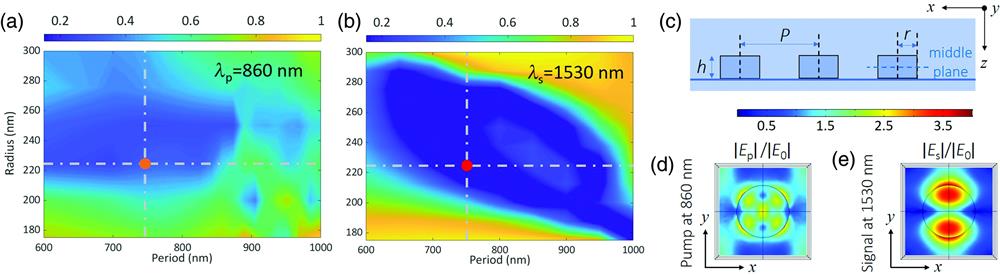
    Fig. 2. Calculated transmittance of GaAs metasurface as a function of radius and periodicity of the nanoantennas for an incident wavelength of (a) 860 nm (pump) and (b) 1530 nm (signal). The nanoantenna height is fixed at 400 nm. In each plot, the transmittance is indicated by the top color bar. A simultaneous double-resonant behavior is achieved when the periodicity is 750 nm and the radius is 225 nm (see orange and red dots). (c) Side view of the designed metasurface illustrating the height (h), radius (r), and middle xy-plane of the nanoantenna, as well as periodicity (P). Calculated modulus of the electric field distribution in a metasurface unit cell (r=225  nm, h=400  nm) for an incident wavelength of (d) 860 nm and (e) 1530 nm. The field intensity in both plots is represented by the top color bar. The calculations show the middle xy-plane cut view of a nanoantenna.
    Oblique SEM images of a GaAs wafer consisting of the fabricated nanoantennas (a) before and (b) after lift-off from the substrate. Experimental transmission spectra of the GaAs metasurface measured in the (c) visible and (d) IR spectral regions. Corresponding transmission spectra of the GaAs metasurface were calculated in the (e) visible and (f) IR spectral regions. The wavelength positions of the SFG, pump, and signal are indicated by the green, orange, and red vertical lines, respectively.
    Fig. 3. Oblique SEM images of a GaAs wafer consisting of the fabricated nanoantennas (a) before and (b) after lift-off from the substrate. Experimental transmission spectra of the GaAs metasurface measured in the (c) visible and (d) IR spectral regions. Corresponding transmission spectra of the GaAs metasurface were calculated in the (e) visible and (f) IR spectral regions. The wavelength positions of the SFG, pump, and signal are indicated by the green, orange, and red vertical lines, respectively.
    Spectral dependence of the SFG emission on the varying wavelength of (a) the pump beam from 830 to 880 nm, and (b) the signal beam from 1470 to 1570 nm. In the former case, the wavelength of the signal is fixed at 1530 nm, while in the latter case the wavelength of the pump is fixed at 860 nm. The spectral location of the calculated SFG peak is indicated by black dotted lines. (c) Normalized nonlinear spectrum from metasurface, where two strong emission peaks centered at 430 and 550 nm are generated by the SHG2ωp of the pump and the SFG process, respectively. (d) Intensity dependence of SHG2ωp and SFG on pump power, shown in a log-log plot. The SHG2ωp intensity depends quadratically on the pump power, while the SFG intensity depends linearly.
    Fig. 4. Spectral dependence of the SFG emission on the varying wavelength of (a) the pump beam from 830 to 880 nm, and (b) the signal beam from 1470 to 1570 nm. In the former case, the wavelength of the signal is fixed at 1530 nm, while in the latter case the wavelength of the pump is fixed at 860 nm. The spectral location of the calculated SFG peak is indicated by black dotted lines. (c) Normalized nonlinear spectrum from metasurface, where two strong emission peaks centered at 430 and 550 nm are generated by the SHG2ωp of the pump and the SFG process, respectively. (d) Intensity dependence of SHG2ωp and SFG on pump power, shown in a log-log plot. The SHG2ωp intensity depends quadratically on the pump power, while the SFG intensity depends linearly.
    (a) Schematic illustration of nonlinear emissions generated by the metasurface at different time delays, Δt between the pump and signal pulses. SHG2ωp (λ=430 nm) and SFG (λ=550 nm) are generated by the metasurface when the time delay between the pulses is zero (top row). The SFG emission vanishes when the time delay increases (bottom row). (b) 2D nonlinear spectra measured as a function of time delay. The strongest spectral emission centered at 430 nm is independent of the time delay, while the emission centered at 550 nm is strongly dependent of the time delay, having a width of 267 fs.
    Fig. 5. (a) Schematic illustration of nonlinear emissions generated by the metasurface at different time delays, Δt between the pump and signal pulses. SHG2ωp (λ=430  nm) and SFG (λ=550  nm) are generated by the metasurface when the time delay between the pulses is zero (top row). The SFG emission vanishes when the time delay increases (bottom row). (b) 2D nonlinear spectra measured as a function of time delay. The strongest spectral emission centered at 430 nm is independent of the time delay, while the emission centered at 550 nm is strongly dependent of the time delay, having a width of 267 fs.
    (a) IR upconversion imaging using a GaAs metasurface: the IR signal beam passes through a target, which is imaged on the metasurface (MS). Mixing the IR image with the pump beam results in a visible image of the target (in the SFG beam), which is subsequently imaged by a lens onto a camera. The IR and visible images are acquired with an InGaAs and a CCD camera, respectively. The scale bars on both images are 15 μm, while the size of the metasurface is 30 μm×30 μm. (b) Optical microscope image of the Siemens star used for imaging. The section of the target used in the IR image [see (a)] is highlighted by a black square. (c) Optical microscope images of different transverse positions of the target (left-hand side) and their corresponding upconverted images (right-hand side): (i) SFG emission when the target is removed and (ii)–(iv) SFG images for three positions of the target in the transverse plane.
    Fig. 6. (a) IR upconversion imaging using a GaAs metasurface: the IR signal beam passes through a target, which is imaged on the metasurface (MS). Mixing the IR image with the pump beam results in a visible image of the target (in the SFG beam), which is subsequently imaged by a lens onto a camera. The IR and visible images are acquired with an InGaAs and a CCD camera, respectively. The scale bars on both images are 15  μm, while the size of the metasurface is 30  μm×30  μm. (b) Optical microscope image of the Siemens star used for imaging. The section of the target used in the IR image [see (a)] is highlighted by a black square. (c) Optical microscope images of different transverse positions of the target (left-hand side) and their corresponding upconverted images (right-hand side): (i) SFG emission when the target is removed and (ii)–(iv) SFG images for three positions of the target in the transverse plane.
    Rocio Camacho-Morales, Davide Rocco, Lei Xu, Valerio Flavio Gili, Nikolay Dimitrov, Lyubomir Stoyanov, Zhonghua Ma, Andrei Komar, Mykhaylo Lysevych, Fouad Karouta, Alexander Dreischuh, Hark Hoe Tan, Giuseppe Leo, Costantino De Angelis, Chennupati Jagadish, Andrey E. Miroshnichenko, Mohsen Rahmani, Dragomir N. Neshev. Infrared upconversion imaging in nonlinear metasurfaces[J]. Advanced Photonics, 2021, 3(3): 036002
    Download Citation