Abstract
Infrared imaging is a crucial technique in a multitude of applications, including night vision, autonomous vehicle navigation, optical tomography, and food quality control. Conventional infrared imaging technologies, however, require the use of materials such as narrow bandgap semiconductors, which are sensitive to thermal noise and often require cryogenic cooling. We demonstrate a compact all-optical alternative to perform infrared imaging in a metasurface composed of GaAs semiconductor nanoantennas, using a nonlinear wave-mixing process. We experimentally show the upconversion of short-wave infrared wavelengths via the coherent parametric process of sum-frequency generation. In this process, an infrared image of a target is mixed inside the metasurface with a strong pump beam, translating the image from the infrared to the visible in a nanoscale ultrathin imaging device. Our results open up new opportunities for the development of compact infrared imaging devices with applications in infrared vision and life sciences.1 Introduction
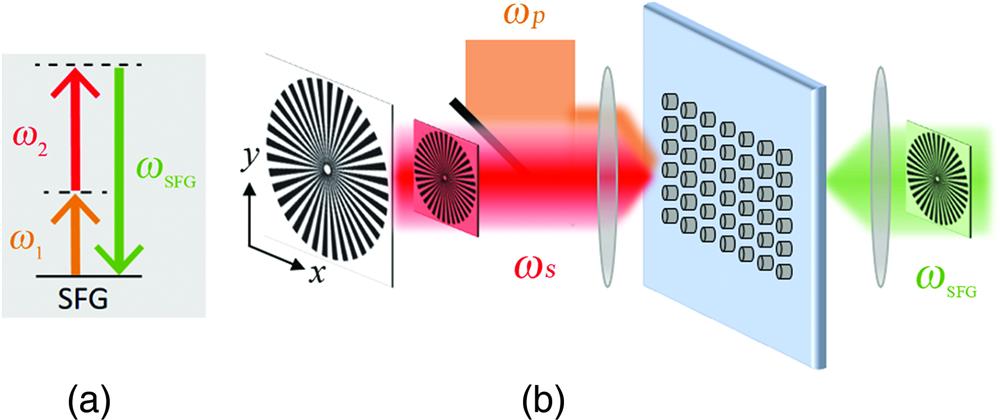
Infrared (IR) spectroscopy and imaging are growing in demand due to the increasing number of applications in this spectral region, including optical tomography,1 process monitoring,2 food and agriculture quality control,3 and night vision devices,4 as well as LIDAR and remote sensing.5,6 Commercial IR imaging detectors rely on the absorption of incident photons in narrow bandgap semiconductor materials and the release of electrons that are electrically detected. However, due to the low IR photon energy, such IR detection schemes require low-temperature and even cryogenic cooling. As a result, IR cameras are generally bulky, containing several components for photon–electron conversion. An alternative scheme, which can potentially overcome the limitations of photoconductive detectors, is the use of nonlinear optical processes for upconversion of the photon energy. In this approach, the IR image is not directly detected; instead, a parametric nonlinear optical process is employed to convert the image to higher frequencies and detect it using regular cameras in a process known as upconversion IR imaging. In 1968, Midwinter first demonstrated IR upconversion imaging by converting the IR signal to the visible spectrum using a nonlinear crystal and the aid of a pump beam.7 The spatial information of a short-wave IR (SWIR) image () was coherently transferred to the visible domain () using a parametric second-order nonlinear process known as sum-frequency generation (SFG). In the SFG process, two incident waves with frequencies and interact inside a second-order nonlinear material leading to sum-frequency emission with frequency , as shown in Fig. 1(a). The results obtained by Midwinter showed the possibility of detecting IR images with relatively high sensitivities using standard, fast, and uncooled Si-based detectors. A decade of intensive research followed the first demonstration of upconversion IR imaging, where the performance and resolution of the imaging systems were studied in different arrangements, including various incidence angles,8 nonlinear bulk crystals,9 optical configurations,10 bandwidth of the IR radiation,11 and pump beams.12 However, the low signal-to-noise ratio of CCD detectors and poor quality of nonlinear crystals at the time prevented practical developments of upconversion imaging systems. Recently, the interest in such imaging systems has been renewed, driven by the availability of periodically poled nonlinear crystals,13–15 new laser sources,16–18 and the use of intracavity configurations,14,19 which can improve the performance of the systems. The main difficulty in the realization of these IR imaging systems is the phase-matching condition, which not only restricts the conversion efficiency of the upconversion process but also limits the spectral bandwidth, resolution, and field of view of the IR image. Another approach in the detection of IR radiation is the use of quantum imaging techniques, such as quantum ghost imaging.20 However, in addition to the phase-matching condition, quantum imaging approaches require the entanglement of the illuminating photons, the use of single-photon detectors, and possibly the use of interferometry, therefore increasing the complexity of these imaging techniques.

Figure 1.(a) Energy level scheme of SFG mediated by a second-order nonlinear process. Here, and are the angular frequencies of the incident signal () and pump () beams while is the angular frequency of the nonlinear SFG emission. The solid and dashed black lines indicate real and virtual energy levels, respectively. (b) Schematic illustrating the concept of IR nonlinear imaging. The pump beam () and the IR signal beam (), encoding the image of a target (i.e., a Siemens star), are simultaneously focused by a lens on a (110) GaAs metasurface. At the output of the metasurface, a visible image of the target is obtained through the SFG emission (). In the schematic, the focused pump and signal beams are not spatially overlapped on the metasurface only for visualization purposes.
In this work, we propose an approach to perform IR upconversion imaging using for the first time, to the best of our knowledge, nanostructured ultrathin metasurfaces. Our metasurfaces, composed of nanoantennas fabricated on (110) GaAs wafers, are resonant at all the interacting wavelengths. Thus, by employing SFG within the resonant metasurface, we demonstrate nonlinear wave-mixing of a SWIR signal beam with a near-IR pump beam, which generates an upconverted emission in the visible spectrum. More importantly, when the SWIR signal beam carries the image of a target, the spatial information of the target is preserved in the nonlinear wave-mixing process despite being generated by hundreds of independent GaAs crystalline nanoantennas. Therefore, the ultrafast nonlinear upconversion process enables IR imaging with femtosecond temporal resolution. This advancement opens up future opportunities for ultrafast imaging of chemical reactions in a conventional microscope device.
2 Nonlinear Metasurfaces for IR Imaging
Metasurfaces are planar arrays of densely packed nanoantennas designed to manipulate the properties of incident light, including its amplitude, directionality, phase, polarization, and frequency.21 The optical response of metasurfaces is governed by the collective scattering of individual nanoantennas and the mutual coupling among neighboring nanoantennas. Recent advances in nanofabrication technologies22 have motivated extensive research in the field of metasurfaces. Among various examples, dielectric and semiconductor metasurfaces have shown great promise for enhancing nonlinear optical processes at the nanoscale.23 Such metasurfaces can exhibit enhanced frequency conversion due to the excitation of optical resonances24–27 and good coupling to free-space.
Sign up for Advanced Photonics TOC. Get the latest issue of Advanced Photonics delivered right to you!Sign up now
However, the strongest nonlinear response of materials originates from its quadratic nonlinearity, which is present only in noncentrosymmetric materials. GaAs and its aluminum alloys are often the materials of choice for quadratic nonlinear metasurfaces, since these III-V semiconductor materials possess a zinc-blende noncentrosymmetric crystalline structure and high quadratic nonlinear susceptibility .28 Nevertheless, the use of (100)-GaAs compounds comes with significant challenges due to the only off-diagonal components of its second-order nonlinear susceptibility tensor. While (100) GaAs metasurfaces have been used to demonstrate ultrathin second-harmonic sources29–31 and frequency-mixers,32 harmonic emission from such metasurfaces is generated only at broad angles.31,33 Recent studies aimed at directing the harmonic emission at normal direction to the metasurface;33–36 however, the most successful strategy to date has been the use of different crystalline symmetry nanoantennas. The GaAs tensor is variant under the rotation of the crystallographic axes, thus for (111) and (110) GaAs metasurfaces, the diagonal components of the nonlinear susceptibility tensor are different from zero. Normal second-harmonic generation (SHG) was first demonstrated in (111) AlGaAs nanoantennas.37 However, (110) GaAs nanoantennas have shown highly directional SHG and unique control of its forward to backward emission.38 Such highly directional normal emission promotes the nonlinear mixing of two copropagating beams to generate sum-frequency emission, which also propagates along the normal direction. Therefore, in our work, we employ (110) GaAs metasurfaces to perform IR upconversion imaging through the SFG process. In this way, our metasurface can mimic a bulk nonlinear crystal and perform colinear wave-mixing without the need of colinear phase-matching.
The process of IR upconversion imaging in a nonlinear metasurface is schematically shown in Fig. 1(b). In this figure, the image of a target (Siemens star) is encoded in the IR signal beam (red beam) and upconverted to a visible image (green beam) due to the nonlinear wave-mixing of the signal with the pump beam (orange beam) within the metasurface. For the rest of the paper, the colors red, orange, and green in the figures will be used to refer to the signal, pump, and SFG beams, respectively. In our configuration, the pump beam and the IR image of a target in the signal beam are simultaneously focused on the metasurface [left-hand side of Fig. 1(b)]. The pump and signal beams are mixed together within the GaAs metasurface through the SFG process [see energy diagram in Fig. 1(a)], resulting in upconverted photons that form a visible image of the target [right-hand side of Fig. 1(b)]. This configuration is referred to as upconversion in the image plane since the frequency-mixing process takes place in real space, as opposed to the upconversion in the Fourier plane where the frequency-mixing is performed in Fourier space.
In our experiments, we chose the signal beam at 1530 nm wavelength. This choice is dictated by applications in night-vision technologies and corresponds to the maximum band of nightglow (1500 to 1700 nm).39 The pump beam is chosen at 860 nm since commercial high-power laser diodes are readily available at this wavelength. Moreover, this wavelength is invisible to the human eye. With these wavelengths, the SFG frequency-mixing process results in the generation of visible green light (at 550 nm), at which the human eye has maximum sensitivity.
3 Numerical Results
First, we designed the linear optical properties of (110) GaAs metasurfaces to support resonances at the wavelengths of the signal and pump beams. The design of resonant modes at the excitation wavelengths has proven to be a reliable strategy to enhance nonlinear conversion efficiencies of nanostructures. Meanwhile, the enhancement of nonlinear efficiencies based on spatial mode-overlap has been restricted to the study of harmonic generation, mainly in individual nanostructures.40,41 In the case of SFG, the mode-overlap condition is more complex than in harmonic generation processes. This is explained by the nondegenerated excitation frequencies used in the SFG process, inducing different spatial distribution of the excitation near-fields. Therefore, in our studies, the numerical optimization was focused on the design of resonant modes and the simultaneous SFG emission normal to the metasurface. We performed numerical calculations using a commercial electromagnetic solver based on a finite element method (COMSOL Multiphysics). The properties of our metasurfaces, consisting of GaAs nanoantennas embedded within a nondispersive and homogeneous medium (), are simulated by implementing Floquet boundary conditions to represent an infinite two-dimensional (2D) periodic structure. The embedding transparent medium corresponds to the polymer used in our fabrication procedure.31 The dispersion of the GaAs permittivity was taken from tabulated data.42 For more details, see the Supplemental Material.
Different geometric parameters of the metasurface were optimized to obtain the desired resonances, namely the disk nanoantenna radius and the array periodicity [see Fig. 2(c)]. In our calculations, the height of the nanoantennas is fixed to 400 nm. The 2D transmission maps obtained by varying the nanoantennas separation distances from 600 to 1000 nm, and the nanoantennas radii from 175 to 300 nm are shown in Figs. 2(a) and 2(b). Figure 2(a) was calculated at an incident wavelength of 860 nm, corresponding to the pump beam, while Fig. 2(b) was calculated considering an incident signal wavelength at 1530 nm. In both cases, normal plane-wave illumination was used. The areas of interest in these 2D maps are the low transmission areas, indicated by blue-colored regions. These transmission dips correspond to a strong resonant behavior of the metasurface. As can be seen in Fig. 2(a), strong resonances can take place in metasurfaces with a periodicity in the range of to 850 nm and a radius in the range of to 250 nm. Similarly, Fig. 2(b) shows that strong resonances can be obtained in metasurfaces with a periodicity in the range of 650 to 800 nm and a radius in the range of to 280 nm, along with other strong resonances observed in metasurfaces with a larger periodicity. Thus, these transmission maps offer a range of geometric parameters of metasurfaces where strong resonances are simultaneously obtained for the signal and pump beams. The pair of geometric parameters ( and ) indicating a double-resonant behavior of the metasurface was next used to simulate the SFG emission. The final design consists of a (110)-GaAs metasurface with , [see orange and red dots in Figs. 2(a) and 2(b), respectively], and , where the strong double-resonant behavior and maximum SFG emission normal to the metasurface (see Fig. S4 in the Supplemental Material) were obtained. The forward SFG conversion efficiency, of the designed metasurface is for and , corresponding to the typical intensity values used in our measurements. This efficiency is dependent on the pump beam power; therefore, the normalized conversion efficiency is a better measure of the efficiency of the SFG process. Here, is the average power of the pump beam.
Figure 2.Calculated transmittance of GaAs metasurface as a function of radius and periodicity of the nanoantennas for an incident wavelength of (a) 860 nm (pump) and (b) 1530 nm (signal). The nanoantenna height is fixed at 400 nm. In each plot, the transmittance is indicated by the top color bar. A simultaneous double-resonant behavior is achieved when the periodicity is 750 nm and the radius is 225 nm (see orange and red dots). (c) Side view of the designed metasurface illustrating the height (), radius (), and middle -plane of the nanoantenna, as well as periodicity (). Calculated modulus of the electric field distribution in a metasurface unit cell (, ) for an incident wavelength of (d) 860 nm and (e) 1530 nm. The field intensity in both plots is represented by the top color bar. The calculations show the middle -plane cut view of a nanoantenna.
According to the final design of the metasurface, the spatial field profiles in a metasurface unit cell were calculated at the pump and signal wavelengths. The pump and signal field profiles, normalized to the incident electric field, are shown in Figs. 2(d) and 2(e), respectively. In each case, the electric field profile is shown in the middle -plane of the nanoantenna [see Fig. 2(c)]. The spatial field profile of the pump [Fig. 2(d)] shows a maximum enhancement of about 2.5 times with respect to the incident field. At the edges of the nanoantenna, the spatial distribution of the pump field shows a four-lobe pattern, resembling a quadrupolar resonant mode. Multipolar decomposition of the total scattering indicates the contribution of an electric and magnetic dipole, followed by an electric and magnetic quadrupole at the pump wavelength (Fig. S1 in the Supplemental Material). The field spatial profile of the signal beam, shown in Fig. 2(e), shows a field enhancement of more than three times with respect to the incident field. The spatial distribution of the signal field is indicative of a dipole mode excitation. Multipolar decomposition of the total scattering corroborates the excitation of a strong magnetic dipole followed by an electric dipole at the signal wavelength (Fig. S1 in the Supplemental Material). The electric field profiles of the pump and signal beams in the - and -planes of the metasurface are shown in Fig. S2 in the Supplemental Material.
4 Experimental Results
4.1 Fabrication and Linear Characterization of the Metasurface
According to our optimal design, we fabricated metasurfaces with , , and . First, a (110) GaAs wafer was used as the substrate to epitaxial growth of a 20-nm AlAs sacrificial layer and 400-nm-thick GaAs main layer using metal-organic chemical vapor deposition. The AlAs layer was used as a lift-off buffer layer, while the GaAs layer was used to fabricate the nanoantenna arrays [Fig. 3(a)]. The arrays were defined using electron-beam lithography and sequential inductively coupled plasma etching. Next, the nanoantenna arrays were embedded in a benzocyclobutene (BCB) layer followed by curing and bonding to a thin glass substrate. Finally, the glass substrate with the GaAs nanoantenna arrays embedded in the BCB layer was lifted off from the GaAs wafer [Fig. 3(b)]. More details of our fabrication technique can be found in our previous work.31 Our fabrication technique allows us to obtain the final metasurface consisting of a GaAs nanoantenna square array of , bonded on a transparent glass substrate. This has enabled us to perform IR imaging in a transmission configuration, as typically required in many imaging applications.43,44
Figure 3.Oblique SEM images of a GaAs wafer consisting of the fabricated nanoantennas (a) before and (b) after lift-off from the substrate. Experimental transmission spectra of the GaAs metasurface measured in the (c) visible and (d) IR spectral regions. Corresponding transmission spectra of the GaAs metasurface were calculated in the (e) visible and (f) IR spectral regions. The wavelength positions of the SFG, pump, and signal are indicated by the green, orange, and red vertical lines, respectively.
The linear transmission spectrum of the fabricated metasurface was measured by white light spectroscopy, using horizontally polarized light. The visible transmission spectrum in Fig. 3(c) shows three strong resonances (manifested as dips) centered around 580, 770, and 885 nm. The vertical orange line indicates the position of the pump wavelength (at 860 nm). In addition, a resonant behavior is observed at the corresponding SFG wavelength (550 nm), indicated by a vertical green line. Figure 3(d) shows the IR transmission spectrum with three strong resonances centered around 1100, 1340, and 1460 nm. The vertical red line indicates the position of the signal wavelength (at 1530 nm), where the metasurface exhibits a resonant behavior. Overall, our fabricated GaAs metasurface exhibits a multiresonant behavior, with resonances around the three wavelengths of interest at the pump, signal, and SFG beams. The calculated visible and IR transmission spectra of the metasurface are shown in Figs. 3(e) and 3(f), respectively. To account for the chromatic dispersion of the embedding medium, different refractive indices of the surrounding medium () were considered in each case. A value of was considered in the visible spectral region, while was considered in the IR spectral region. These values correspond to the typical values of the BCB refractive index and its dispersive behavior. While the resonant wavelengths show good agreement between the simulation and experiments, the intensity disagreement can be attributed to small variations of the geometric parameters and refractive indices of the materials in the fabricated sample.
However, the SFG efficiency is not only determined by the far-field scattering spectrum but also by the near-field enhancement and spatial mode-overlap. Therefore, experiments are required to optimize the efficiency of the nonlinear sum-frequency process.
4.2 Nonlinear Emissions from GaAs Metasurfaces
Next, we measured the SFG intensity by independently tuning the wavelengths of the signal and pump beams around the spectral region of interest. We used a Ti:sapphire laser with an optical parametric oscillator that together delivered two pulsed train beams (see Figs. S5 and S6 in the Supplemental Material) with a repetition rate of 80 MHz. First, the wavelength of the signal beam was fixed at 1530 nm and the wavelength of the pump was tuned from 830 to 880 nm [Fig. 4(a)]. Both beams were linearly polarized along the horizontal direction. The spectrum in Fig. 4(a) shows the emission of the SFG from 537 to 558 nm, with a maximum efficiency at 549 nm, corresponding to an excitation pump beam at 860 nm. After exhibiting a maximum at 549 nm, the SFG intensity decreases with the increase of the pump wavelength. The use of a pump beam with wavelengths longer than 880 nm is limited by our laser system.
Figure 4.Spectral dependence of the SFG emission on the varying wavelength of (a) the pump beam from 830 to 880 nm, and (b) the signal beam from 1470 to 1570 nm. In the former case, the wavelength of the signal is fixed at 1530 nm, while in the latter case the wavelength of the pump is fixed at 860 nm. The spectral location of the calculated SFG peak is indicated by black dotted lines. (c) Normalized nonlinear spectrum from metasurface, where two strong emission peaks centered at 430 and 550 nm are generated by the of the pump and the SFG process, respectively. (d) Intensity dependence of and SFG on pump power, shown in a log-log plot. The intensity depends quadratically on the pump power, while the SFG intensity depends linearly.
Next, the wavelength of the signal beam was tuned from 1470 to 1570 nm, while maintaining the pump beam fixed at 860 nm [see Fig. 4(b)]. The wavelength of the pump beam was chosen according to the maximum SFG observed in Fig. 4(a). Figure 4(b) shows the SFG emission from 541 to 555 nm, with a maximum at 549 nm, corresponding to a signal beam at 1530 nm. After the maximum at 549 nm, the SFG intensity gradually decreases with the increase of the signal wavelength. Through all these measurements, the average powers of the pump and signal beams, measured right before the metasurface, were kept constant at 18 and 14 mW, respectively. As shown in Figs. 4(a) and 4(b), the optimized SFG intensity takes place when the metasurface is excited by a pump beam at 860 nm and a signal beam at 1530 nm. This behavior is explained by the near-field enhancement of the excitation beams when the metasurface is resonantly excited at these excitation wavelengths [Figs. 3(c) and 3(d)].
The visible nonlinear spectrum of the metasurface is shown in Fig. 4(c), characterized by two strong nonlinear emissions at 430 and 550 nm. The metasurface was excited by the signal and pump beams at the optimized wavelengths using an average power of 10 mW in each beam, measured right before the metasurface. The shorter wavelength nonlinear emission at 430 nm originates from the SHG of the pump (), while the emission at 550 nm originates from the SFG process (). Other nonlinear processes are also generated in the metasurface at wavelengths longer than the SFG; however, these wavelengths are blocked by the short-pass filter (with cut-off wavelength of 600 nm) used to filter out the transmitted pump beam (see Fig. S5 in the Supplemental Material), thus they are not collected by our detection system.
Above the bandgap of the GaAs (1.42 eV, 873 nm), the absorption coefficient increases as the incident wavelength decreases. Therefore, in Fig. 4(c) the higher intensity of the , as compared to the SFG intensity, is unexpected. Traditionally, the stronger nonlinear intensity of a metasurface is associated to the near-field enhancement at the fundamental wave.27,32 However, the efficiency of the nonlinear frequency-mixing also depends on the spatial mode overlap of the interacting waves45–47 [Figs. 2(d) and 2(e)]. Inside the GaAs nanoantennnas, the field enhancement of the signal and pump beams has a similar intensity [see Fig. S2 in the Supplemental Material, as this is not reflected in the particular cross section of Figs. 2(d) and 2(e)]. Therefore, the higher intensity of the SHG () can be attributed to the full spatial overlap of the pump field with itself [Fig. 2(d)]. Whereas, in the case of SFG (), the spatial overlap between the signal and pump beams [Figs. 2(d) and 2(e)] is not complete, thereby the intensity of the SFG emission is weaker. It is worth noting that the SFG intensity is also dependent on the spatial overlap between the excitation and SFG fields (Fig. S3 in the Supplemental Material). Further studies can be performed to investigate the relative intensities of the nonlinear emissions. However, these studies are outside the scope of our work.
To verify the origin of the nonlinear emissions generated by the metasurface, the average power of the pump beam was gradually increased from 2 to 20 mW with a 2-mW step, while keeping the power of the signal beam constant. The intensity of the parametric emissions was recorded and analyzed on a log–log plot, as shown in Fig. 4(d). In the case of , a quadratic dependence on the pump power was obtained with a slope of 2.11; whereas in the case of the SFG, a linear dependence on the pump power with a slope of 1.13 was obtained. This linear dependence stems from the nature of the SFG process since the pump field contributes with a single photon to the frequency upconversion [Fig. 1(a)]. It also promotes a linear power-transfer function of the signal beam that thereby provides a direct translation of the information carried by the signal to the generated SFG beam. This linear transfer contrasts with the nonlinear imaging technique based on harmonic generation,48 which promotes a nonlinear transfer function of the input information. The SFG process further enables the possibility for upconversion of weak signals, which is not possible by a harmonic generation upconversion. The measured SFG conversion efficiency achieved for the metasurface was at average beam powers of and , corresponding to average intensities of and (see Sec. S2 in the Supplemental Material). This efficiency is lower than our numerical estimation, which we attribute to fabrication imperfections.
Importantly, when short pulses are used for both signal and pump beams in the SFG process, these two pulses require temporal synchronization (), as illustrated in the top of Fig. 5(a). In contrast, the is a degenerated nonlinear process where two photons come from the same pulse, thus no temporal synchronization is required in this case [bottom of Fig. 5(a)]. Here, we achieved temporal synchronization of the signal and pump pulsed beams using a free-space variable delay line with a micrometer adjustment to finely change the path length of the pump beam (see Fig. S5 in the Supplemental Material), and thus accurately control the time delay between pulses. The spectra of the upconverted nonlinear emissions were measured as a function of the time delay, as shown in Fig. 5(b). The experimental conditions used in these measurements were the same as the ones used in Fig. 4(c). It is noteworthy that the is independent of the time delay, while the strongest SFG emission is generated at a zero time delay. As can be seen in Fig. 5(b), when the time delay changes from zero to , the SFG intensity continuously drops until it becomes negligible. The temporal duration of the SFG emission was measured to be 267 fs, which is effectively the convolution of the signal and pump beam pulses (see Fig. S6 in the Supplemental Material). Therefore, the upconversion process preserves the temporal information of the femtosecond IR pulses and can find applications in ultrafast IR imaging of dynamic phenomena.49
Figure 5.(a) Schematic illustration of nonlinear emissions generated by the metasurface at different time delays, between the pump and signal pulses. () and SFG () are generated by the metasurface when the time delay between the pulses is zero (top row). The SFG emission vanishes when the time delay increases (bottom row). (b) 2D nonlinear spectra measured as a function of time delay. The strongest spectral emission centered at 430 nm is independent of the time delay, while the emission centered at 550 nm is strongly dependent of the time delay, having a width of 267 fs.
4.3 Infrared Imaging
Finally, we present the upconversion IR imaging enabled by the GaAs metasurface. In this experiment, the signal beam passes through a Siemens star target (see Fig. S7 in the Supplemental Material), which is imaged by the focusing lens onto the metasurface. The IR image in Fig. 6(a) (first frame) shows the metasurface and a section of a Siemens star [Fig. 6(b)] imaged in the same plane. The IR image was acquired with an InGaAs IR camera (Xenics, XS-1.7-320), using only signal beam illumination. At the metasurface, the SWIR image of the target is mixed with the mildly focused pump beam and through the SFG process upconverted to a visible image [Fig. 6(a), second frame]. The visible images were captured using a conventional CCD camera (Starlight Xpress, SXVR-H9). Ideally, all the spatial information in the SWIR image should be preserved into the visible, since the SFG is a coherent parametric process. However, in the case of a metasurface, the different spatial features of the target are being upconverted by hundreds of independent nanoantennas that are spatially distributed within the metasurface. Therefore, any fabrication imperfections of the nanoantennas could introduce additional noise into the visible image (in contrast to conventional schemes). Thus, metasurfaces require a good fabricated quality and uniformity to obtain clear images from the target. Other factors to consider in reducing the upconversion imaging noise are the detector and the pump beam. In our case, the thermal noise of the camera does not contribute significantly to the dark level, while the noise induced by the pump beam due to shot-to-shot noise and the transverse power fluctuations of the beam can be reduced by using squeezed light. Figure 6(c) shows four SFG images generated by our GaAs metasurface, captured on a CCD camera using an additional long-pass filter to filter out the emission. The SFG images [right-hand side of Fig. 6(c)] correspond to different transverse positions of the target [left-hand side of Fig. 6(c)], including the case when the target is fully removed from the path of the signal beam and the SFG emission from the whole metasurface is observed [Fig. 6(c), panel (i)]. The inhomogeneities observed in Fig. 6(c), panel (i), are due to fabrication defects in the metasurface as well as inhomogeneities in the pump beam. These small inhomogeneities are introduced by the 10 mirrors used in the additional distance (1.6 m) traveled by the pump beam, with respect to the signal beam. This additional distance is required to temporally synchronize the pump and signal beam pulses. Nevertheless, when different sections of the target are inserted into the path of the signal beam, the spatial features of the target are preserved in the upconverted images, as shown in Fig. 6(c), panels (ii)–(iv). When the pump and signal beams were temporally detuned, the visible images shown in Fig. 6(c) completely vanished, thus corroborating that they are only formed by the SFG process. In our experiment, the resolution of the upconverted images is limited mainly by the SWIR imaging of the target, which shows slight blurring [see IR image in Fig. 6(a)]. However, other factors such as the diffraction of the SFG emission can contribute to the slight blurring of the visible images, as compared to the IR ones (see Figs. S4b and S8b in the Supplemental Material). In our case, the size of the imaged target is on the order of tens of microns, thus the resolution is not directly limited by the periodicity of the metasurface. Another factor that can influence the resolution of the upconverted images is the coherence of the illuminating beams.50,51 Overall, the GaAs metasurface enables high-contrast and low-noise IR imaging at room temperature, which are great advantages when compared to other competing technologies.
Figure 6.(a) IR upconversion imaging using a GaAs metasurface: the IR signal beam passes through a target, which is imaged on the metasurface (MS). Mixing the IR image with the pump beam results in a visible image of the target (in the SFG beam), which is subsequently imaged by a lens onto a camera. The IR and visible images are acquired with an InGaAs and a CCD camera, respectively. The scale bars on both images are , while the size of the metasurface is . (b) Optical microscope image of the Siemens star used for imaging. The section of the target used in the IR image [see (a)] is highlighted by a black square. (c) Optical microscope images of different transverse positions of the target (left-hand side) and their corresponding upconverted images (right-hand side): (i) SFG emission when the target is removed and (ii)–(iv) SFG images for three positions of the target in the transverse plane.
5 Discussion and Conclusions
We have demonstrated for the first time, to the best of our knowledge, upconversion of an IR image to visible wavelengths by a resonant ultrathin GaAs metasurface. The upconversion is realized by nonlinear wave-mixing of SWIR images with a strong near-IR pump beam within the metasurface. The ultrafast nonlinear conversion of the sum-frequency process is dramatically enhanced in our 400-nm-thick metasurface due to the excitation of optical resonances at all three interacting waves. In this way, the IR signal can be easily detected with a conventional CCD camera. The realized upconversion process is parametric and does not exchange energy with the environment, and as such, all spatial information encoded into the IR signal beam is preserved during the upconversion. Despite different parts of the IR signal beam being upconverted by independent nanoantennas composing the metasurface, the images are well reproduced into the visible.
Unlike current IR cameras, our all-optical approach is not affected by thermal noise and can operate at room temperature using conventional CMOS detectors. Importantly, our metasurface-based IR imaging approach offers opportunities not possible in conventional upconversion systems where bulky nonlinear crystals are used. For example, the nonlinear wave-mixing can be obtained for counterpropagating pump and signal beams, as well as for incidence at all different angles, as long as the metasurface resonances are excited. Most importantly, multicolor SWIR imaging is also possible by an appropriately designed metasurface. In that case, the designed metasurface would be composed of nanoantennas with different sizes, having resonances at different IR signal wavelengths, while maintaining the fixed resonance of the pump beam. Such a metasurface would be able to convert several IR wavelengths to the visible according to energy conservation observed by the SFG parametric nonlinear process ().
We note that the sum-frequency conversion efficiency reported here needs to be further improved for the practical application of metasurfaces; however, several strategies can be applied to optimize and enhance the conversion efficiency. These strategies include the use of high-quality factor resonances25,52,53 and materials with higher transparency in the visible region.54 Further optimization could be achieved by employing machine learning approaches to simultaneously enhance light–matter interactions.55 We believe that by enhancing the SFG conversion efficiency, continuous-wave nonlinear upconversion is achievable. Furthermore, the employment of sensitive CMOS cameras and additional devices such as intensifiers can ease the conversion efficiency requirements. Finally, the simplification of the optical system used in this work can be realized by performing the upconversion process in the Fourier plane rather than in the real plane.
Our results can benefit the future development of compact night vision instruments and sensor devices. Notably, the SWIR metasurface imaging devices can be ultrathin and ultracompact, fabricated on flexible substrates, and fully transparent. In addition, they could offer new functionalities such as multicolor imaging at room temperature.
References
[1] J. M. Schmitt, S. H. Xiang, K. M. Yung. Differential absorption imaging with optical coherence tomography. J. Opt. Soc. Am. A, 15, 2288-2296(1998).
[2] N. Boone et al. Thermal near infrared monitoring system for electron beam melting with emissivity tracking. Addit. Manuf., 22, 601-605(2018).
[3] W. Wang, J. Paliwal. Near-infrared spectroscopy and imaging in food quality and safety. Sens. Instrum. Food Qual. Saf., 1, 193-207(2007).
[4] J.-E. Källhammer. Imaging: the road ahead for car night-vision. Nat. Photon., 12-13(2006).
[5] H. Xia et al. Long-range micro-pulse aerosol lidar at 1.5 μm with an upconversion single-photon detector. Opt. Lett., 40, 1579-1582(2015). https://doi.org/10.1364/OL.40.001579
[6] L. Høgstedt et al. Upconversion-based lidar measurements of atmospheric CO2. Opt. Express, 24, 5152-5161(2016). https://doi.org/10.1364/OE.24.005152
[7] J. E. Midwinter. Image conversion from 1.6 μ to the visible in lithium niobate. Appl. Phys. Lett., 12, 68-70(1968). https://doi.org/10.1063/1.1651902
[8] J. E. Midwinter. Infrared up conversion in lithium-niobate with large bandwidth and acceptance angle. Appl. Phys. Lett., 14, 29-32(1969).
[9] R. Andrews. IR image parametric up-conversion. IEEE J. Quantum Electron., 6, 68-80(1970).
[10] J. F. Weller, R. A. Andrews. Resolution measurements in parametric upconversion of images. Opto-electronics, 2, 171-176(1970).
[11] E. S. Voronin et al. The influence of the radiation spectrum bandwidth on the resolution of an image up-converter. Opto-electronics, 3, 153-155(1971).
[12] M. M. Abbas, T. Kostiuk, K. W. Ogilvie. Infrared upconversion for astronomical applications. Appl. Opt., 15, 961-970(1976).
[13] M. Vasilyev, P. Kumar. Frequency up-conversion of quantum images. Opt. Express, 20, 6644-6656(2012).
[14] A. J. Torregrosa, H. Maestre, J. Capmany. Intra-cavity upconversion to 631 nm of images illuminated by an eye-safe ASE source at 1550 nm. Opt. Lett., 40, 5315-5318(2015).
[15] R. Demur et al. Near-infrared to visible upconversion imaging using a broadband pump laser. Opt. Express, 26, 13252-13263(2018).
[16] P. M. Vaughan, R. Trebino. Optical-parametric-amplification imaging of complex objects. Opt. Express, 19, 8920-8929(2011).
[17] L. Huot et al. Upconversion imaging using an all-fiber supercontinuum source. Opt. Lett., 41, 2466-2469(2016).
[18] A. S. Ashik et al. Mid-infrared upconversion imaging using femtosecond pulses. Photonics Res., 7, 783-791(2019).
[19] A. Jacobo et al. Use of nonlinear properties of intracavity type II second harmonic generation for image processing. Appl. Phys. B, 81, 955-962(2005).
[20] M. J. Padgett, R. W. Boyd. An introduction to ghost imaging: quantum and classical. Philos. Trans. R. Soc. A, 375, 20160233(2017).
[21] D. Neshev, I. Aharonovich. Optical metasurfaces: new generation building blocks for multi-functional optics. Light Sci. Appl., 7, 58(2018).
[22] M. Rahmani et al. Nonlinear frequency conversion in optical nanoantennas and metasurfaces: materials evolution and fabrication. Opto-Electron. Adv., 1, 180021(2018).
[23] C. De Angelis, G. Leo, D. Neshev. Nonlinear Meta-Optics(2020).
[24] M. R. Shcherbakov et al. Enhanced third-harmonic generation in silicon nanoparticles driven by magnetic response. Nano Lett., 14, 6488-6492(2014).
[25] Y. Yang et al. Nonlinear fano-resonant dielectric metasurfaces. Nano Lett., 15, 7388-7393(2015).
[26] W. Tong et al. Enhanced third harmonic generation in a silicon metasurface using trapped mode. Opt. Express, 24, 19661-19670(2016).
[27] M. Semmlinger et al. Generating third harmonic vacuum ultraviolet light with a TiO2 metasurface. Nano Lett., 19, 8972-8978(2019). https://doi.org/10.1021/acs.nanolett.9b03961
[28] M. Ohashi et al. Determination of quadratic nonlinear optical coefficient of AlxGa1−xAs system by the method of reflected second harmonics. J. Appl. Phys., 74, 596-601(1993). https://doi.org/10.1063/1.355272
[29] V. F. Gili et al. Monolithic AlGaAs second-harmonic nanoantennas. Opt. Express, 24, 15965-15971(2016).
[30] S. Liu et al. Resonantly enhanced second-harmonic generation using iii–v semiconductor all-dielectric metasurfaces. Nano Lett., 16, 5426-5432(2016).
[31] R. Camacho-Morales et al. Nonlinear generation of vector beams from AlGaAs nanoantennas. Nano Lett., 16, 7191-7197(2016).
[32] S. Liu et al. An all-dielectric metasurface as a broadband optical frequency mixer. Nat. Commun., 9, 2507(2018).
[33] F. J. F. Löchner et al. Polarization-dependent second harmonic diffraction from resonant GaAs metasurfaces. ACS Photonics, 5, 1786-1793(2018).
[34] P. P. Vabishchevich et al. Enhanced second-harmonic generation using broken symmetry iii–v semiconductor fano metasurfaces. ACS Photonics, 5, 1685-1690(2018).
[35] G. Marino et al. Zero-order second harmonic generation from AlGaAs-on-insulator metasurfaces. ACS Photonics, 6, 1226-1231(2019).
[36] D. Rocco et al. Vertical second harmonic generation in asymmetric dielectric nanoantennas. IEEE Photonics J., 12, 4500507(2020).
[37] J. D. Sautter et al. Tailoring second-harmonic emission from (111)-GaAs nanoantennas. Nano Lett., 19, 3905-3911(2019).
[38] L. Xu et al. Forward and backward switching of nonlinear unidirectional emission from GaAs nanoantennas. ACS Nano, 14, 1379-1389(2020).
[39] J. Krieg, U. Adomeit. Comparative long-time visible and shortwave infrared night illumination measurements. Appl. Opt., 58, 9876-9882(2019).
[40] L. Carletti et al. Enhanced second-harmonic generation from magnetic resonance in AlGaAs nanoantennas. Opt. Express, 23, 26544-26550(2015).
[41] A. Noor et al. Mode-matching enhancement of second-harmonic generation with plasmonic nanopatch antennas. ACS Photonics, 7, 3333-3340(2020).
[42] D. E. Aspnes et al. Optical properties of AlxGa1−xAs. J. Appl. Phys., 60, 754-767(1986). https://doi.org/10.1063/1.337426
[43] M. Khorasaninejad et al. Multispectral chiral imaging with a metalens. Nano Lett., 16, 4595-4600(2016).
[44] J. Guo et al. Polarization multiplexing for double images display. Opto-Electron. Adv., 2, 180029(2019).
[45] M. Celebrano et al. Mode matching in multiresonant plasmonic nanoantennas for enhanced second harmonic generation. Nat. Nanotechnol., 10, 412-417(2015).
[46] R. Colom et al. Enhanced four-wave mixing in doubly resonant Si nanoresonators. ACS Photonics, 6, 1295-1301(2019).
[47] H. Harutyunyan et al. Enhancing the nonlinear optical response using multifrequency gold-nanowire antennas. Phys. Rev. Lett., 108, 217403(2012).
[48] C. Schlickriede et al. Nonlinear imaging with all-dielectric metasurfaces. Nano Lett., 20, 4370-4376(2020).
[49] L. Antonucci et al. Asynchronous optical sampling with arbitrary detuning between laser repetition rates. Opt. Express, 20, 17928-17937(2012).
[50] J. S. Dam, C. Pedersen, P. Tidemand-Lichtenberg. Theory for upconversion of incoherent images. Opt. Express, 20, 1475-1482(2012).
[51] S. Junaid et al. Mid-infrared upconversion based hyperspectral imaging. Opt. Express, 26, 2203-2211(2018).
[52] K. Koshelev et al. Subwavelength dielectric resonators for nonlinear nanophotonics. Science, 367, 288-292(2020).
[53] A. P. Anthur et al. Continuous wave second harmonic generation enabled by quasi-bound-states in the continuum on gallium phosphide metasurfaces. Nano Lett., 20, 8745-8751(2020).
[54] J. Cambiasso et al. Bridging the gap between dielectric nanophotonics and the visible regime with effectively lossless gallium phosphide antennas. Nano Lett., 17, 1219-1225(2017).
[55] L. Xu et al. Enhanced light–matter interactions in dielectric nanostructures via machine-learning approach. Adv. Photonics, 2, 026003(2020).