
Nian HE, Peng SHAN, Zhong-hai HE, Qiao-yun WANG, Zhi-gang LI, Zhui WU. Study on the Fractional Baseline Correction Method of ATR-FTIR Spectral Signal in the Fermentation Process of Sodium Glutamate[J]. Spectroscopy and Spectral Analysis, 2022, 42(6): 1848
- Spectroscopy and Spectral Analysis
- Vol. 42, Issue 6, 1848 (2022)
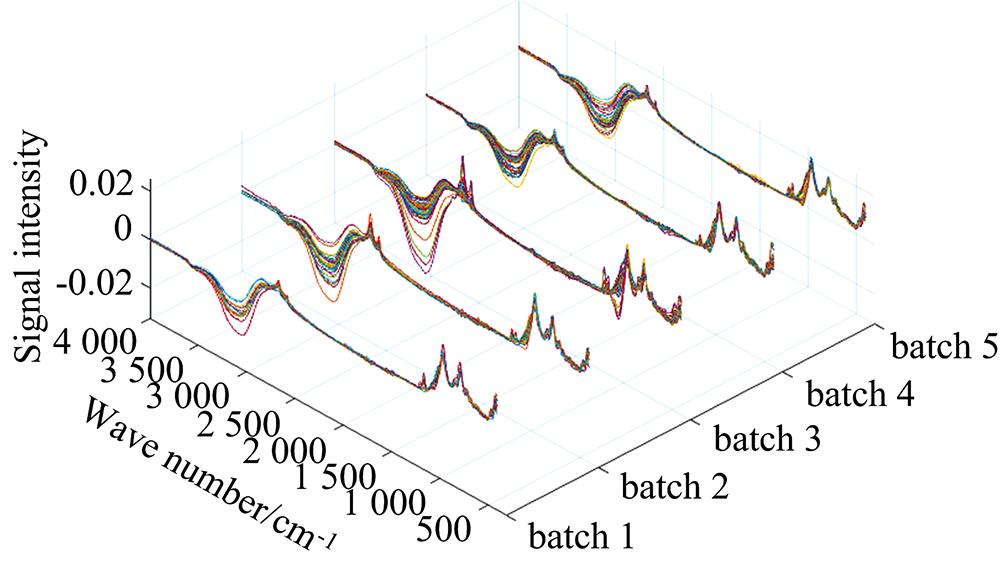
Fig. 1. Spectra of each batch
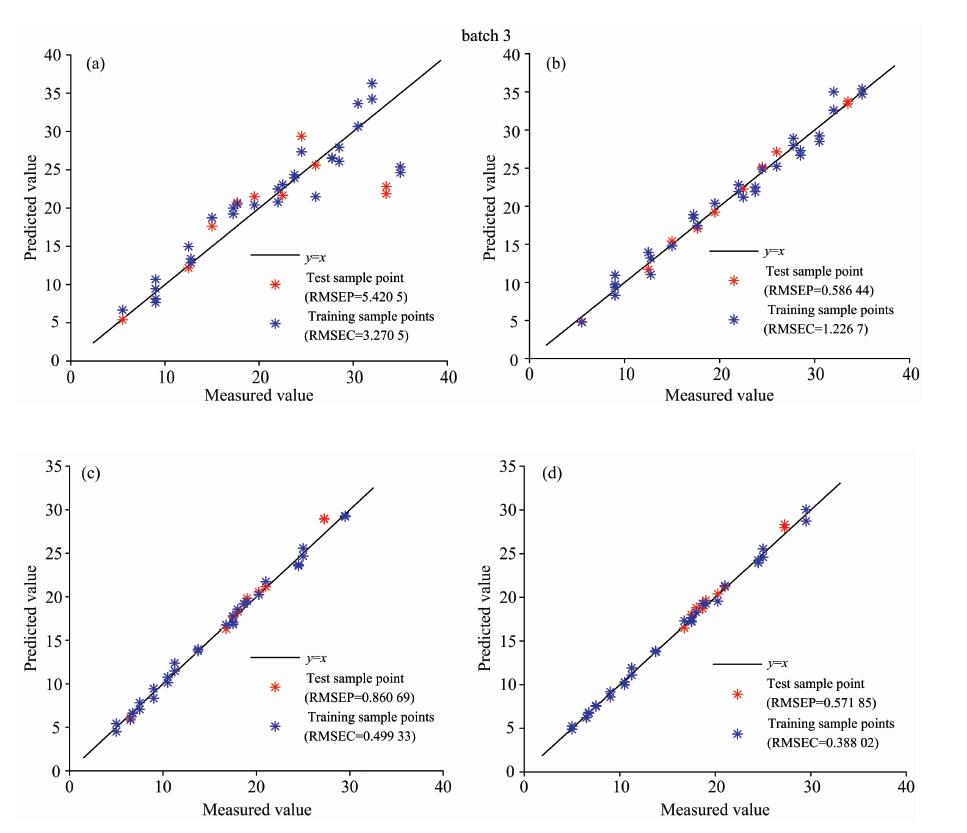
Fig. 2. Partial least squares regression analysis
(a): Predicted result of glucose concentration by the original spectrum; (b): Predicted result of glucose concentration after baseline correction; (c): Predicted result of sodium glutamate concentration by the original spectrum; (d): Predicted result of sodium glutamate conentration after baseline correction
(a): Predicted result of glucose concentration by the original spectrum; (b): Predicted result of glucose concentration after baseline correction; (c): Predicted result of sodium glutamate concentration by the original spectrum; (d): Predicted result of sodium glutamate conentration after baseline correction
Fig. 3. Baseline corrected spectra of glucose for each batch with the minimum RMSEP
Fig. 4. Baseline corrected spectra of sodium glutamate for each batch with the minimum RMSEP
| ||||||||||||||||||||||||||||||||||||||||||||||||||||||||||||||||||||||||||||||||||||||||||||||||||||||||||||||||||||||||||||||||||||||||||||||||||||||||||||||||||||||||||||||||||||||||||||||||||||||||||||||||||||||||||||||||||||||||||||||||||||||||
Table 1. Comparison of baseline correction effects of different orders


Set citation alerts for the article
Please enter your email address

© Copyright 2018-2021 | Chinese Laser Press. All Rights Reserved 沪ICP备15018463号-20