
Yoon-Soo Jang, Jinkang Lim, Wenting Wang, Seung-Woo Kim, Anatoliy Savchenkov, Andrey B. Matsko, Chee Wei Wong, "Measurement of sub-fm/Hz1/2 displacement spectral densities in ultrahigh-Q single-crystal microcavities with hertz-level lasers," Photonics Res. 10, 1202 (2022)
- Photonics Research
- Vol. 10, Issue 5, 1202 (2022)
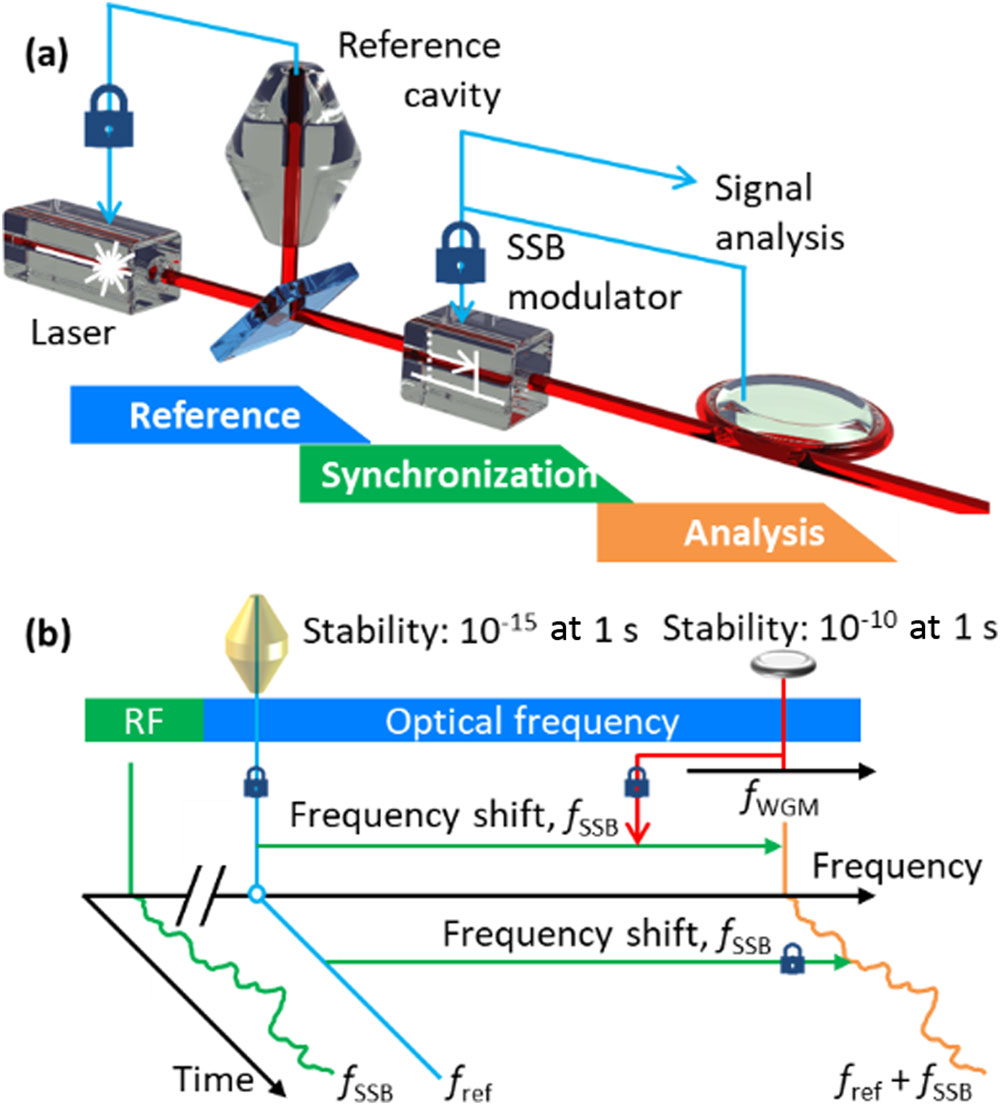
Fig. 1. Conceptual image of sub-femtometer / Hz 1 / 2 femtometer / Hz 1 / 2 10 − 15 femtometer / Hz 1 / 2 f ref f SSB 10 5 f SSB
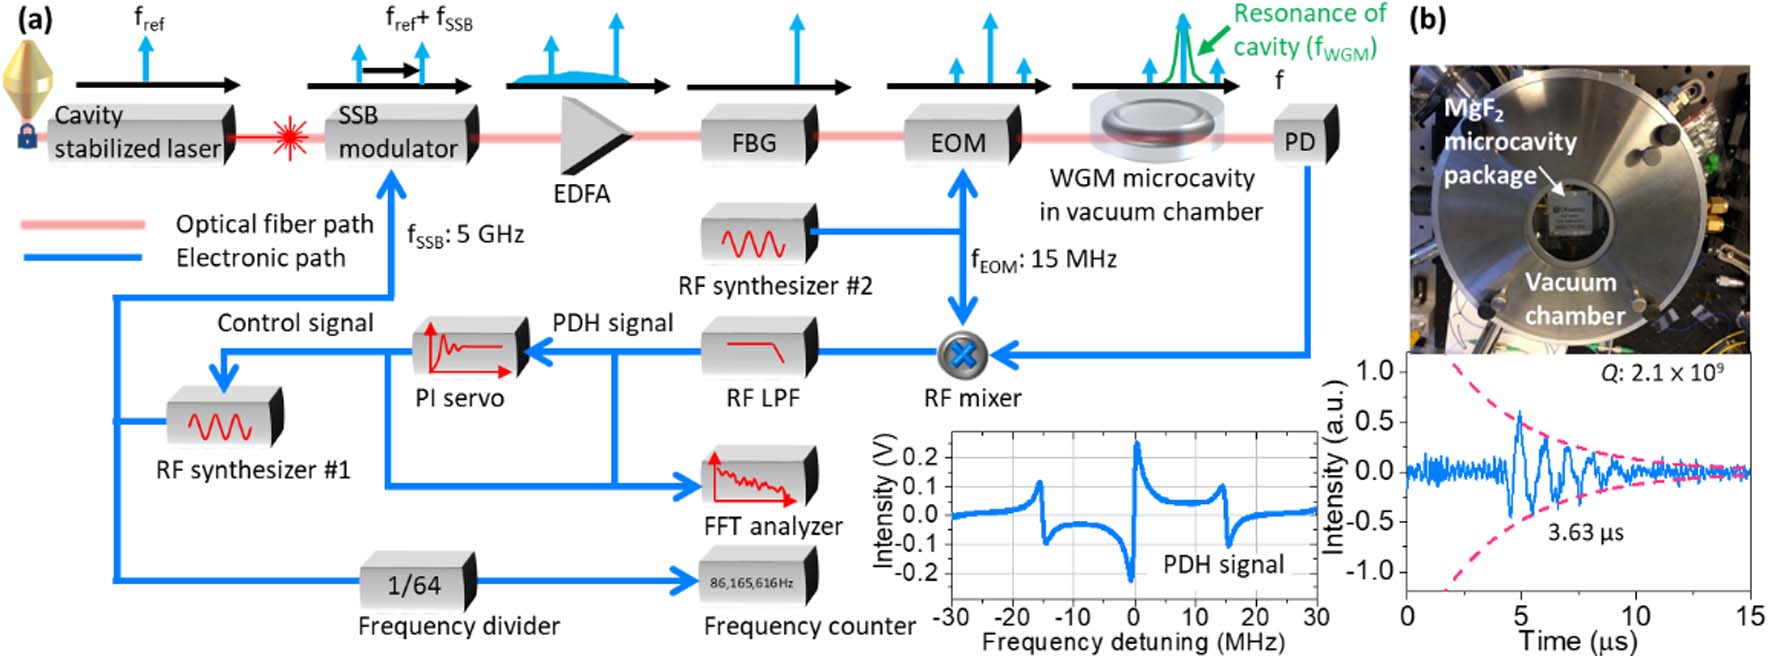
Fig. 2. Sub-femtometer / Hz 1 / 2 f ref MgF 2 f WGM MgF 2 MgF 2
Fig. 3. Frequency noise and displacement on the MgF 2 MgF 2 f SSB MgF 2 y Hz / Hz 1 / 2 y m / Hz 1 / 2 1 fm / Hz 1 / 2 16.7 Hz / Hz 1 / 2
Fig. 4. Real-time trace of frequency shift and displacement on MgF 2 MgF 2 MgF 2 y MgF 2 MgF 2 y 3 for the short-term time (10 − 5 10 − 1 10 − 1 MgF 2
Fig. 5. Real-time measurement of the response dynamics of the MgF 2 MgF 2 MgF 2
Fig. 6. Conceptual schematic of resonance tracking-based subfemtometer motional displacement measurements in linear Fabry–Perot cavities and interferometry. The red line and blue line correspond to the optical and electrical lines, respectively. The right mirror of the ultrahigh-Q FP cavity is mounted to the target.


Set citation alerts for the article
Please enter your email address

© Copyright 2018-2021 | Chinese Laser Press. All Rights Reserved 沪ICP备15018463号-20