• Photonics Research
  • Vol. 10, Issue 5, 1202 (2022)
Yoon-Soo Jang1、2、7、†, Jinkang Lim1、3、†, Wenting Wang1, Seung-Woo Kim4, Anatoliy Savchenkov5, Andrey B. Matsko6, and Chee Wei Wong1、*
Author Affiliations
  • 1Fang Lu Mesoscopic Optics and Quantum Electronics Laboratory, University of California, Los Angeles, California 90095, USA
  • 2Current address: Division of Physical Metrology, Korea Research Institute of Standards and Science (KRISS), Daejeon 34113, Republic of Korea
  • 3Current address: CACI-LGS Labs, Florham Park, New Jersey 07932, USA
  • 4Department of Mechanical Engineering, Korea Advanced Institute of Science and Technology (KAIST), Daejeon 34141, Republic of Korea
  • 5OEwaves Inc., Pasadena, California 91107, USA
  • 6Jet Propulsion Laboratory, California Institute of Technology, Pasadena, California 91109, USA
  • 7e-mail: ysj@kriss.re.kr
  • show less
    DOI: 10.1364/PRJ.449782 Cite this Article Set citation alerts
    Yoon-Soo Jang, Jinkang Lim, Wenting Wang, Seung-Woo Kim, Anatoliy Savchenkov, Andrey B. Matsko, Chee Wei Wong. Measurement of sub-fm/Hz1/2 displacement spectral densities in ultrahigh-Q single-crystal microcavities with hertz-level lasers[J]. Photonics Research, 2022, 10(5): 1202 Copy Citation Text show less

    Abstract

    Tracing a resonance frequency of a high quality factor (Q) optical cavity facilitates subpicometer displacement measurements of the optical cavity via Pound–Drever–Hall (PDH) locking scheme, tightly synchronizing a laser frequency to the optical cavity. Here we present observations of subfemtometer displacements on a ultrahigh-Q single-crystal MgF2 whispering-gallery-mode microcavity by frequency synchronization between a 1 Hz cavity-stabilized laser and a resonance of the MgF2 cavity using PDH laser-cavity locking. We characterize not only the displacement spectral density of the microcavity with a sensitivity of 1.5×10⁻¹⁶ m/Hz1/2 over the Fourier offset frequency ranging from 15 mHz to 100 kHz but also a 1.77 nm displacement fluctuation of the microcavity over 4500 s. Such measurement capability not only supports the analysis of integrated thermodynamical and technical cavity noise but allows for minute displacement measurements using laser-cavity locking for ultraprecise positioning, metrology, and sensing.

    1. INTRODUCTION

    Length is one of the fundamental physical quantities. The capability of its precise measurement has a strong impact on diverse areas in science and technology [1,2]. Rapid and precise measurements of extremely small displacements are indispensable for the observation of optomechanical dynamical motion [37], Brownian motion [810], high-resolution metrology for forces and fields [11], and calibration of ultraprecise length standards [12,13]. Laser interferometry through heterodyne and homodyne principles for subwavelength precision has led the displacement measurement toward high precision and minimizing periodic error [14]. Recent research in the laser interferometric distance measurement, determining a target distance with single operation, has shown a kilometer-scale distance measurement with nanometer precision by aid of frequency comb using its direct traceability to the microwave time standard with various methods [1518]. However, these laser-interferometric-based displacement or distance measurements are practically bounded at subpicometer sensitivities due to the precision limitation of interferometric phase measurement [19]. Alternatively, cavity Fabry–Perot (FP) interferometry, based on tracking the resonance of an FP cavity, is capable of measuring subpicometer level displacement without periodic errors [20]. The FP cavity has usually been used to stabilize a laser frequency by synchronizing the laser carrier frequency to a resonance frequency of an FP cavity through a Pound–Drever–Hall (PDH) locking scheme [21]. Isolated high-finesse FP cavities have played a key role in ultrastable optical frequency generation and slave clocks for optical lattice clocks [2224]. Over the last decade, high-Q whispering-gallery-mode (WGM) microcavities, tolerant to mechanical noise, have been developed for achieving high-performance optical clocks [2527], low-noise microwave oscillators [28,29], and optical frequency combs with miniaturized system formats [27,3032]. Complementing and somewhat contrary to laser stabilization, cavity locking measures displacement on the optical cavity, which is converted into a resonance frequency change of the cavity, by measuring the beat frequency with a stabilized laser [33]. This technique demonstrates ultraprecision fiber-optic strain sensing. Furthermore, a PDH locking scheme facilitates measurement of Brownian and optomechanical motion of microscale optics as the PDH error signal converts frequency fluctuations into an electrical signal, which enables fast dynamic measurement [3436].

    Here we present real-time measurements of femtometer displacement on an ultrahigh-Q WGM MgF2 microcavity through laser-cavity synchronization. A hertz (Hz)-level linewidth laser with 1015 fractional instability at 1 s averaging time is implemented for providing a measurement frequency reference and for interrogating the cavity resonance by shifting the laser frequency via a single-sideband (SSB) modulator. We monitor the fluctuation of the MgF2 WGM microcavity resonance mode in the RF regime by reading out the laser frequency shift when the laser is locked to the microcavity. Over a Fourier offset frequency range of 15 mHz to 100 kHz, the displacement power spectral density of the MgF2 microcavity achieves a sensitivity of 1.5×10¹⁶  m/Hz1/2, corresponding to a frequency noise of 2.6  Hz/Hz1/2. We quantitatively analyze the cavity length stability of the MgF2 WGM microcavity from 10 μs to 464 s. Our proposed scheme potentially allows not only the measurements of subfemtometer displacements but also the analysis of frequency noise in optical cavities simultaneously.

    2. RESULTS

    A. Measurement of Sub-fm/Hz1/2 Displacement in a MgF2 WGM Single-Crystal Microcavity

    Figure 1 shows the schematic of subfemtometer displacement measurement for the MgF2 WGM microcavity. Our proposed system consists of a 1 Hz ultrastable interrogation laser and a microcavity under test with the synchronization electronics. The interrogation laser is tightly stabilized to an ultrastable optical cavity and provides a frequency reference point (fref). The flexibly shifted laser frequency (fSSB) via an SSB modulator is used to interrogate a resonance mode of the MgF2 WGM microcavity (fWGM) [37]. Since the reference laser frequency stability is far better than the stability of the microcavity resonance frequency, the resulting frequency deviation of the SSB modulator (ΔfSSB) is equivalent to the fluctuations of the MgF2 WGM microcavity resonance frequency (ΔfWGM) when the shifted laser frequency is locked to the microcavity resonance. Since the SSB modulator frequency (fSSB) is in the RF regime, frequency fluctuations of the MgF2 WGM microcavity resonance mode can be analyzed in the RF regime as shown in Fig. 1(b). The optical path length variation of the MgF2 WGM microcavity (ΔLWGM) can be simply determined as ΔLWGM/LWGM=ΔfWGM/fWGM. Note that LWGM includes the refractive index of the MgF2 WGM microcavity in this study.

    Conceptual image of sub-femtometer/Hz1/2 scale displacement measurement. (a) Architecture of the sub-femtometer/Hz1/2 displacement measurement. A laser stabilized to reference cavity with 10−15 fractional stability at 1 s is used as a frequency reference, while an SSB modulator locks the laser frequency to the WGM microcavity resonance mode. (b) Frequency-domain configuration of sub-femtometer/Hz1/2 displacement measurement. The reference laser frequency (fref) is shifted with SSB modulator by fSSB to lock to the microcavity resonance. Since the reference laser has 105 higher fractional stability than the microcavity, a fluctuation of frequency shift (fSSB) reflects the fluctuation of the microcavity.

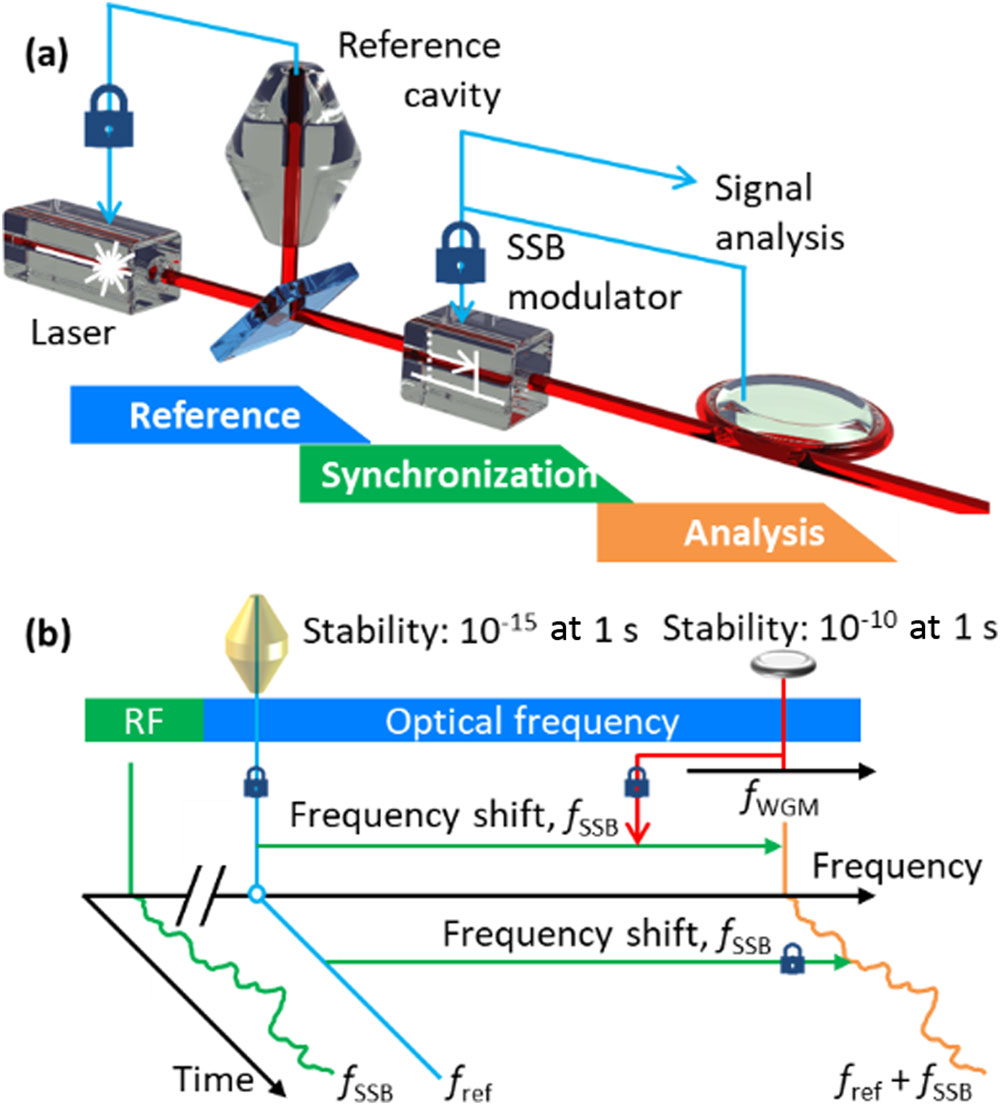
    Figure 1.Conceptual image of sub-femtometer/Hz1/2 scale displacement measurement. (a) Architecture of the sub-femtometer/Hz1/2 displacement measurement. A laser stabilized to reference cavity with 1015 fractional stability at 1 s is used as a frequency reference, while an SSB modulator locks the laser frequency to the WGM microcavity resonance mode. (b) Frequency-domain configuration of sub-femtometer/Hz1/2 displacement measurement. The reference laser frequency (fref) is shifted with SSB modulator by fSSB to lock to the microcavity resonance. Since the reference laser has 105 higher fractional stability than the microcavity, a fluctuation of frequency shift (fSSB) reflects the fluctuation of the microcavity.

    Figure 2 depicts the experimental setup of the subfemtometer displacement measurement of the MgF2 WGM microcavity with a PDH locking scheme. A cavity-stabilized continuous-wave laser with 1 Hz linewidth, 1015 fractional stability at 1 s, and 0.1 Hz/s drift rate (Stable Laser Systems SLS-INT-1550-100-1) at 1565.54 nm is used as a frequency reference in this study. The SSB modulator (iXblue photonics MXIQER-LN-30) imparts a frequency shift around 5 GHz (fSSB) to interrogate a resonance mode of the MgF2 WGM microcavity. An erbium-doped fiber amplifier (EDFA) increases the output power to compensate for optical losses along the beam path. A fiber Bragg grating filter (FBG, JDSU TB90226) is used to suppress the amplified spontaneous emission (ASE) noise and set to maximize the intensity of the frequency-shifted laser power. The output beam is sequentially phase-modulated through an electro-optic modulator (EOM, Thorlabs LN53S-FC) with a fixed 15 MHz (fEOM) driving frequency for the PDH lock. Finally, the output beam with ≈50 μW is coupled into the MgF2 WGM microcavity packaged with a photodetector. The device is mounted in a vacuum chamber with 4×10⁴ vacuum level (53 mPa). The MgF2 WGM microcavity has an ultrahigh-Q factor of 2.1×10⁹ [38], with free spectral range (FSR) of 26.5 GHz, which corresponds to a 11.31 mm optical cavity length (LWGM).

    Sub-femtometer/Hz1/2 displacement measurement setup. (a) The FP cavity stabilized laser provides the frequency reference point. The PDH scheme generates the error signal to synchronize the reference laser frequency (fref) with the MgF2 WGM microcavity resonance mode (fWGM) using the SSB modulator. Fluctuation of the WGM microcavity is recorded by the FFT spectrum analyzer and frequency counter. The inset shows the PDH error signal near the MgF2 microcavity resonance. SSB modulator, single-sideband modulator; EDFA, erbium-doped fiber amplifier; FBG, fiber Bragg grating; EOM, electro-optic modulator; WGM microcavity, whispering-gallery-mode microcavity; PD, photodetector; RF synthesizer, radio-frequency synthesizer; RF LPF, radio-frequency low-pass filter; PI servo, proportional-integral servo controller. (b) Upper figure shows vacuum chamber system. Lower figure shows the optical ring-down measurement of the MgF2 microcavity.

    Figure 2.Sub-femtometer/Hz1/2 displacement measurement setup. (a) The FP cavity stabilized laser provides the frequency reference point. The PDH scheme generates the error signal to synchronize the reference laser frequency (fref) with the MgF2 WGM microcavity resonance mode (fWGM) using the SSB modulator. Fluctuation of the WGM microcavity is recorded by the FFT spectrum analyzer and frequency counter. The inset shows the PDH error signal near the MgF2 microcavity resonance. SSB modulator, single-sideband modulator; EDFA, erbium-doped fiber amplifier; FBG, fiber Bragg grating; EOM, electro-optic modulator; WGM microcavity, whispering-gallery-mode microcavity; PD, photodetector; RF synthesizer, radio-frequency synthesizer; RF LPF, radio-frequency low-pass filter; PI servo, proportional-integral servo controller. (b) Upper figure shows vacuum chamber system. Lower figure shows the optical ring-down measurement of the MgF2 microcavity.

    The PDH error signal, demodulated by a double-balanced RF mixer and RF low-pass filter, is generated near the MgF2 WGM microcavity reference with a sharp sensitivity of 1 MHz/V over 475 kHz as shown in the inset of Fig. 2(a). The PDH error signal is split into two branches for frequency synchronization and analysis. The PDH error signal is fed to a proportional-integral (PI) servo controller (New Focus LB 1005) and the closed loop generates a control signal for synchronizing the laser frequency to the cavity resonance frequency. The control voltage signal is then fed to the voltage-controlled frequency modulation port of the RF synthesizer (Stanford Research Systems SG384), which shifts the synthesizer output frequency. The range of frequency shift (ΔfSSB) is set to be ±10  MHz, which has linear relation with control voltage from 1  V to +1  V, corresponding to 0.59 nm displacement of the optical cavity length. Consequently, the servo-controlled driving frequency to the SSB modulator synchronizes the laser frequency to the cavity resonance. A fast Fourier transform (FFT) analyzer (Stanford Research Systems SR770) is used for measuring the high-frequency noise up to 100 kHz, and frequency noise associated with displacement fluctuation is determined by measuring the control signal [39]. A frequency counter simultaneously records the driving frequency to the SSB modulator for monitoring low-frequency noise with a 10 Hz update rate. More measurement information on the PDH error signal and control signal analysis is detailed in Appendices A and B.

    B. Dynamical Measurement of the MgF2 WGM Microcavity Displacement Fluctuation

    To minimize the influence of technical noise from the surrounding environment, the vacuum chamber is evacuated to 4×10⁴  torr (53 mPa). Figure 3 shows the frequency noise power spectral density curves and the corresponding displacements of the MgF2 WGM microcavity. The blue line is analyzed by the control signal. Since our servo bandwidth is approximately 500 kHz, provided by the frequency modulation port of the RF synthesizer, the servo bump does not appear in our servo control signal frequency noise measured up to 100 kHz. Below 1 Hz offset frequency, the power spectral density curve falls off as f2, which implies that drift and random walk of the resonance frequency are dominant. From 1 Hz to 10 kHz offset frequency, the power spectral density curve has an f1/2 dependence, illustrating the impact of flicker noise caused by the residual optical and electrical noises from the unsuppressed environment. The minimum point of the power spectral density is 2.6  Hz/Hz1/2 at 10 kHz frequency offset, corresponding to a displacement of 1.5×10¹⁶  m/Hz1/2. Note that the sharp and strong peaks from tens to hundreds of Hz originate from the 60 Hz harmonics of the electrical power line noise. A rising point over 10 kHz stems from the frequency noise of the cavity stabilized reference laser due to its servo bump, and it is not caused by the frequency synchronization electronics for this measurement.

    Frequency noise and displacement on the MgF2 WGM microcavity. The power spectral density of frequency noise and displacement of the MgF2 WGM microcavity measured by the frequency shift (fSSB) for synchronization between the cavity stabilized laser and the MgF2 WGM microcavity. The left y axis shows the frequency noise in Hz/Hz1/2, and the right y axis shows the equivalent displacement in m/Hz1/2 units. Displacement of 1 fm/Hz1/2 corresponds to frequency noise of 16.7 Hz/Hz1/2. Frequency noises analyzed from the control signal (blue color) with frequency synchronization and PDH error signal (yellow color) without frequency synchronization are illustrated for comparison. Pink color denotes the frequency noise without vacuum, and the orange line denotes the combined thermal noise predictions from our theoretical model. PDH error signal after frequency synchronization (olive color) and noise floor of PDH error signal (gray color) are also illustrated.

    Figure 3.Frequency noise and displacement on the MgF2 WGM microcavity. The power spectral density of frequency noise and displacement of the MgF2 WGM microcavity measured by the frequency shift (fSSB) for synchronization between the cavity stabilized laser and the MgF2 WGM microcavity. The left y axis shows the frequency noise in Hz/Hz1/2, and the right y axis shows the equivalent displacement in m/Hz1/2 units. Displacement of 1  fm/Hz1/2 corresponds to frequency noise of 16.7  Hz/Hz1/2. Frequency noises analyzed from the control signal (blue color) with frequency synchronization and PDH error signal (yellow color) without frequency synchronization are illustrated for comparison. Pink color denotes the frequency noise without vacuum, and the orange line denotes the combined thermal noise predictions from our theoretical model. PDH error signal after frequency synchronization (olive color) and noise floor of PDH error signal (gray color) are also illustrated.

    For verification of the measured power spectral density from the control signal, the power spectral density, analyzed by the PDH error signal without frequency synchronization, is also plotted as the yellow line in Fig. 3 [35]. This reflects solely the fluctuation of the MgF2 WGM microcavity. The two power spectral density plots of the control signal and the PDH error signal are well matched on top of each other from 2 Hz to 100 kHz. Note that the power spectral density of the PDH error signal provides noise down to a few Hz offset frequency due to the resonance frequency drift of the MgF2 WGM microcavity; the control signal power spectral density subsequently allows the measurement of noise at even lower offset frequencies down to 10 mHz.

    The orange line shows the theoretically estimated thermodynamical noise level of our MgF2 WGM microcavity [26,40,41]. Discussion on the theoretical noise limits is detailed in Appendix C. The measured noise level is slightly higher than the theoretically estimated thermodynamical noise level. This deviation is attributed to the insufficient evacuation level in our vacuum chamber and unsuppressed thermal fluctuation around the MgF2 WGM microcavity. To evaluate the vacuum effect, we measure the frequency noise power spectral density and displacement without evacuation as plotted in pink. Its power spectral density shows the higher noise at above 1 Hz offset frequency wherein acoustic noise is dominant. In other words, a vacuum is effective for suppressing environmental noise. We believe that the lack of vacuum level and the heat capacitance of the vacuum chamber result in unwanted residual thermal fluctuations. The measured noise level is well matched with our theoretical estimate of enhancement with the vacuum state and the heat capacitance to minimize thermal fluctuation [26]. The olive line in Fig. 3 shows the PDH error signal after frequency synchronization, which demonstrates the tight locking between the interrogation laser and the MgF2 WGM microcavity. The gray line shows the noise floor of the PDH error signal, which is the PDH error signal noise when the laser frequency is out of the microcavity resonance mode. Below 50 Hz and over 10 kHz, the PDH error signal (olive line) after frequency synchronization is higher than its noise floor (gray line). A slowly varying drift of the zero point of the PDH error signal due to environmental variations would influence noise below 50 Hz offset frequencies [42,43], while the PDH error signal at the higher offset frequencies is limited by the cavity stabilized reference laser.

    Figure 4 illustrates the real-time traces of the resonance frequency and the corresponding displacement variations. Figure 4(a) shows a typical time-series trace of the MgF2 WGM microcavity resonance frequency at the vacuum level of 53 mPa. The voltage-controlled input port of the RF synthesizer is set to be 10 MHz with a ±1 V applied voltage range. The frequency shift (fSSB) of the single-sideband modulator, corresponding to the resonance frequency shift of the MgF2 WGM microcavity, is recorded by the frequency counter with 10 Hz update rate. Within a measurement time period of 300 s, a displacement of 158pm in the MgF2 WGM microcavity is observed. The slowly varying dynamics of the MgF2 WGM microcavity is estimated to be strongly correlated to the thermal fluctuations of the WGM MgF2 microcavity [40,41] induced by sensitivity of the cavity to environmental temperature fluctuations and the recirculating intracavity power, since the thermal response of the MgF2 WGM microcavity is relatively slow compared to the other technical noise responses.

    Real-time trace of frequency shift and displacement on MgF2 WGM microcavity. (a) Example time trace of the MgF2 WGM microcavity resonance frequency shift during 300 s. Equivalent displacement on the MgF2 WGM microcavity is shown in right y axis. Inset is a magnified view from 20 s to 60 s. (b) Long-term time trace of the MgF2 WGM microcavity resonance frequency shift with extended locking range of 30 MHz during 4500 s. Inset is a magnified view from 3380 s to 3420 s. (c) Stability of the MgF2 microcavity resonance frequency. Equivalent fractional stability and displacement are plotted in the left and right y axis, respectively. The frequency stability estimated from frequency noise as shown in Fig. 3 for the short-term time (10−5 to 4.6 s) is plotted in blue. The frequency stability from the frequency counter for the long-term time scale (10−1 to 464 s) is plotted in green and yellow. The results are well matched in overlapped region of 10−1 to 4.6 s. The olive line is the estimated relative fractional stability between the frequency-shifted laser and MgF2 microcavity, bounded by our measurement repeatability.

    Figure 4.Real-time trace of frequency shift and displacement on MgF2 WGM microcavity. (a) Example time trace of the MgF2 WGM microcavity resonance frequency shift during 300 s. Equivalent displacement on the MgF2 WGM microcavity is shown in right y axis. Inset is a magnified view from 20 s to 60 s. (b) Long-term time trace of the MgF2 WGM microcavity resonance frequency shift with extended locking range of 30 MHz during 4500 s. Inset is a magnified view from 3380 s to 3420 s. (c) Stability of the MgF2 microcavity resonance frequency. Equivalent fractional stability and displacement are plotted in the left and right y axis, respectively. The frequency stability estimated from frequency noise as shown in Fig. 3 for the short-term time (105 to 4.6 s) is plotted in blue. The frequency stability from the frequency counter for the long-term time scale (101 to 464 s) is plotted in green and yellow. The results are well matched in overlapped region of 101 to 4.6 s. The olive line is the estimated relative fractional stability between the frequency-shifted laser and MgF2 microcavity, bounded by our measurement repeatability.

    For further long-term measurement [Fig. 4(b)], we set the RF synthesizer voltage-controlled input port to 30 MHz with a ±1  V applied voltage range and measure the resonance frequency of the MgF2 WGM microcavity over 4500 s. During this measurement, we observe approximately a 30 MHz linear drift, corresponding to 1.77 nm displacement variation in the MgF2 WGM microcavity. This drift is estimated from thermal expansion of the MgF2 WGM microcavity. To quantitatively analyze the dynamics of the MgF2 WGM microcavity, we analyze the measurement stability by calculating the Allan deviation from the data shown in Figs. 3, 4(a), and 4(b). For the short-term time scale (10 μs to 4.6 s), the power spectral density of the control signal is used to obtain the Allan deviation, and the frequency counter data is used for longer time scale (0.1 s to 464 s). In overlapping region (0.1 s to 4.6 s), the obtained Allan deviations are well matched to each other. We obtained a stability of the optical cavity length of the MgF2 WGM microcavity from 100 μs to 464 s. The estimated relative fractional stability of frequency synchronization between the frequency-shifted laser and the MgF2 WGM microcavity resonance frequency represents the limitation of our measurement repeatability, and is also plotted as an olive color in Fig. 4(c).

    Figure 5 illustrates the real-time dynamic motion measurement of the MgF2 WGM microcavity. An intentional displacement on the MgF2 WGM microcavity was made from thermal modulation of a thermal pad under the mount of the MgF2 WGM microcavity, controlled with 500 μA current from 0.1 to 2 Hz modulation frequencies. Experimental methods on the MgF2 microcavity thermal modulation are detailed in Appendix D. We clearly observed a modulated resonance frequency of the MgF2 WGM microcavity. We also found that an amplitude of resonance frequency modulation increased at low modulation frequency as shown in Fig. 5(b). This modulation-frequency-dependent amplitude of the resonance frequency modulation seems to be attributed by the slow thermal response of the MgF2 WGM microcavity and the thermal pad. A variation of the intracavity temperature was estimated to be less than 1 mK level at a 0.1 Hz modulation frequency. Our approach can also be extended to measure dynamical subfemtometer motional displacements in linear Fabry–Perot cavities and interferometry. We believe that our proposed method has the potential for ultraprecision measurement such as futuristic femtometer displacement measurement using Fabry–Perot interferometry or sub-millikelvin temperature sensing.

    Real-time measurement of the response dynamics of the MgF2 WGM microcavity under thermal modulations. (a) Time trace of dynamic motion of the MgF2 WGM microcavity under thermal modulation with 0.1 to 2 Hz modulation frequency. (b) Amplitude modulation of resonance frequency of the MgF2 microcavity in relation to modulation frequency while modulation amplitude is fixed to 0.5 mA. Inset is its log-scale plot.

    Figure 5.Real-time measurement of the response dynamics of the MgF2 WGM microcavity under thermal modulations. (a) Time trace of dynamic motion of the MgF2 WGM microcavity under thermal modulation with 0.1 to 2 Hz modulation frequency. (b) Amplitude modulation of resonance frequency of the MgF2 microcavity in relation to modulation frequency while modulation amplitude is fixed to 0.5 mA. Inset is its log-scale plot.

    Tracing a resonance frequency of an optical cavity can be applied in an axial displacement measurement using Fabry–Perot cavities [4447]. Figure 6 shows a conceptual view of axial motional displacement measurement using a Fabry–Perot cavity. One of mirror of the Fabry–Perot cavity can be mounted to a target surface. As demonstrated in the main text, our proposed scheme has a capability of sub-femtometer/Hz1/2 scale displacement measurement. Such capability can be applied in atomic force microscopy (AFM), traceability transfer to nanometer scale displacement measurement, and calibration of displacement sensors.

    Conceptual schematic of resonance tracking-based subfemtometer motional displacement measurements in linear Fabry–Perot cavities and interferometry. The red line and blue line correspond to the optical and electrical lines, respectively. The right mirror of the ultrahigh-Q FP cavity is mounted to the target.

    Figure 6.Conceptual schematic of resonance tracking-based subfemtometer motional displacement measurements in linear Fabry–Perot cavities and interferometry. The red line and blue line correspond to the optical and electrical lines, respectively. The right mirror of the ultrahigh-Q FP cavity is mounted to the target.

    3. CONCLUSION

    In summary, we have shown an observation of subfemtometer dynamics on the ultrahigh-Q single-crystal MgF2 WGM microcavity. The stabilized Hz-level laser with 1015 fractional frequency instability serves as a fixed reference frequency (fref), which is locked to the MgF2 WGM microcavity by the frequency shift (fSSB) via an SSB modulator. Since the fluctuation of the reference laser frequency is negligible, the fluctuation of the microcavity resonance frequency is mapped onto the frequency shift (fSSB) that is subsequently analyzed in the microwave regime. The control signal for tracking a resonance frequency of the MgF2 WGM microcavity is analyzed to evaluate its frequency noise and displacement spectral densities. We demonstrated dynamical measurements of the microcavity with ultrahigh-precision sensitivity of 1.5×10¹⁶  m/Hz1/2 over the broad Fourier offset frequency ranging from 15 mHz to 100 kHz. Furthermore, we measured the real-time dynamics of the single-crystal microcavity with 1.77 nm displacement over 4500 s and quantitatively analyzed its stability from 10 μs to 464 s averaging time. Our proposed scheme enables highly sensitive, precise, and fast measurements of the fluctuation in the optical cavity displacement with reliable traceability to an optical frequency standard. We believe that the current scheme can potentially be utilized not only for the frequency noise analysis of ultrahigh-Q cavities for optical clocks but also for measuring ultraprecise small displacement to evaluate optomechanical Brownian motion, distance measurements, and calibration with traceability to frequency standards as well as measurements of dynamical motion on microstructures.

    Acknowledgment

    Acknowledgment. The authors acknowledge discussions with Jaime Flor Flores. Y.-S.J. acknowledges the support of the Korea Research Institute of Standards and Science. S.-W.K. acknowledges the support of the National Research Foundation of the Republic of Korea. The reported research performed by A.M was carried out at the Jet Propulsion Laboratory, California Institute of Technology, under a contract with the National Aeronautics and Space Administration.

    APPENDIX A: DISPLACEMENT MEASUREMENT BY PDH ERROR SIGNAL ANALYSIS

    A linear part of the PDH error signal converts the resonance frequency shift to a DC voltage in the time domain. The PDH error signal is not only used for the frequency stabilization but also the high-speed tracking of the resonance frequency shift. In this study, we use the DC voltage of the PDH error signal to analyze the resonance frequency shift. First we tune the reference laser to the resonance mode of the MgF2 WGM microcavity. When near the resonance mode, we fine-tune the reference laser to be located in the center of the resonance mode. The frequency sensitivity of the PDH error signal is 1 MHz/V. The PDH error signal is then analyzed by an FFT spectrum analyzer. The power spectral density of the PDH signal (V/Hz1/2) is converted into the power spectral density of the resonance mode (Hz/Hz1/2) with frequency sensitivity of the PDH error signal of 1 MHz/V. Then the power spectral density of the resonance mode is converted into the power spectral density of displacement (m/Hz1/2) of the ultrahigh-QMgF2 WGM microcavity with relation of ΔLWGM/LWGM=ΔfWGM/fWGM. The fluctuations of the MgF2 WGM microcavity resonance frequency (ΔfWGM) are measured from the PDH error signal. We also note that this method cannot usually support long-term measurements, due to drift of the MgF2 microcavity resonance mode.

    APPENDIX B: DISPLACEMENT MEASUREMENT BY CONTROL SIGNAL ANALYSIS

    The reference laser, which provides a fixed reference point in the frequency domain, is frequency shifted by the SSB modulator to be synchronized to the microcavity resonance. The modulation frequency of about 5 GHz (fSSB) is generated by the RF synthesizer. We use the voltage-controlled frequency modulation port of the RF synthesizer to synchronize with a sensitivity of 10 MHz/V or 30 MHz/V. For evaluation of high-frequency noise from 1 Hz to 100 kHz, the control signal is analyzed by the FFT analyzer. The power spectral density of the control signal (V/Hz1/2) is converted into the power spectral density of the resonance mode (Hz/Hz1/2) with frequency sensitivity of the control signal of 10 MHz/V or 30 MHz/V. The fluctuations of the MgF2 WGM microcavity resonance frequency (ΔfWGM) are measured from the control signal. The power spectral density of the displacement (m/Hz1/2) of the MgF2 microcavity is determined in the same way as the PDH error signal based displacement measurement with the relation of ΔLWGM/LWGM=ΔfWGM/fWGM.

    APPENDIX C: THERMODYNAMICAL NOISE LIMITS OF THE CYLINDRICAL WGM RESONATOR

    The thermodynamical noise limits of the cylindrical WGM resonator are calculated by our theoretical model [40,41]. Here we consider the major thermal noise sources of the thermal-expansion noise and the thermorefractive index noise. The thermodynamical noise limits are numerically quantified by the form of the frequency noise power spectral density with units of Hz2/Hz. The cylindrical WGM resonator has the radius (r) of 1.35 mm and the rim thickness (L) of 0.025 mm. The thermal-expansion noise is derived as Sv2(f)tex=v02kBαl2T2ρCVc2r2/π2D1+(2fr2/Dπ)2,where αl is the thermal expansion coefficient and Vc is the volume of the WGM resonator. The thermorefractive index noise is evaluated as follows, assuming that rL: Sv2(f)tre=v02kBαn2T2ρCVmr212D[1+(2πr2|f|93D)32+16(πr2f4Dm1/3)2]1,where v0 is the carrier frequency, kB is the Boltzmann constant, αn is the thermorefractive coefficient of the material, ρ is the material density, C is the specific heat capacity, Vm is the mode volume, D is the heat diffusion coefficient of the material, and m is the mode order defined by m=2πrnλ1. Thus, the total thermal noise is evaluated as follows: Sv2(f)thermal=Sv2(f)tex+Sv2(f)tre.

    APPENDIX D: THERMAL MODULATION OF THE MgF2 WGM MICROCAVITY

    The MgF2 WGM microcavity temperature is modulated by a heater. The heater installed under the microcavity allows a maximum current of 10 mA. An RF synthesizer generates an input voltage with sinusoidal signal, and a voltage-controlled current source produces a current proportional to the input voltage with a gain of 1 mA/V. The heater modulates the temperature of the MgF2 WGM microcavity, resulting in the modulation of resonance frequency. We note that the modulation of the inertial microcavity temperature cannot be directly measured with the temperature sensor because the modulation depth is less than our temperature sensor resolution of 10 mK.

    References

    [1] B. P. Abbott, R. Abbott, T. D. Abbott, M. R. Abernathy, F. Acernese, K. Ackley, C. Adams, T. Adams, P. Addesso, R. X. Adhikari, V. B. Adya. Observation of gravitational waves from a binary black hole merger. Phys. Rev. Lett., 116, 061102(2016).

    [2] P. Trocha, M. Karpov, D. Ganin, M. H. P. Pfeiffer, A. Kordts, S. Wolf, J. Krockenberg, P. Marin-Palmo, C. Weimann, S. Randel, W. Freude, T. J. Kippenberg, C. Koos. Ultrafast optical ranging using microresonator soliton frequency combs. Science, 359, 887-891(2018).

    [3] S. Gigan, H. R. Böhm, M. Paternostro, F. Blaser, G. Langer, J. B. Hertzberg, K. C. Schwab, D. Bäuerle, M. Aspelmeyer, A. Zeilinger. Self-cooling of a micromirror by radiation pressure. Nature, 444, 67-70(2006).

    [4] J. Chan, T. P. Mayer Alegre, A. H. Safavi-Naeini, J. T. Hill, A. Krause, S. Groblacher, M. Aspelmeyer, O. Painter. Laser cooling of a nanomechanical oscillator into its quantum ground state. Nature, 478, 89-92(2011).

    [5] Y.-C. Liu, X. Luan, Y.-F. Xiao, C. W. Wong. Dynamic dissipative cooling of a mechanical oscillator in strong-coupling optomechanics. Phys. Rev. Lett., 110, 153606(2013).

    [6] M. Aspelmeyer, T. J. Kippenberg, F. Marquardt. Cavity optomechanics. Rev. Mod. Phys., 86, 1391-1452(2014).

    [7] J. Cripe, N. Aggarwal, R. Lanza, A. Libson, R. Singh, P. Heu, D. Follman, G. D. Cole, N. Mavalvala, T. Corbitt. Measurement of quantum back action in the audio band at room temperature. Nature, 568, 364-367(2019).

    [8] Z. Wang, J. Lee, P. X.-L. Feng. Spatial mapping of multimode Brownian motions in high-frequency silicon carbide microdisk resonators. Nat. Commun., 5, 5158(2014).

    [9] S. Groblacher, A. Trubarov, N. Prigge, G. D. Cole, M. Aspelmeter, J. Eisert. Observation of non-Markovian micromechanical Brownian motion. Nat. Commun., 6, 7606(2015).

    [10] R. Leijssen, G. R. La Gala, L. Freisem, J. T. Muhonen, E. Verhagen. Nonlinear cavity optomechanics with nanomechanical thermal fluctuations. Nat. Commun., 8, 6024(2017).

    [11] F. J. Giessibl. Advances in atomic force microscopy. Rev. Mod. Phys., 75, 949-983(2003).

    [12] H. Haitjema, P. H. J. Schellekens, S. F. C. L. Wetzels. Calibration of displacement sensors up to 300 μm with nanometre accuracy and direct traceability to a primary standard of length. Metrologia, 37, 25-33(2000).

    [13] J. Jin, Y.-J. Kim, Y. Kim, S.-W. Kim, C.-S. Kang. Absolute length calibration of gauge blocks using optical comb of a femtosecond pulse laser. Opt. Express, 14, 5968-5974(2006).

    [14] N. Bobroff. Recent advances in displacement measuring interferometry. Meas. Sci. Technol., 4, 907-926(1993).

    [15] I. Coddington, W. C. Swann, L. Nenadovic, N. R. Newbury. Rapid and precise absolute distance measurements at long range. Nat. Photonics, 3, 351-356(2009).

    [16] J. Lee, Y.-J. Kim, K. Lee, S. Lee, S.-W. Kim. Time-of-flight measurement with femtosecond light pulses. Nat. Photonics, 4, 716-720(2010).

    [17] S. A. van den Berg, S. T. Persijn, G. J. P. Kok, M. G. Zeitouny, N. Bhattacharya. Many-wavelength interferometry with thousands of lasers for absolute distance measurement. Phys. Rev. Lett., 108, 183901(2012).

    [18] Y.-S. Jang, H. Liu, J. Yang, M. Yu, D.-L. Kwong, C. W. Wong. Nanometric precision distance metrology via hybrid spectrally resolved and homodyne interferometry in a single soliton frequency microcomb. Phys. Rev. Lett., 126, 023903(2021).

    [19] Y.-S. Jang, G. Wang, S. Hyun, H. J. Kang, B. J. Chun, Y.-J. Kim, S.-W. Kim. Comb-referenced laser distance interferometer for industrial nanotechnology. Sci. Rep., 6, 31770(2016).

    [20] T. R. Schibli, K. Minoshima, Y. Bitou, F.-L. Hong, H. Inaba, A. Onae, H. Matsumoto. Displacement metrology with sub-pm resolution in air based on a fs-comb wavelength synthesizer. Opt. Express, 14, 5984-5993(2006).

    [21] R. W. P. Drever, J. L. Hall, F. V. Kowalski, J. Hough, G. M. Ford, A. J. Munley, H. Ward. Laser phase and frequency stabilization using an optical resonator. Appl. Phys. B, 31, 97-105(1983).

    [22] D. G. Matei, T. Legero, S. Häfner, C. Grebing, R. Weyrich, W. Zhang, L. Sonderhouse, J. M. Robinson, J. Ye, F. Riehle, U. Sterr. 1.5 μm lasers with sub-10 mHz linewidth. Phys. Rev. Lett., 118, 263202(2017).

    [23] M. Takamoto, F.-L. Hong, R. Higashi, H. Katori. An optical lattice clock. Nature, 435, 321-324(2005).

    [24] B. J. Bloom, T. L. Nicholson, J. R. Williams, S. L. Campbell, M. Bishof, X. Zhang, W. Zhang, S. L. Bromley, J. Ye. An optical lattice clock with accuracy and stability at the 10−18 level. Nature, 506, 71-75(2014).

    [25] H. Lee, M.-G. Suh, T. Chen, J. Li, S. A. Diddams, K. J. Vahala. Spiral resonators for on-chip laser frequency stabilization. Nat. Commun., 4, 2468(2013).

    [26] J. Lim, A. A. Savchenkov, E. Dale, W. Liang, D. Eliyahu, V. Ilchenko, A. B. Matsko, L. Maleki, C. W. Wong. Chasing the thermodynamical noise limit in whispering-gallery-mode resonators for ultrastable laser frequency stabilization. Nat. Commun., 8, 8(2017).

    [27] D. T. Spencer, T. Drake, T. C. Briles, J. Stone, L. C. Sinclair, C. Fredrick, Q. Li, D. Westly, B. R. Ilic, A. Bluestone, N. Volet, T. Komljenovic, L. Chang, S. H. Lee, D. Y. Oh, M.-G. Suh, K. Y. Yang, M. H. P. Pfeiffer, T. J. Kippenberg, E. Norberg, L. Theogarajan, K. Vahala, N. R. Newbury, K. Srinivasan, J. E. Bowers, S. A. Diddams, S. B. Papp. An optical-frequency synthesizer using integrated photonics. Nature, 557, 81-85(2018).

    [28] J. Li, X. Yi, H. Lee, S. A. Diddams, K. J. Vahala. Electro-optical frequency division and stable microwave synthesis. Science, 345, 309-313(2014).

    [29] W. Liang, D. Eliyahu, V. S. Ilchenko, A. A. Savchenkov, A. B. Matsko, D. Seidel, L. Maleki. High spectral purity Kerr frequency comb radio frequency photonic oscillator. Nat. Commun., 6, 7957(2015).

    [30] B. C. Yao, S.-W. Huang, Y. Liu, A. K. Vinod, C. Choi, M. Hoff, Y. Li, M. Yu, Z. Feng, D.-L. Kwong, Y. Huang, Y. Rao, X. Duan, C. W. Wong. Gate-tunable frequency combs in graphene-nitride microresonators. Nature, 558, 410-414(2018).

    [31] B. Stern, X. Ji, Y. Okawachi, A. L. Gaeta, M. Lipson. Battery-operated integrated frequency comb generator. Nature, 562, 401-405(2018).

    [32] Y. Li, Y. Li, S.-W. Huang, B. Li, H. Liu, J. Yang, A. K. Vinod, K. Wang, M. Yu, D.-L. Kwong, H. Wang, K. K.-Y. Wong, C. W. Wong. Real-time transition dynamics and stability of chip-scale dispersion-managed frequency microcombs. Light Sci. Appl., 9, 52(2020).

    [33] G. Gagliardi, M. Salza, S. Avino, P. Ferraro, P. De Natale. Probing the ultimate limit of fiber-optic strain sensing. Science, 330, 1081-1084(2010).

    [34] O. Arcizet, P.-F. Cohadon, T. Briant, M. Pinard, A. Heidmann, J.-M. Mackowski, C. Michel, L. Pinard, O. Francais, L. Rousseau. High-sensitivity optical monitoring of a micromechanical resonator with a quantum-limited optomechanical sensor. Phys. Rev. Lett., 97, 133601(2006).

    [35] O. Arcizet, P.-F. Cohadon, T. Briant, M. Pinard, A. Heidmann. Radiation-pressure cooling and optomechanical instability of a micromirror. Nature, 444, 71-74(2006).

    [36] G. Anetsberger, R. Riviere, A. Schliesser, O. Arcizet, T. J. Kippenberg. Ultralow-dissipation optomechanical resonators on a chip. Nat. Photonics, 2, 627-633(2008).

    [37] J. Lim, A. A. Savchenkov, A. B. Matsko, S.-W. Huang, L. Maleki, C. W. Wong. Microresonator-stabilized extended-cavity diode laser for supercavity frequency stabilization. Opt. Lett., 42, 1249-1252(2017).

    [38] J. Lim, W. Liang, A. B. Matsko, L. Maleki, C. W. Wong. Probing 10 μK stability and residual drifts in the cross-polarized dual-mode stabilization of single-crystal ultrahigh-Q optical resonators. Light Sci. Appl., 8, 1(2019).

    [39] K. Jung, J. Kim. Characterization of timing jitter spectra in free-running mode-locked lasers with 340 dB dynamic range over 10 decades of Fourier frequency. Opt. Lett., 40, 316-319(2015).

    [40] A. B. Matsko, A. A. Savchenkov, N. Yu, L. Maleki. Whispering-gallery-mode resonators as frequency references. I. Fundamental limitations. J. Opt. Soc. Am. B, 24, 1324-1335(2007).

    [41] A. A. Savchenkov, A. B. Matsko, V. S. Ilchenko, N. Yu, L. Maleki. Whispering-gallery-mode resonators as frequency references. II. Stabilization. J. Opt Soc. Am. B, 24, 2988-2997(2007).

    [42] J. Alnis, A. Matveev, N. Kolachevsky, T. Udem, T. W. Hansch. Subhertz linewidth diode lasers by stabilization to vibrationally and thermally compensated ultralow-expansion glass Fabry-Pérot cavities. Phys. Rev. A, 77, 053809(2008).

    [43] Z. Li, W. Ma, W. Yang, Y. Wang, Y. Zheng. Reduction of zero baseline drift of the Pound–Drever–Hall error signal with a wedged electro-optical crystal for squeezed state generation. Opt. Lett., 41, 3331-3334(2016).

    [44] J. R. Lawall. Fabry–Perot metrology for displacements up to 50 mm. J. Opt. Soc. Am. A, 22, 2786-2798(2005).

    [45] M. Zhu, H. Wei, X. Wu, Y. Li. Fabry–Perot interferometer with picometer resolution referenced to an optical frequency comb. Opt. Laser Eng., 67, 128-134(2015).

    [46] M. Zhu, H. Wei, S. Zhao, X. Wu, Y. Li. Subnanometer absolute displacement measurement using a frequency comb referenced dual resonance tracking Fabry–Perot interferometer. Appl. Opt., 54, 4594-4601(2015).

    [47] N. M. R. Hoque, L. Duan. Picostrain-resolution fiber-optic sensing down to sub-10 mHz infrasonic frequencies. J. Opt. Soc. Am. B, 37, 2773-2778(2020).

    Yoon-Soo Jang, Jinkang Lim, Wenting Wang, Seung-Woo Kim, Anatoliy Savchenkov, Andrey B. Matsko, Chee Wei Wong. Measurement of sub-fm/Hz1/2 displacement spectral densities in ultrahigh-Q single-crystal microcavities with hertz-level lasers[J]. Photonics Research, 2022, 10(5): 1202
    Download Citation