
Lei Zhu, Xiaopeng Shao. Research Progress on Scattering Imaging Technology[J]. Acta Optica Sinica, 2020, 40(1): 0111005
- Acta Optica Sinica
- Vol. 40, Issue 1, 0111005 (2020)
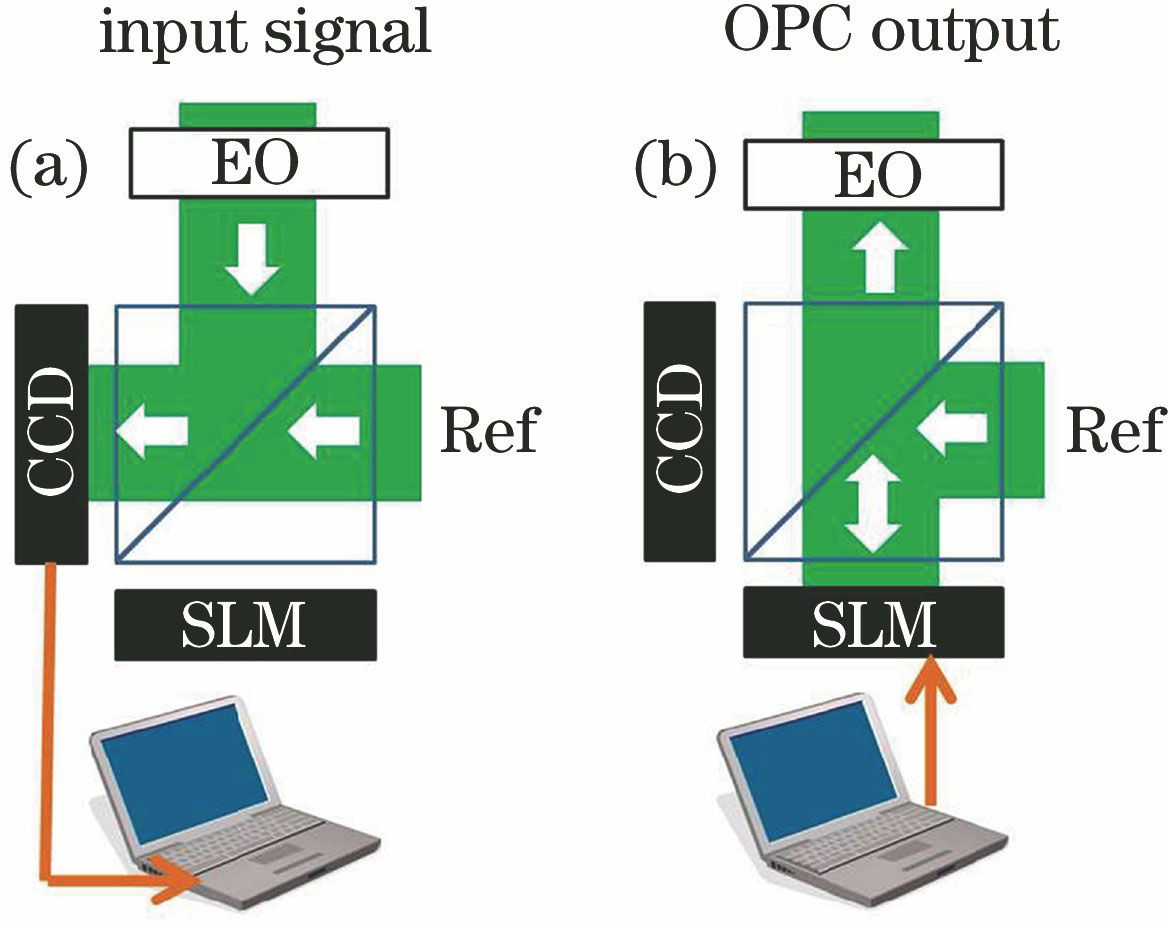
Fig. 1. Schematic of digital optical phase conjugation
![Schematics of wavefront optimization [14]. (a) Before wavefront optimization;(b) after wavefront optimization](/richHtml/gxxb/2020/40/1/0111005/img_2.jpg)
Fig. 2. Schematics of wavefront optimization [14]. (a) Before wavefront optimization;(b) after wavefront optimization
Fig. 3. Focusing results after wavefront optimization[14]. (a) Speckle before focusing; (b) focusing on single point; (c) focusing on multiple points; (d) optimized wavefront phase
Fig. 4. Schematics of focusing beyond diffraction-limit [15]. (a) Focusing optical system with conventional lens; (b) focusing optical system with random scattering media
Fig. 5. Experimental results of focusing beyond diffraction-limit[15]. (a) Focal spot of focusing optical system with conventional lens; (b) speckle of focusing optical system with random scattering media before optical modulation; (c) focal spot beyond diffraction-limit; (d) optimized wavefront phase
Fig. 6. Imaging beyond diffraction-limit using random scattering lens[39]. (a) Imaging using conventional microscope; (b) imaging beyond diffraction-limit; (c) comparison of center tangents of first spots on left of Figs. 6 (a) and (b)
Fig. 7. Experimental schematic of measuring optical transmission matrix based on four-step phase shift[18]
Fig. 8. Experimental results of focusing via phase conjugation[18]. (a) Speckle before focusing; (b) result of focusing on single point; (c) result of focusing on multiple points
Fig. 9. Experimental results of optical memory effect[21]
Fig. 10. Schematic of non-invasive imaging based on optical memory effect [22]
Fig. 11. Experimental results of scattering imaging based on optical memory effect[22]. (a) Speckle; (b) autocorrelation of speckle; (c) original object; (d) reconstructed object
Fig. 12. Schematic of single-frame imaging based on speckle autocorrelation [23]. (a) Schematic of imaging model; (b) speckle; (c) speckle autocorrelation; (d) reconstructed objects
Fig. 13. Experimental results of single-frame imaging based on speckle autocorrelation[23]. (a) Imaging setup; (b) speckle; (c)-(g) first column shows speckle autocorrelation, second column shows reconstructed objects, and third column shows original objects
Fig. 14. Reconstructed results obtained by bi-spectral analysis[62]. (a) Speckles; (b) Fourier amplitudes; (c) Fourier phases; (d) reconstructed objects; (e) original objects
Fig. 15. Experimental results of scattering imaging based on shower-curtain effect[64]. (a) Original object; (b) object is far away from thin scatter; (c) object is close to thin scatter; (d) principle of scattering imaging system based on shower-curtain effect; (e) process of object reconstruction
Fig. 16. Experimental results of scattering imaging based on deconvolution[75]. (a) Schematic of experimental setup; (b) original object; (c) speckle; (d) point spread function of imaging system; (e) reconstructed result
Fig. 17. Schematic of scattering imaging based on phase diversity[78]
Fig. 18. Experimental results of scattering imaging based on phase diversity[78]. (a) Original object; (b) speckle with diversity; (c) first column shows estimated random phases, second column shows estimated local point spread functions, and third column shows reconstructed objects

Set citation alerts for the article
Please enter your email address
© Copyright 2018-2021 | Chinese Laser Press. All Rights Reserved 沪ICP备15018463号-20