• Opto-Electronic Advances
  • Vol. 5, Issue 1, 210036 (2022)
Qianliang Li1, Walter Perrie1、*, Zhaoqing Li2, Stuart P Edwardson1, and Geoff Dearden1
Author Affiliations
  • 1Laser Engineering Group, School of Engineering, University of Liverpool, Liverpool, L69 3GQ, United Kingdom
  • 2Laser Processing Research Centre, School of Mechanical, Aerospace and Civil Engineering, University of Manchester, Manchester M13 9PL, United Kingdom
  • show less
    DOI: 10.29026/oea.2022.210036 Cite this Article
    Qianliang Li, Walter Perrie, Zhaoqing Li, Stuart P Edwardson, Geoff Dearden. Two-photon absorption and stimulated emission in poly-crystalline Zinc Selenide with femtosecond laser excitation[J]. Opto-Electronic Advances, 2022, 5(1): 210036 Copy Citation Text show less
    Schematic diagram of experimental set up for NL transmission measurements. An attenuated and de-magnified beam is directed to the ZnSe substrate where the external transmission can be measured. A λ/4 plate allows incident polarisation to be altered from linear to circular.
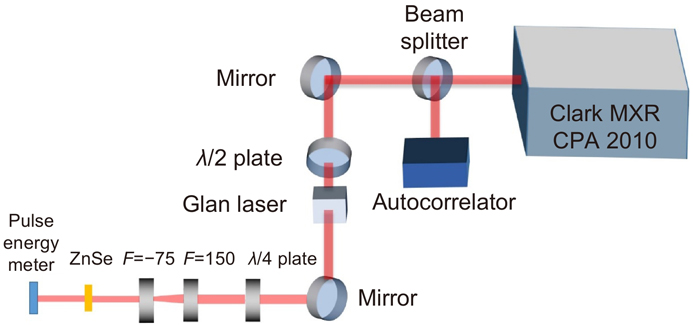
    Fig. 1. Schematic diagram of experimental set up for NL transmission measurements. An attenuated and de-magnified beam is directed to the ZnSe substrate where the external transmission can be measured. A λ/4 plate allows incident polarisation to be altered from linear to circular.
    EDX image of 0.5 mm thick polycrystalline ZnSe.
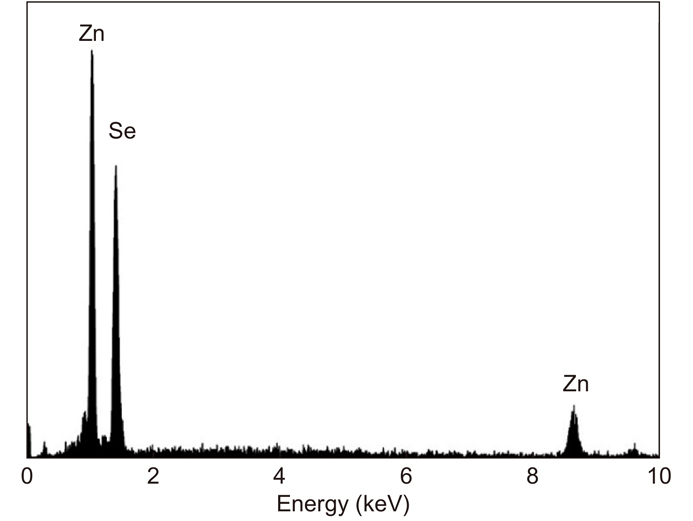
    Fig. 2. EDX image of 0.5 mm thick polycrystalline ZnSe.
    The external transmission of ZnSe measured with a spectrophotometer, showing that the cut-off λ ~ 460 nm, Eb = 2.7 eV and high transparency in the NIR.
    Fig. 3. The external transmission of ZnSe measured with a spectrophotometer, showing that the cut-off λ ~ 460 nm, Eb = 2.7 eV and high transparency in the NIR.
    (a) Transmission curves with thickness of ZnSe and intensity with nanosecond exposure. (b) Transmission with sample thickness at intensity of 0.02 GW cm–2 with 200 fs exposure at 775 nm.
    Fig. 4. (a) Transmission curves with thickness of ZnSe and intensity with nanosecond exposure. (b) Transmission with sample thickness at intensity of 0.02 GW cm–2 with 200 fs exposure at 775 nm.
    (a) Open aperture Z scan data of polycrystalline ZnSe at I0 = 24 GW cm–2 and 490 GW cm–2 with best fits to β = 0.8 cm GW–1 and β = 0.05 cm GW–1 respectively. (b) Measured effective 2-photon absorption coefficient β versus peak intensity of 0.05 cm polycrystalline ZnSe which reaches β = 1.3 cm GW–1 at intensity I0 = 13 GW cm–2, decreasing to β = 0.05 cm GW–1 at 490 GW cm–2.
    Fig. 5. (a) Open aperture Z scan data of polycrystalline ZnSe at I0 = 24 GW cm–2 and 490 GW cm–2 with best fits to β = 0.8 cm GW–1 and β = 0.05 cm GW–1 respectively. (b) Measured effective 2-photon absorption coefficient β versus peak intensity of 0.05 cm polycrystalline ZnSe which reaches β = 1.3 cm GW–1 at intensity I0 = 13 GW cm–2, decreasing to β = 0.05 cm GW–1 at 490 GW cm–2.
    (a) The transmission of 0.5, 3.8 and 10 mm polycrystalline ZnSe at τ = 200 fs pulse length as a function of the incident peak intensity. The excellent fit (red dashed line) to the data for 0.5 mm sample includes the measured variation of β from Z scans. The non-linear response is due to two-photon absorption and higher order. The solid lines represent the best fit to the data for thicker samples. (b) The transmission of 3.8 mm polycrystalline ZnSe at peak intensity below 5 GW cm–2 and fit to equation 4 with β = 3.5 cm GW–1.
    Fig. 6. (a) The transmission of 0.5, 3.8 and 10 mm polycrystalline ZnSe at τ = 200 fs pulse length as a function of the incident peak intensity. The excellent fit (red dashed line) to the data for 0.5 mm sample includes the measured variation of β from Z scans. The non-linear response is due to two-photon absorption and higher order. The solid lines represent the best fit to the data for thicker samples. (b) The transmission of 3.8 mm polycrystalline ZnSe at peak intensity below 5 GW cm–2 and fit to equation 4 with β = 3.5 cm GW–1.
    (a) Fluorescence of polycrystalline ZnSe pumped at 775 nm. (b) Illustration of the two-photon absorption and fast relaxation to the top of the conduction band followed by spontaneous emission to the valence band.
    Fig. 7. (a) Fluorescence of polycrystalline ZnSe pumped at 775 nm. (b) Illustration of the two-photon absorption and fast relaxation to the top of the conduction band followed by spontaneous emission to the valence band.
    Front and rear side fluorescence spectra of 0.5 mm thick polycrystalline ZnSe. Peak wavelengths increase with incident intensity and rear side fluorescence shows evidence of self-absorption near the band edge.
    Fig. 8. Front and rear side fluorescence spectra of 0.5 mm thick polycrystalline ZnSe. Peak wavelengths increase with incident intensity and rear side fluorescence shows evidence of self-absorption near the band edge.
    Log (fluorescence signal intensity) versus Log (incident intensity).
    Fig. 9. Log (fluorescence signal intensity) versus Log (incident intensity).
    Fluorescence penetration depth with different pulse duration. (a) pump the sample with 775 nm fs laser, (b) τac = 0.26 ps, (c) τac = 1.7 ps, (d) τac = 4.5 ps, (e) τac = 6.5 ps. Sample thickness is 3.8 mm. Fluorescence appears deeper in sample as incident intensity decreases. Peak intensities are 25 GW cm–2, 4 GW cm–2, 1.5 GW cm–2, 1 GW cm–2 respectively.
    Fig. 10. Fluorescence penetration depth with different pulse duration. (a) pump the sample with 775 nm fs laser, (b) τac = 0.26 ps, (c) τac = 1.7 ps, (d) τac = 4.5 ps, (e) τac = 6.5 ps. Sample thickness is 3.8 mm. Fluorescence appears deeper in sample as incident intensity decreases. Peak intensities are 25 GW cm–2, 4 GW cm–2, 1.5 GW cm–2, 1 GW cm–2 respectively.
    Effective NL absorption coefficient βI0 (cm–1) based on the data of Fig. 5(b)/Fig. 6(b) which drops significantly at lower intensity, increasing the coupling depth for 2-photon excitation. βI0 converges to ~ 26 cm–1 above 100 GW cm–2. These values are consistent with observed side fluorescence (Fig. 10).
    Fig. 11. Effective NL absorption coefficient βI0 (cm–1) based on the data of Fig. 5(b)/Fig. 6(b) which drops significantly at lower intensity, increasing the coupling depth for 2-photon excitation. βI0 converges to ~ 26 cm–1 above 100 GW cm–2. These values are consistent with observed side fluorescence (Fig. 10).
    (a) Fluorescence decay curve against time. (b) polarisation effect on fluorescence lifetime (λ = 775 nm, τ = 200 fs). Linear polarisation results in longer upper state lifetimes while due to stronger coupling (third order susceptibility higher with linear polarisation).
    Fig. 12. (a) Fluorescence decay curve against time. (b) polarisation effect on fluorescence lifetime (λ = 775 nm, τ = 200 fs). Linear polarisation results in longer upper state lifetimes while due to stronger coupling (third order susceptibility higher with linear polarisation).
    Fluorescence signal intensity with linear (solid lines) and circular polarisation (dash lines).
    Fig. 13. Fluorescence signal intensity with linear (solid lines) and circular polarisation (dash lines).
    Reflectance as a function of the incidence angle and polarisation of polycrystalline ZnSe showing that Brewster’s angle is near 70° as expected.
    Fig. 14. Reflectance as a function of the incidence angle and polarisation of polycrystalline ZnSe showing that Brewster’s angle is near 70° as expected.
    Schematic diagram of resonant cavity with spectral analysis. The curved mirror is Aluminium coated (R > 90 %) while the flat dielectric output coupler had reflectivity R ~ 55% at 475 nm. The arrow in the inset (plan view) shows the linear polarisation direction.
    Fig. 15. Schematic diagram of resonant cavity with spectral analysis. The curved mirror is Aluminium coated (R > 90 %) while the flat dielectric output coupler had reflectivity R ~ 55% at 475 nm. The arrow in the inset (plan view) shows the linear polarisation direction.
    Spectra of stimulated emission output spectrum from polycrystalline ZnSe within the resonant cavity (λ = 775 nm, τ = 200 fs). The solid lines and dotted line represent the spectrum within the cavity and with blocked high reflective mirror respectively.
    Fig. 16. Spectra of stimulated emission output spectrum from polycrystalline ZnSe within the resonant cavity (λ = 775 nm, τ = 200 fs). The solid lines and dotted line represent the spectrum within the cavity and with blocked high reflective mirror respectively.
    The intensity of the emission signal from the cavity versus pump intensity (τ = 200 fs).Above 80 GW cm–2, the slope increase infers gain within the cavity.
    Fig. 17. The intensity of the emission signal from the cavity versus pump intensity (τ = 200 fs).Above 80 GW cm–2, the slope increase infers gain within the cavity.
    FormThickness (mm)λ (nm) τβ (cm/GW) n2Ref
    SC0.7353230 ps12.3 ~ 14.9ref.1
    PC532ps5.5ref.13, 14
    PC2.753227 ps5.84.4 × 10–11 esu ref.15, 16
    PC5325ref.17
    PC1.5 ~ 3610125 fs2.4< 2.2 × 10⁻¹² esu ref.18
    78075 fs3.510 ×10–12 esu
    127080 fs< 0.0053.5 × 10–12 esu
    SC2500 ~710165 fs6.5 ~ 7.2(-3.5 ~ 1.5) × 10–14 cm2/W ref.19
    SC2.5700 ~ 980150 ~ 200 fs0.1 ~ 73 × 10–14 cm2/W ref.20
    PC1790200 fs2.7 ± 0.3 (2.3 ± 0.8) × 10–11 esu ref.21
    SC106030 ~ 200 psref.22
    SC11200 ~ 19501 ps(9.3 ~ 15.8) × 10–6 cm2/W ref.23
    PC23900(1.2 ± 0.3) × 10–14 cm2/W ref.24
    Table 0. Selection of literature to date on optical properties of ZnSe with laser excitation from fs to ps temporal pulse lengths.
    Peak intensity (GW cm–2) λfront (nm) λrear (nm) Δλ (nm)
    25471.4475.84.4
    62472.0478.16.1
    100473.8480.06.3
    125474.8481.16.3
    149475.7481.86.1
    Table 0. The shift of the fluorescence spectra maxima
    Qianliang Li, Walter Perrie, Zhaoqing Li, Stuart P Edwardson, Geoff Dearden. Two-photon absorption and stimulated emission in poly-crystalline Zinc Selenide with femtosecond laser excitation[J]. Opto-Electronic Advances, 2022, 5(1): 210036
    Download Citation