Qianliang Li, Walter Perrie, Zhaoqing Li, Stuart P Edwardson, Geoff Dearden. Two-photon absorption and stimulated emission in poly-crystalline Zinc Selenide with femtosecond laser excitation[J]. Opto-Electronic Advances, 2022, 5(1): 210036
Copy Citation Text
The optical nonlinearity in polycrystalline zinc selenide (ZnSe), excited with 775 nm, 1 kHz femtosecond laser pulses was investigated via the nonlinear transmission with material thickness and the Z scan technique. The measured two photon absorption coefficient β was intensity dependent, inferring that reverse saturated absorption (RSA) is also relevant during high intensity excitation in ZnSe. At low peak intensity I < 5 GW cm –2, we find β = 3.5 cm GW–1 at 775 nm. The spectral properties of the broad blueish two-photon induced fluorescence (460 nm-500 nm) was studied, displaying self-absorption near the band edge while the upper state lifetime was measured to be τe ~ 3.3 ns. Stimulated emission was observed when pumping a 0.5 mm thick polycrystalline ZnSe sample within an optical cavity, confirmed by significant line narrowing from Δλ = 11 nm (cavity blocked) to Δλ = 2.8 nm at peak wavelength λp = 475 nm while the upper state lifetime also decreased. These results suggest that with more optimum pumping conditions and crystal cooling, polycrystalline ZnSe might reach lasing threshold via two-photon pumping at λ = 775 nm.
Introduction
In recent years, significant efforts have been devoted to the wide band gap materials for next-generation optoelectronic devices1. ZnSe, is a semiconductor which has a cubic structure and a large direct bandgap of 2.7 eV (with cut-off wavelength λ = 460 nm). It has a high refractive index (RI) n ~ 2.5 in the optical region with a remarkably wide transmission band, transparent from the visible region near λ ~ 550 nm to the far infrared (FIR), λ ~ 18 µm, hence a versatile optical material for FIR laser lenses and windows2. Also, it is intensively identified as a suitable material for blue-light-emitting diodes and lasers sources. Such sources can be applied in a broad range of applications, including compact displays, optical storage in high-density DVDs and biomedical diagnostics3, 4. It is therefore interesting to study its properties such as absorption coefficient, nonlinear (NL) response and refractive index since ZnSe is promising for future applications in blue-violet electroluminescent devices.
Table Infomation Is Not Enable
The electronic energy-band structure of ZnSe was reproduced in ref.5 while the RI real and imaginary part and the absorption coefficient were published in ref.6. The investigation of the nonlinear optical properties of ZnSe is crucial since two-photon absorption imposes a fundamental limitation on the performance of all optical switching devices1. The surface and bulk absorption characteristics of ZnSe was reported at wavelengths of 2–20 µm and temperature 100–500 K7. The edge of transparency of polycrystalline ZnSe is 550 nm, and the melting temperature is 1790 K8. Table 1 summarises laser based measurements of NL properties of single crystal (SC) and polycrystalline (PC) ZnSe. Most efforts have understandably been on single crystal material with fewer defects. The changes of reflectivity, absorption coefficient, optical and dielectric constants with the photon energy (2–26 eV) for single crystal ZnSe were published in ref.9. The linear absorption coefficient of single crystal ZnSe at wavelength λ = 448 nm and 2 K was reported to be 4 cm–110. Some electrical and optical properties of single crystal ZnSe was reported in ref.5, 6, 11, 12.
Lasing in SC ZnSe has been observed using electron beam25, 26 and optical pumping27, 28. In the former, a high density of electron-hole pairs can be easily excited deep into the ZnSe of the order of several micrometers with the injected electron beam4. However, the incident energetic electron beam can rapidly degrade the crystal and will not be considered further here. On the other hand, in the latter method, the penetration depth is reduced so that the energy is located near the surface of the ZnSe29. Luminescence from single crystal ZnSe excited by picosecond (5 ps) mid-infrared free-electron laser pulses (9.5–11.0 µm) was reported30 and stimulated emission from single crystal ZnSe below 200 K, induced by either one-photon or two-photon excitation has been observed31. The lasing mechanism includes an electron-hole plasma modified by self-absorption32, 33, longitudinal-optical-phonons assisting the free exciton annihilation31, an inelastic exciton-exciton scattering process31, 34, a combination of exciton-exciton and exciton-photon processes35 or many particles interactions36.
The research to date in the literature has concentrated on the linear and NL optical properties of single crystal ZnSe which is an expensive substrate and needs to be grown to specification. On the other hand, polycrystalline ZnSe substrates of required thickness and sizes are relatively easy to obtain commercially - and such material is still very pure. The availability of optically polished, polycrystalline substrates has driven the current interest in NL studies and the observation of stimulated emission in polycrystalline material reported here infers pure material with low defect density.
Experimental setup
As shown in Fig. 1, the pump source is a Clark-MXR femtosecond laser system operating at 775 nm with 200 fs pulse length, with an average power of 1 W at 1 kHz repetition rate. The laser beam is attenuated, de-magnified (× 1/2) by a telescope and collimated transmitted pulse energy measured by a pyroelectric detector (Molectron 3Sigma J5-09). A quarter-wave plate allowed variation of the incident laser polarisation. The undoped polycrystalline ZnSe was supplied by Crystran Ltd. All experiments were carried out at room temperature (18 °C), and the samples were cleaned and wiped with methanol prior to laser exposure. The pristine surface roughness was measured to be Ra = 9.6 ± 1.2 nm, checked using a white light interferometer (WYKO NT1100).
Figure 1.Schematic diagram of experimental set up for NL transmission measurements. An attenuated and de-magnified beam is directed to the ZnSe substrate where the external transmission can be measured. A λ/4 plate allows incident polarisation to be altered from linear to circular.
Polycrystalline Zinc Selenide supplied by Crystran Ltd is fabricated by the conventional chemical vapor deposition (CVD). It is synthesised from Zinc vapour and H2Se gas, forming as sheets on Graphite susceptors. The resultant material is ultrapure with grain size of ZnSe controlled to obtain maximum strength and stated to be <100 μm. The crystals have the zinc blende structure or face centred cubic (FCC).
Polycrystalline ZnSe should have a very low Oxygen content due to processing route. The elemental composition of the ZnSe sample was determined with Energy Dispersive X-ray (EDX) analysis using scanning electron microscope (ZEISS Sigma). The zinc and selenide contents are 62.9% and 37.1% respectively and no trace of element O could be found Fig. 2. This is consistent with the high purity, quoted as 99.999%.
Figure 2.EDX image of 0.5 mm thick polycrystalline ZnSe.
The external optical transmission characteristics of 0.5 mm thick polycrystalline ZnSe was recorded using a spectrophotometer (SPECORD 250) in the wavelength range of 200 to 1100 nm in air at normal incidence. The variation of transmission with wavelength is shown in Fig. 3. The strong absorption around the cut off λ = 460 nm indicates the bandgap Eb ~ 2.7 eV. The general appearance of this spectrum corresponds to the yellow colour of the sample observed under white light23. Between 470 and 530 nm, the transmission increases rapidly while above 700 nm, where dispersion is almost negligible, the external transmission approaches T ~ 70% at 1100 nm, limited only by the reflection losses due to the high refractive index. Linear absorption in the NIR is therefore very low indeed.
Figure 3.The external transmission of ZnSe measured with a spectrophotometer, showing that the cut-off λ ~ 460 nm, Eb = 2.7 eV and high transparency in the NIR.
Linear absorption under low intensity laser exposure
Figure 4(a) shows the transmission curves with thickness and intensity under nanosecond laser exposure (λ = 775 nm, τp =150 ns) when the Regenerative amplifier was unseeded. The results infer a very low linear absorption coefficient α0. The external transmission is given by the Beer-lambert law37,
where α0 is the linear absorption coefficient (cm−1), z is the material thickness (cm), and R is the surface reflectivity of ZnSe in air. As refractive index n = 2.53 at 780 nm, R = (n-1)2/(n+1)2 = 0.19, hence, the loss by reflection is taken into account by the fraction (1–R)2 = 0.66. The observed transmission in Fig. 4(a) with varying thickness is consistent with an extremely weak linear absorption coefficient α0 0.1 cm–1.
The transmitted intensity changes as a function of the sample thickness with incident intensity I0 = 0.02 GW cm–2 at 200 fs, as is shown in Fig. 4(b). No change in external transmission with sample thickness can be detected within experimental error.
Figure 4.(a) Transmission curves with thickness of ZnSe and intensity with nanosecond exposure. (b) Transmission with sample thickness at intensity of 0.02 GW cm–2 with 200 fs exposure at 775 nm.
Open aperture Z scan15 was performed to investigate the two-photon absorption coefficient of polycrystalline ZnSe. Prior to the Z scan process, the optical alignment was carefully adjusted to ensure that the beam propagated horizontally along the desired optic axis at a fixed height. The pulse width τ = 200 fs (FWHM) was determined via the autocorrelator assuming a sech2 response. The Rayleigh range was determined by measuring the variation of beam spot size at different positions along the optic axis. The pulse width and energy were monitored during the scanning process. The incident pulse energy and transmitted pulse energy were measured using a calibrated pyroelectric detector (Molectron J5-09), which is able to measure every pulse at 1 kHz, producing the average energy and standard deviation. Peak intensities were then calculated from beam profiles and temporal pulse length. The sample was translated through the focal plane of a lens with focal length f = 250 mm while measuring transmitted pulse energy with the pyro-electric detector. Figure 5(a) shows the typical scans observed with peak incident intensities I = 24 GW cm–2 and 490 GW cm–2 respectively. The solid lines represent the best fit to Eq. (2)15,
Figure 5.(a) Open aperture Z scan data of polycrystalline ZnSe at I0 = 24 GW cm–2 and 490 GW cm–2 with best fits to β = 0.8 cm GW–1 and β = 0.05 cm GW–1 respectively. (b) Measured effective 2-photon absorption coefficient β versus peak intensity of 0.05 cm polycrystalline ZnSe which reaches β = 1.3 cm GW–1 at intensity I0 = 13 GW cm–2, decreasing to β = 0.05 cm GW–1 at 490 GW cm–2.
where the free factor q0 = βI0Leff, β (cm GW–1) is the two-photon absorption coefficient, I0 (GW cm–2) is the peak intensity at the beam focus (Z = 0), the effective optical thickness Leff = (1–e–αL)/α, L = 5 × 10⁻² cm is the sample thickness, α (cm–1) is the linear absorption coefficient, and Z0 is the Rayleigh range of the beam. A series expansion of Leff ~ L – (αL2)/2 = 4.8 × 10⁻² cm (assuming α ~ 0.1 cm–1), converging to L as α → 0. With the 250 mm focal length lens, the beam Rayleigh length was measured to be Z0 = 10.5 mm so that LeffZ0, required for this technique.
Figure 5(b) shows the measured two-photon absorption coefficient β which is intensity dependent, which reaches β = 1.3 cm GW–1 at intensity I = 13 GW cm–2, decreasing to β ~ 0.05 cm GW–1 at 490 GW cm–2. Since β decreases with peak intensity, these results infer that reverse saturation absorption is also relevant during high intensity excitation38. The Z scan fits support NL two-photon absorption to the conduction band but there may be a contribution from higher order processes, e.g. three-photon absorption but more likely two-photon plus single photon excited state (free carrier) absorption (χ(3) : χ(1)). Hence, the absorption of a third (sequential) photon from 3.2 eV to higher in the conduction band is relevant. The increase in β below I = 24 GW cm–2 is consistent with that measured by Tseng et al21 who found β = 2.7 cm GW–1 at intensity I = 0.95 GW cm–2 and λ = 790 nm. However, extrapolation of our data to I = 0.95 GW cm–2 is likely unreliable and so requires data in this low intensity region, included below. The reflectivity and transmission are consistent with the values described in ref.39. The single pulse ablation threshold of SC ZnSe was reported to be Fth = 0.7 J cm–2 with 150 fs / 800 nm40, and multi-pulse ablation threshold will be lower due to incubation. Our maximum fluence was estimated to be Fmax = 0.1 J cm–2 at I = 490 GW cm–2 to avoid ablation of ZnSe since Selenium is highly toxic.
The photon energy at 775 nm, hν = 1.6 eV is much lower than the direct band gap energy Eb =2.7 eV while 2hν > Eb, 0.5 eV above the two photon resonance of ZnSe21. It requires simultaneous absorption of two photons at 775 nm to reach the conduction band. Pure two-photon absorption is described by,
where β is the two-photon absorption coefficient (cm GW–1). By integrating equation (3), the transmission T is simply given by,
The experimentally measured non-linear transmission versus peak intensity I ≥ 13 GW cm–2 was performed on 0.5, 3.8 and 10 mm thick polycrystalline ZnSe substrates and results are shown in Fig. 6(a). The dashed line for the 0.5 mm represents the fit which includes the measured variation of β from the Z scan of this sample, showing excellent agreement.
Figure 6.(a) The transmission of 0.5, 3.8 and 10 mm polycrystalline ZnSe at τ = 200 fs pulse length as a function of the incident peak intensity. The excellent fit (red dashed line) to the data for 0.5 mm sample includes the measured variation of β from Z scans. The non-linear response is due to two-photon absorption and higher order. The solid lines represent the best fit to the data for thicker samples. (b) The transmission of 3.8 mm polycrystalline ZnSe at peak intensity below 5 GW cm–2 and fit to equation 4 with β = 3.5 cm GW–1.
To compare β near I = 1 GW cm–221, we have measured NL transmission in the 3.8 mm thick sample with a collimated, 2.5 mm diameter beam. Results are shown in Fig. 6(b) with best fit to Eq. (4), yielding β = 3.5 ± 0.5 cm GW–1 – this value is in excellent agreement with Krauss and Wise's18 and close to that of Tseng et al21. Both used PC ZnSe.
β is wavelength dependent and sensitive to the ratio (hν/Eb) where Eb = 2.7 eV is the band gap. Hence two photon absorption can occur only when hν/Eb ≥ 0.5, with maximum near (hν/Eb) = 0.741. At 775 nm, hν/Eb = 0.59 while for 532 nm, hν/Eb = 0.86 and thus expect β (532) > β (775), supported by the data in Table 141.
In the visible at 532 nm, β measured from NL transmission in PC ZnSe yield consistent results with < β> ~ 5.5 ± 0.3 cm GW–213, 14 and 5.8 ± 1.2 cm GW–215-17respectively. In SC ZnSe plates with faces cut parallel to the [111] crystallographic plane, 12.3 < β < 14.9 cm GW –1 at 530 nm is hence much higher1.
In the NIR, in PC ZnSe18 at λ = 780 nm, (75 fs), β = 3.5 cm GW–1 while in ref.21 at λ= 790 nm, (200 fs), β = 2.7 ± 0.3 cm GW–1, whereas in SC ZnSe at λ = 710 nm19, β ~ 6.9 cm GW–1 and extrapolated to 775 nm, we estimate β ~ 6.5 cm GW–1 so significantly higher than in PC material. In ref.20, also in SC ZnSe, the dispersion of β was measured in detail over wavelength range 780–900 nm, where, near 775 nm, β = 5.1 ± 0.6 cm GW–1 in agreement with particular theoretical models. Thus, the two-photon absorption coefficient in SC ZnSe at low intensities appears to be approximately 1.7 times that in PC ZnSe.
Fluorescence spectra characteristics
Figure 7(a) shows the image of the fluorescence observed from 0.5 mm thick polycrystalline excited at λ = 775 nm, τ = 200 fs, easily excited at ultrahigh intensity. Figure 7(b) shows a schematic diagram of the electronic excitation scheme in ZnSe so that simultaneous absorption of two photons excites electrons to the conduction band, followed by fast non-radiative relaxation (ps timescale21) to the lowest vibrational level, 0.5 eV below. The excited states then decay to ground state, via fluorescence, reaching thermal equilibrium. In addition, further sequential single photon during the fs pulse length from 3.2 eV in the conduction band is relevant.
Figure 7.(a) Fluorescence of polycrystalline ZnSe pumped at 775 nm. (b) Illustration of the two-photon absorption and fast relaxation to the top of the conduction band followed by spontaneous emission to the valence band.
To measure the fluorescence emission spectra and decay kinetics, the spectra were collected by a spectrograph (Andor SR-303i, spectral resolution 0.1 nm) equipped with an intensified charge coupled device (Andor ICCD-DH 734). This fast gating intensified CCD camera can achieve time resolution down to 2 ns.
Intensity dependence of the signal
Figure 8 shows the experimental setup for measuring front (a) and rear (b) side fluorescence. The fluorescence was collected by an f = 50 mm lens and focused to a 0.2 NA fibre coupler, relaying fluorescence to the input slit of the Andor spectrometer. A UQG BG39 filter was used to block remaining NIR beam. Figure 8(c) shows the typical fluorescence spectra of polycrystalline ZnSe with increasing excitation intensities. The peak position of the front side fluorescence is in the range of 472 nm–475 nm, moving to longer wavelengths with increasing intensity and all have a reasonably symmetric profile. On the other hand, the rear side spectra are all red shifted (about 6 nm) and are asymmetric due to self-absorption in the material near the band gap edge. The peak wavelengths also can be seen to increase with intensity. Since linear absorption is negligible, we attributed the wavelength shifts with intensity to a thermal accumulation effect (slow) between pulses at 1 kHz and (fast) acoustic density changes42. A red shift of a ZnSe with pump intensity was also reported in ref.3. The carrier densities increase with excitation intensities and more free carriers make the band filling effect possible. As a result, more energy will be lost in this scattering process, leading to the occurrence of the shift to longer wavelength.
Figure 8.Front and rear side fluorescence spectra of 0.5 mm thick polycrystalline ZnSe. Peak wavelengths increase with incident intensity and rear side fluorescence shows evidence of self-absorption near the band edge.
The shift of the fluorescence spectra with incident intensity is listed in Table 2, based on the experimental data from Fig. 8. In Table 2, each peak position wavelength of the rear side is longer than the corresponding front side due to self-absorption near the band edge. The difference (Δλ = λrear– λfront) increases with the incident intensity but saturates above I = 100 GW cm–2.
Table Infomation Is Not Enable
To determine the degree of non-linearity, Fig. 9 shows the log (fluorescence signal intensity) versus log (incident intensity) measured when altering incident temporal pulse length from the Regen amplifier. The slopes are almost identical with NL exponent m = 2.7 confirming that two photon absorption and higher order processes such as sequential photon absorption in the conduction band (RSA) are involved in the excitation process.
Figure 9.Log (fluorescence signal intensity) versus Log (incident intensity).
Figure 10 shows optical images of fluorescence observed when a 3.8 mm thick ZnSe window was pumped on the front surface with a collimated beam at 775 nm (φ = 2.5 mm) with different temporal pulse lengths. Autocorrelation widths are quoted. As peak intensities decrease at longer pulse length, the fluorescence reduces in intensity and penetrates deeper within the material.
Figure 10.Fluorescence penetration depth with different pulse duration. (a) pump the sample with 775 nm fs laser, (b) τac = 0.26 ps, (c) τac = 1.7 ps, (d) τac = 4.5 ps, (e) τac = 6.5 ps. Sample thickness is 3.8 mm. Fluorescence appears deeper in sample as incident intensity decreases. Peak intensities are 25 GW cm–2, 4 GW cm–2, 1.5 GW cm–2, 1 GW cm–2 respectively.
Figure 11 shows the effective NL absorption coefficient βI0 (cm–1) based on the data of Fig. 5(b) which drops significantly at lower intensity and converges to βI0 ~ 26 cm–1 above 100 GW cm–2. At intensity I0 = 25 GW cm–2, βI0 ~ 20 cm–1 and the coupling depth d = 1/βI0 ~ 0.05 cm = 0.5 mm. The low intensity data (Fig. 6(b)) has also been added. Using β =3.5 cm GW–1 at low intensity, (I0 = 4, 1.5, 1 GW cm–2), βI0 = 14 cm–1, 5.3 cm–1 and 3.5 cm–1 respectively. As the two-photon fluorescence intensity should scale as (I(z)/I0)2 = [1/(1 + βI0z)]2 then at the centre of the 3.8 mm sample, (z = 1.9) the fluorescence intensity, relative to that at the input face should reduce by factors of 0.1, 0.25 and 0.36 respectively. These factors look to be in approximate agreement with the relative intensities observed in Fig. 10(c–e).
Figure 11.Effective NL absorption coefficient βI0 (cm–1) based on the data of Fig. 5(b)/Fig. 6(b) which drops significantly at lower intensity, increasing the coupling depth for 2-photon excitation. βI0 converges to ~ 26 cm–1 above 100 GW cm–2. These values are consistent with observed side fluorescence (Fig. 10).
Fluorescence lifetime is the characteristic time an excited electron spends in the conduction band before emitting a photon and returning to the ground state, here the valence band. This was measured using the fast gate on the ICCD (2 ns gate width, gate delay = 1 ns) which was synchronised to the laser pulse from the Pockels cell driver. Figure 12(a) shows the time resolved fluorescence where the decay time (1/e) was found to be τ1/e = 3.3 ± 0.1 ns with linear polarisation at 10 GW cm–2. The fluorescence lifetime decays with increasing pump intensity, which indicates ion-ion energy exchange effects taking placing43.
Figure 12.(a) Fluorescence decay curve against time. (b) polarisation effect on fluorescence lifetime (λ = 775 nm, τ = 200 fs). Linear polarisation results in longer upper state lifetimes while due to stronger coupling (third order susceptibility higher with linear polarisation).
Figure 12(b) shows the effect of incident polarisation on the fluorescence lifetime with intensity and linear polarisation has slightly higher lifetimes than that of circular polarisation likely due to stronger coupling (higher third order susceptibility ξ(3) with linear polarisation)44. When the incident intensity is above 30 GW cm–2, the fluorescence lifetime is almost constant. This phenomenon was also observed in biological cofactors45 while angular momenta of the absorbed photons and photo selection rules may be involved in the linear and circular polarisation excitation46.
Third order susceptibility, which is polarisation dependent, is given by , where the real part is relevant to the nonlinear refractive index change n2 and the imaginary part describes the two-photon absorption coefficient β. The nonlinear refraction coefficient of circular and linear polarised light is given by and respectively, where ε0 represents the permittivity in the vacuum, c, the speed of the light47. Therefore, the ratio of . In the case of β, proportional to , coupling is stronger with linear polarisation as the tensor χ(3) has two components for linear polarisation and only one component for circular polarisation20, 41.
The transmission through ZnSe with incident peak intensity was measured at linear and circular polarisation, with slightly higher transmission of circular polarisation. However, the intensity of the fluorescence signal with linear polarisation was more obvious, which is approximately × 1.1–1.2 times higher than that of circular polarisation (Fig. 13).
Figure 13.Fluorescence signal intensity with linear (solid lines) and circular polarisation (dash lines).
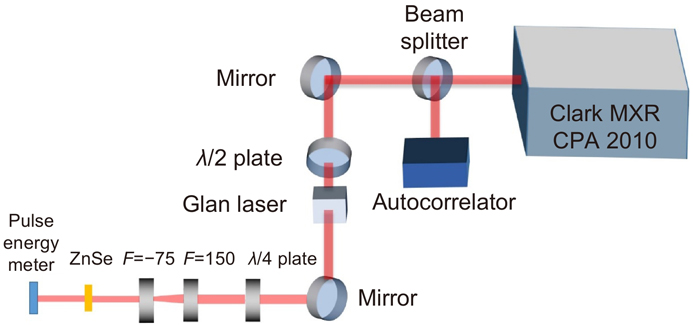
Stimulated emission and two-photon pumped blue lasing in single crystal ZnSe was previously reported in short cavities using the crystal end facets as feedback elements3, 35. To investigate stimulated emission in polycrystalline ZnSe we placed a 0.5 mm ZnSe substrate inside a resonant cavity with the crystal tilted near Brewster’s angle to minimise reflections losses. Brewster’s angle was first checked by mounting the ZnSe on a precision rotation stage, and the reflectance measured when rotating the ZnSe. The P (horizontal) and S (vertical) polarisation were controlled by rotating a λ/2 plate ahead of the crystal. The measured Brewster’s angle of ZnSe at 775 nm was 70° (Fig. 14), as expected from theory, θB = tan–1n = tan–1 2.53 = 68.4°.
Figure 14.Reflectance as a function of the incidence angle and polarisation of polycrystalline ZnSe showing that Brewster’s angle is near 70° as expected.
Figure 15 shows the experimental setup of the optical cavity and detection set-up. The sample optically polished on one edge and pumped near 20° from normal, forming a gain region across the edge. The cavity was formed by a curved high reflector (spherical Al mirror, radius r =200 mm, R > 90%, 400–700 nm) and plane dielectric output coupler (O/C) with reflectivity ROC ~ 55% at 475 nm. This O/C also allowed alignment of the cavity by using a green HeNe laser at 543 nm. The cavity emission was collected with a 50 mm focal length lens and fiber coupler to the spectrometer. A UQG BG39 cut off filter was used to remove any remaining 775 nm scatter. The stability of the laser cavity was modelled by WinLase 2.1 Pro with stability parameter 1.0 at d2 = 55 mm, dropping only to 0.99 at d2 = 45 mm / 55 mm, which is highly stable. The short cavity length allows up to 3 ~ 4 round trips for gain based on the stimulated fluorescence lifetime of 3.3 ns at the high intensity (Fig. 12(b)). The pumping with linear polarisation has longer lifetime, allowing more cavity round trips.
Figure 15.Schematic diagram of resonant cavity with spectral analysis. The curved mirror is Aluminium coated (R > 90 %) while the flat dielectric output coupler had reflectivity R ~ 55% at 475 nm. The arrow in the inset (plan view) shows the linear polarisation direction.
Figure 16 shows the observed output emission spectra with pump intensity within the 10 cm resonator under two-photon excitation at 775 nm / 1 kHz. As pulse intensity increases, the amplified spectrum width decreases while emission intensity grows significantly. At pump intensity I = 148 GW cm–2, the peak wavelength λ = 475 nm with Δ λFWHM ~ 2.8 nm. Spectral narrowing is a strong indication of stimulated emission in polycrystalline ZnSe. The dotted line represents the spectrum observed when the Aluminium mirror was blocked, with ΔλFWHM = 11 nm.
Figure 16.Spectra of stimulated emission output spectrum from polycrystalline ZnSe within the resonant cavity (λ = 775 nm, τ = 200 fs). The solid lines and dotted line represent the spectrum within the cavity and with blocked high reflective mirror respectively.
The intensity of the emission spectra from the cavity with pump intensity is shown in Fig. 17. The intensity increases significantly above I = 80 GW cm–2 with the slope changing from S = 2.4 to S = 6.1. This intensity characteristic along with the spectral narrowing are a strong indication of stimulated emission, similar to the results contained in ZnO nanorods where a superlinear stimulated fluorescence signal was observed48.
Figure 17.The intensity of the emission signal from the cavity versus pump intensity (τ = 200 fs).Above 80 GW cm–2, the slope increase infers gain within the cavity.
Linear and nonlinear optical properties of polycrystalline ZnSe have been studied in detail when excited at 775 nm / 1 kHz and at ultrahigh intensity. As ZnSe is transparent at 775 nm, absorption occurs primarily by nonlinear two-photon absorption. The two-photon absorption coefficient β was found to be intensity dependent, implying that RSA (involving sequential photon absorption) is also a relevant nonlinear process. β was measured to be 1.3 cm GW–1 at intensity I = 13 GW cm–2, decreasing to β = 0.05 cm GW–1 at 490 GW cm–2. In the low intensity regime with I < 5 GWcm –2, we measured β = 3.5± 0.5 cm GW–1 in excellent agreement with the data from Krauss and Wise18 and in good agreement with that of Tseng et al21. The transmission through substrates with varying thickness was modelled analytically and in excellent agreement with experimental data observed from a 0.5 mm thick sample, allowing for varying β.
In polycrystalline ZnSe the grain size is quoted to be < 100 µm from the supplier. The crystals, which are isotropic are randomly oriented and can allow quasi-phase matching in difference frequency generation (DFG) when the coherence length Λ in the polycrystalline ZnSe is similar to the size of the grains49. Nonlinear conversion to second harmonic-generation (SHG) and sum-frequency generation (SFG) in polycrystalline ZnSe has also been demonstrated where the SF signals appeared in bright spots around the SHG due to phase matching in grains with particular orientations50. In the case of two-photon absorption, as there is no such phase matching requirement in this isotropic material, one might assume that in polycrystalline ZnSe, the random grain orientations may average out, yielding the same β as single crystalline ZnSe. However, the nonlinear optical response in single crystal ZnSe is not isotropic and so χ(3) depends on the relative orientation of the light polarisation to the crystal axis20 which may average over oriented grains to a different value. By comparing the measured β’s near 775 nm in both single crystal and polycrystalline ZnSe18-21 we find that the β(SC) ~1.7 β(PC).
Broad blue fluorescence from polycrystalline ZnSe was observed with an upper state lifetime ~ 3.5 ns, and comparison of fluorescence spectra from both front and rear surfaces displayed peak shifts of ~ 6 nm, intensity dependent with a nonlinear gradient m = 2.7 so that two-photon plus excited state absorption via RSA (sequential or free carrier photon absorption) is likely involved in NL excitation. By integrating the 0.5 mm polycrystalline sample into a stable resonant cavity with length 10 cm, stimulated emission was observed, confirmed by significant spectral narrowing from Δλ = 11 nm (cavity blocked) to Δλ = 2.8 nm. Although a lasing threshold was not observed, results suggest that a higher reflectivity output coupler, combined with crystal cooling, may allow laser output. The presented results confirm that available polycrystalline ZnSe substrates have sufficient purity and low defect density to warrant further investigation.
References
[11] Palik ED. Handbook of Optical Constants of Solids Vol. 2. (Academic Press, Boston, 1991).
[22] Van Stryland EW, Woodall MA, Williams WE, Soileau MJ. Two-and three-photon absorption in semiconductors with subsequent absorption by photogenerated carriers. In Bennett H, Guenther A, Milam D, Newnam B. Laser Induced Damage in Optical Materials 589–600 (ASTM International, West Conshohocken, PA, 1983); https://doi.org/10.1520/STP37286S.
[41] Boyd RW. Nonlinear Optics 3rd ed (Academic Press, San Diego, 2008).
Qianliang Li, Walter Perrie, Zhaoqing Li, Stuart P Edwardson, Geoff Dearden. Two-photon absorption and stimulated emission in poly-crystalline Zinc Selenide with femtosecond laser excitation[J]. Opto-Electronic Advances, 2022, 5(1): 210036