• Photonics Research
  • Vol. 9, Issue 5, 829 (2021)
Ping Gu1, Jing Chen1、*, Siyu Chen1, Chun Yang1, Zuxing Zhang1, Wei Du2、3, Zhengdong Yan4, Chaojun Tang5、6, and Zhuo Chen2、7
Author Affiliations
  • 1College of Electronic and Optical Engineering & College of Microelectronics, Institute of Advanced Photonics Technology, Nanjing University of Posts and Telecommunications, Nanjing 210023, China
  • 2College of Physics, National Laboratory of Solid State Microstructures, and Collaborative Innovation Center of Advanced Microstructures, Nanjing University, Nanjing 210093, China
  • 3College of Physics Science and Technology, Yangzhou University, Yangzhou 225002, China
  • 4College of Science, Nanjing Forestry University, Nanjing 210037, China
  • 5College of Science, Zhejiang University of Technology, Hangzhou 310023, China
  • 6e-mail: chaojuntang@126.com
  • 7e-mail: zchen@nju.edu.cn
  • show less
    DOI: 10.1364/PRJ.417648 Cite this Article Set citation alerts
    Ping Gu, Jing Chen, Siyu Chen, Chun Yang, Zuxing Zhang, Wei Du, Zhengdong Yan, Chaojun Tang, Zhuo Chen. Ultralarge Rabi splitting and broadband strong coupling in a spherical hyperbolic metamaterial cavity[J]. Photonics Research, 2021, 9(5): 829 Copy Citation Text show less
    (a) Schematic of a spherical HMM cavity composed of a dielectric nanosphere core (radius rcore; refractive index ncore) and seven alternating layers of silver (thickness: s1, s2, s3, and s4) and dielectric layers (thickness d1, d2, d3, and d4; refractive index nd1, nd2, nd3, and nd4). (b) Calculated decomposed absorption efficiency spectrum for the first two electric terms (a1, a2) and the first magnetic term (b1) of the Mie expansion for an HMM cavity with the parameters rcore=50 nm, ncore=2.0, s1=s2=s3=s4=15 nm, d1=d2=d3=20 nm, and nd1=nd2=nd3=nd4=1.4. The b1 term is enlarged 50 times for clarity. (c)–(h) The electric field intensity distributions of WGM1,1 (0.602 eV), WGM1,2 (0.873 eV), WGM1,3 (1.305 eV), TM1,1 (2.827 eV), WGM2,1 (1.021 eV), and TM2,1 (3.217 eV), respectively. Dashed circle lines show the silver/dielectric interfaces of the HMM cavity.
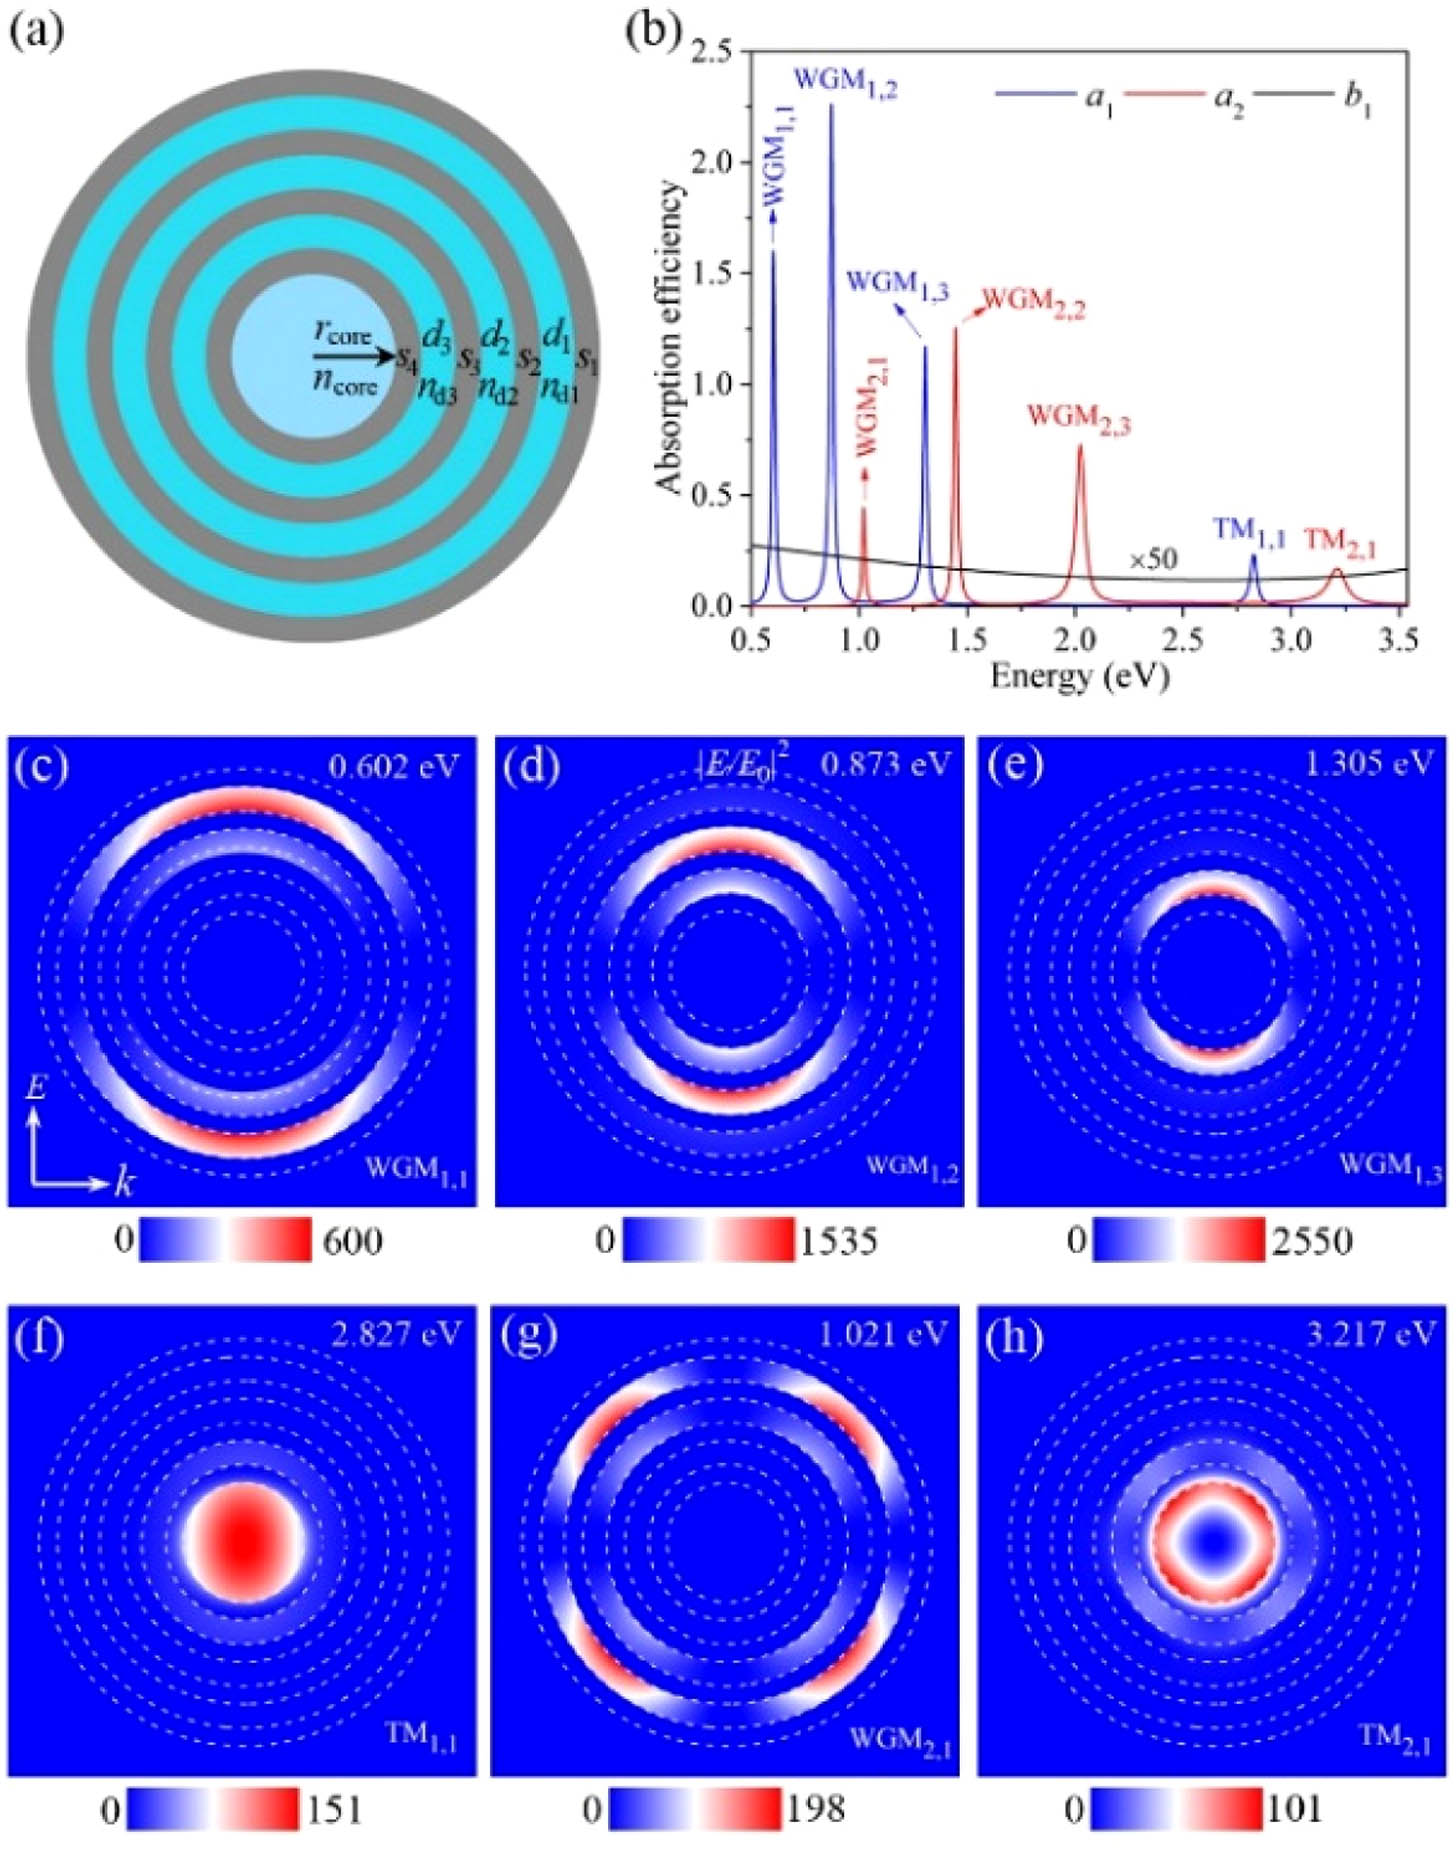
    Fig. 1. (a) Schematic of a spherical HMM cavity composed of a dielectric nanosphere core (radius rcore; refractive index ncore) and seven alternating layers of silver (thickness: s1, s2, s3, and s4) and dielectric layers (thickness d1, d2, d3, and d4; refractive index nd1, nd2, nd3, and nd4). (b) Calculated decomposed absorption efficiency spectrum for the first two electric terms (a1, a2) and the first magnetic term (b1) of the Mie expansion for an HMM cavity with the parameters rcore=50  nm, ncore=2.0, s1=s2=s3=s4=15  nm, d1=d2=d3=20  nm, and nd1=nd2=nd3=nd4=1.4. The b1 term is enlarged 50 times for clarity. (c)–(h) The electric field intensity distributions of WGM1,1 (0.602 eV), WGM1,2 (0.873 eV), WGM1,3 (1.305 eV), TM1,1 (2.827 eV), WGM2,1 (1.021 eV), and TM2,1 (3.217 eV), respectively. Dashed circle lines show the silver/dielectric interfaces of the HMM cavity.
    (a) Absorption efficiency spectra (a1) of a spherical HMM cavity (rcore=50 nm, s=15 nm, d=20 nm, and nd=1.4) as a function of the dielectric core index (ncore). The two red lines with circles present the dispersions of two hybrid modes predicted by the CTM fitting. The dashed white horizontal and oblique lines represent the resonant energy (left y axis) and wavelength (right y axis) of the uncoupled WGM1,3 and TM1,1 mode, respectively. (b) The absorption efficiency spectrum of the spherical HMM cavity with a dielectric core index of ncore=4.3 (ETM1,1=EWGM1,3). The blue lines are the Fano fitting results for the calculated absorption peaks.
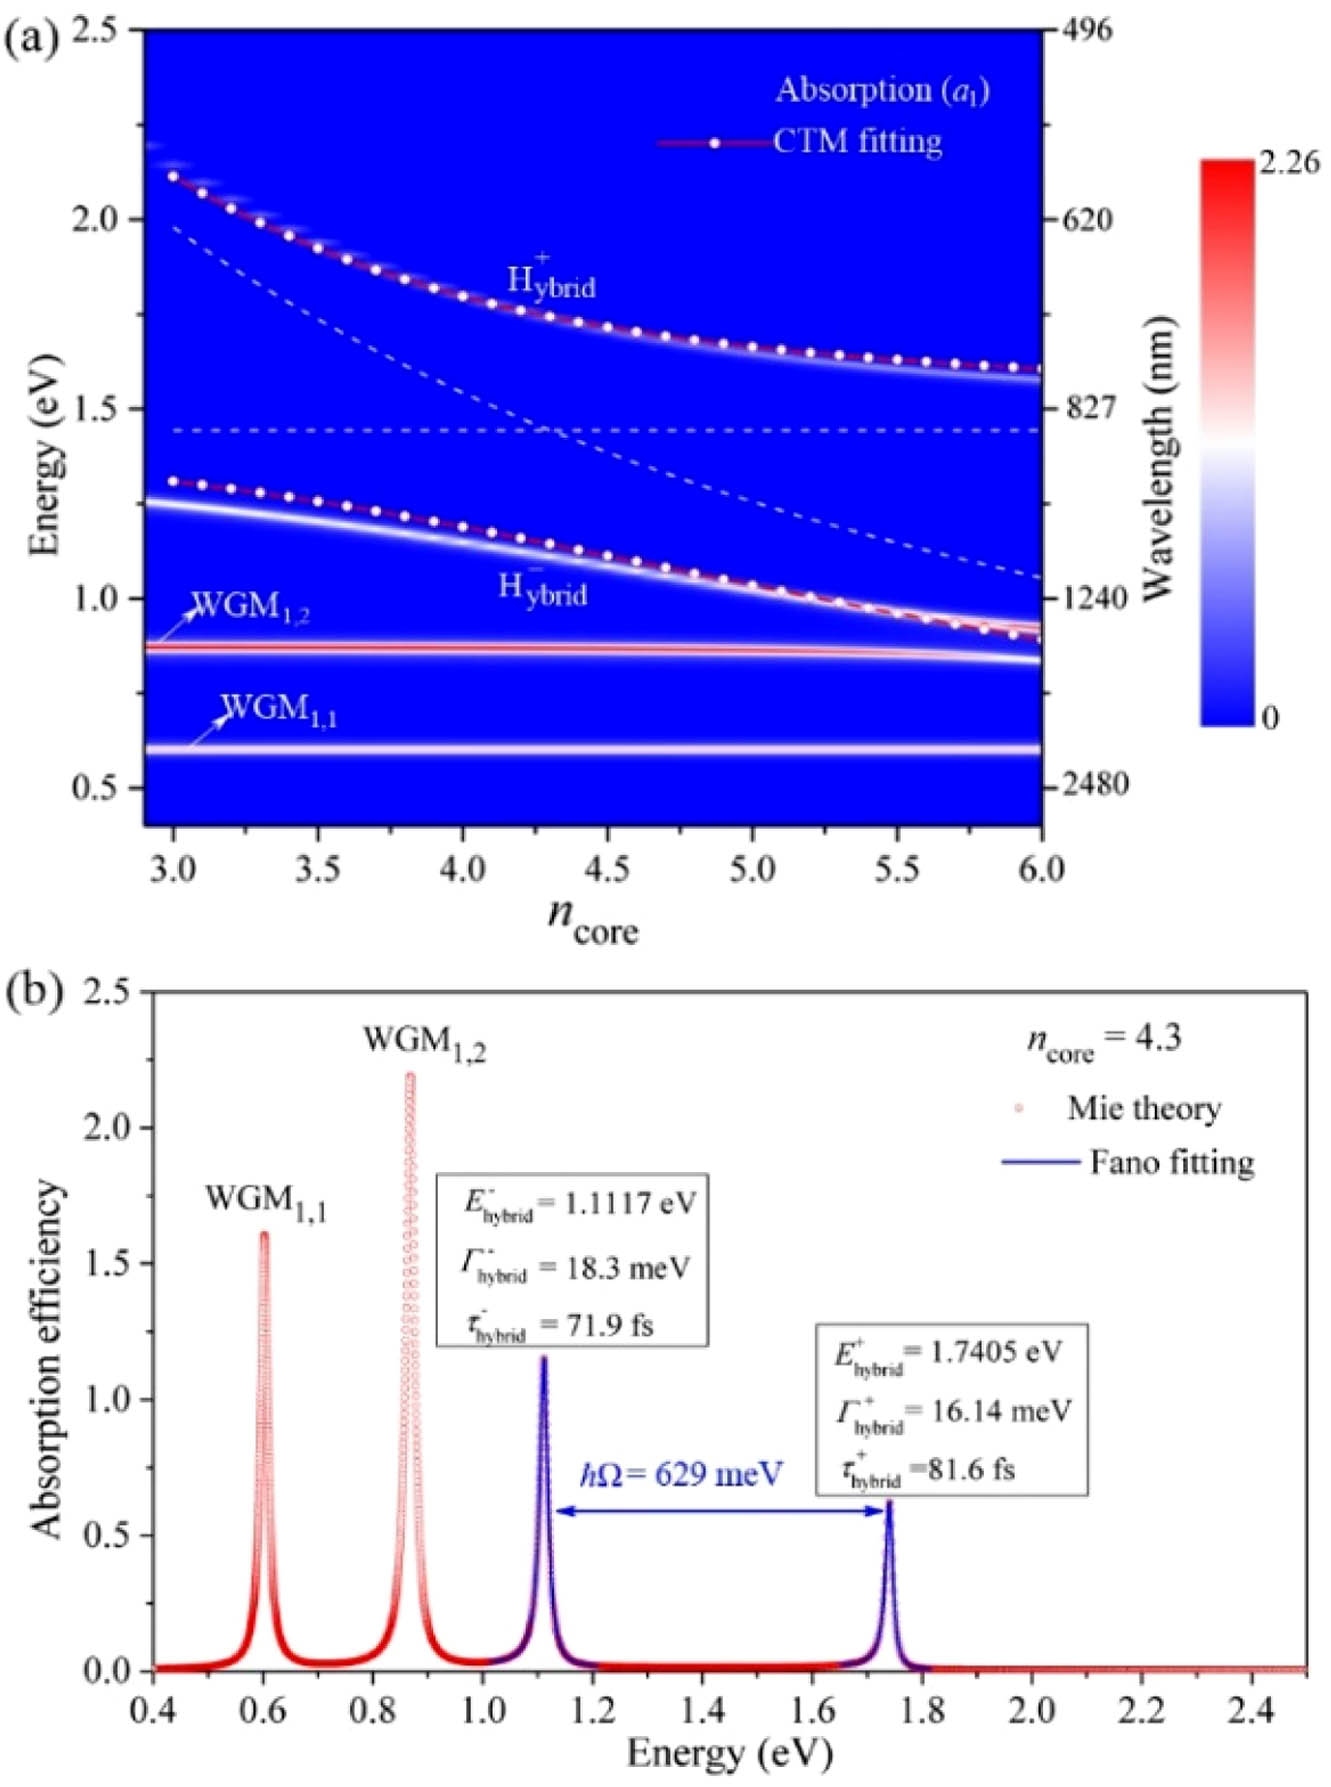
    Fig. 2. (a) Absorption efficiency spectra (a1) of a spherical HMM cavity (rcore=50  nm, s=15  nm, d=20  nm, and nd=1.4) as a function of the dielectric core index (ncore). The two red lines with circles present the dispersions of two hybrid modes predicted by the CTM fitting. The dashed white horizontal and oblique lines represent the resonant energy (left y axis) and wavelength (right y axis) of the uncoupled WGM1,3 and TM1,1 mode, respectively. (b) The absorption efficiency spectrum of the spherical HMM cavity with a dielectric core index of ncore=4.3 (ETM1,1=EWGM1,3). The blue lines are the Fano fitting results for the calculated absorption peaks.
    (a), (c) Electric field intensity distributions of Hybrid− (resonant energy: 1.1117 eV) and Hybrid+ (resonant energy: 1.7405 eV) at the k−E plane, respectively; (b), (d) electric field intensities along the white dashed lines in (a) and (c), respectively. The light blue and turquoise vertical stripes in (b) and (d) are used to indicate the dielectric core and dielectric layers (d1, d2, and d3) of the HMM cavity, respectively. Dashed circle lines show the silver/dielectric interfaces of the HMM cavity.
    Fig. 3. (a), (c) Electric field intensity distributions of Hybrid (resonant energy: 1.1117 eV) and Hybrid+ (resonant energy: 1.7405 eV) at the kE plane, respectively; (b), (d) electric field intensities along the white dashed lines in (a) and (c), respectively. The light blue and turquoise vertical stripes in (b) and (d) are used to indicate the dielectric core and dielectric layers (d1, d2, and d3) of the HMM cavity, respectively. Dashed circle lines show the silver/dielectric interfaces of the HMM cavity.
    (a), (c) x component of the electric field (Ex) for Hybrid −(resonant energy: 1.1117 eV) and Hybrid+ (resonant energy: 1.7405 eV) at the k−E plane, respectively; (b), (d) Ex along the white dashed line in (a) and (c), respectively. The light blue and turqoise vertical stripes in (b) and (d) are used to indicate the dielectric core and dielectric layers (d1, d2, and d3) of the HMM cavity, respectively.
    Fig. 4. (a), (c) x component of the electric field (Ex) for Hybrid (resonant energy: 1.1117 eV) and Hybrid+ (resonant energy: 1.7405 eV) at the kE plane, respectively; (b), (d) Ex along the white dashed line in (a) and (c), respectively. The light blue and turqoise vertical stripes in (b) and (d) are used to indicate the dielectric core and dielectric layers (d1, d2, and d3) of the HMM cavity, respectively.
    (a) Absorption efficiency spectra (a1) of the spherical HMM cavity (s=15 nm, d=20 nm, and nd=1.4) as a function of ncore for dielectric core radii of (bottom to top) 30 nm, 40 nm, 60 nm, and 80 nm. The two red lines with circles in each panel present the dispersions of two hybrid modes predicted by the CTM fitting. The dashed white horizontal and oblique lines in each panel represent the resonant energies of the uncoupled WGM1,3 and TM1,1 mode, respectively. The vertical dashed line indicates the dielectric core index ncore=4.3 where the resonant energies of two uncoupled modes are equal, ETM1,1=EWGM1,3. (b) The absorption efficiency spectra of the spherical HMM cavity at ncore=4.3 with dielectric core radii of 30 nm (black line), 40 nm (red line), 60 nm (blue line), and 80 nm (magenta line) (with absorption spectra offset vertically for clarity). (c) The Rabi splitting energy as a function of dielectric core radius (rcore).
    Fig. 5. (a) Absorption efficiency spectra (a1) of the spherical HMM cavity (s=15  nm, d=20  nm, and nd=1.4) as a function of ncore for dielectric core radii of (bottom to top) 30 nm, 40 nm, 60 nm, and 80 nm. The two red lines with circles in each panel present the dispersions of two hybrid modes predicted by the CTM fitting. The dashed white horizontal and oblique lines in each panel represent the resonant energies of the uncoupled WGM1,3 and TM1,1 mode, respectively. The vertical dashed line indicates the dielectric core index ncore=4.3 where the resonant energies of two uncoupled modes are equal, ETM1,1=EWGM1,3. (b) The absorption efficiency spectra of the spherical HMM cavity at ncore=4.3 with dielectric core radii of 30 nm (black line), 40 nm (red line), 60 nm (blue line), and 80 nm (magenta line) (with absorption spectra offset vertically for clarity). (c) The Rabi splitting energy as a function of dielectric core radius (rcore).
    Fano fitting (olive lines) for the multiple absorption peaks (hollow red circles) of a spherical HMM cavity (rcore=50 nm, ncore=2.0, s=15 nm, d=20 nm, and nd=1.4): (a) WGM1,1, (b) WGM1,2, (c) WGM1,3, (d) TM1,1, (e) WGM2,1, (f) WGM2,2, (g) WGM2,3, (h) TM2,1.
    Fig. 6. Fano fitting (olive lines) for the multiple absorption peaks (hollow red circles) of a spherical HMM cavity (rcore=50  nm, ncore=2.0, s=15  nm, d=20  nm, and nd=1.4): (a) WGM1,1, (b) WGM1,2, (c) WGM1,3, (d) TM1,1, (e) WGM2,1, (f) WGM2,2, (g) WGM2,3, (h) TM2,1.
    (a)–(d) Resonant energies of TM1,1 (magenta triangles), WGM1,3 (blue triangles), WGM1,2 (red circles), and WGM1,1 (black squares) as a function of dielectric layer thickness (d), dielectric layer index (nd), dielectric core radius (rcore), and dielectric core index (ncore), respectively; (e)–(h) energy differences (ΔE) between TM1,1 mode and WGM1,3/WGM1,2/WGM1,1 [ΔE(TM1,1−WGM1,3), blue trangles; ΔE(TM1,1−WGM1,2), red circles; ΔE(TM1,1−WGM1,1), black squares] as a function of d, nd, rcore, and ncore, respectively.
    Fig. 7. (a)–(d) Resonant energies of TM1,1 (magenta triangles), WGM1,3 (blue triangles), WGM1,2 (red circles), and WGM1,1 (black squares) as a function of dielectric layer thickness (d), dielectric layer index (nd), dielectric core radius (rcore), and dielectric core index (ncore), respectively; (e)–(h) energy differences (ΔE) between TM1,1 mode and WGM1,3/WGM1,2/WGM1,1 [ΔE(TM1,1WGM1,3), blue trangles; ΔE(TM1,1WGM1,2), red circles; ΔE(TM1,1WGM1,1), black squares] as a function of d, nd, rcore, and ncore, respectively.
    Radial (vertical direction) electric field intensity distributions of (a) WGM1,1, (b) WGM1,2, (c) WGM1,3, and (d) TM1,1. The light blue and turquoise vertical stripes are used to indicate the dielectric core and dielectric layers (d1, d2, and d3), respectively, of the HMM cavity (rcore=50 nm, ncore=2.0, s=15 nm, d=20 nm, and nd=1.4).
    Fig. 8. Radial (vertical direction) electric field intensity distributions of (a) WGM1,1, (b) WGM1,2, (c) WGM1,3, and (d) TM1,1. The light blue and turquoise vertical stripes are used to indicate the dielectric core and dielectric layers (d1, d2, and d3), respectively, of the HMM cavity (rcore=50  nm, ncore=2.0, s=15  nm, d=20  nm, and nd=1.4).
    Calculated absorption efficiency spectra (a1) of the spherical HMM cavity (rcore=50 nm, s=15 nm, d=20 nm, and nd=1.4) as a function of ncore with an inner silver thickness (s4) of (a) 15 nm, (b) 25 nm, and (c) 35 nm. The two red lines with circles in each panel show the resonant energies of two hybrid modes predicted by the CTM fitting.
    Fig. 9. Calculated absorption efficiency spectra (a1) of the spherical HMM cavity (rcore=50  nm, s=15  nm, d=20  nm, and nd=1.4) as a function of ncore with an inner silver thickness (s4) of (a) 15 nm, (b) 25 nm, and (c) 35 nm. The two red lines with circles in each panel show the resonant energies of two hybrid modes predicted by the CTM fitting.
    Ping Gu, Jing Chen, Siyu Chen, Chun Yang, Zuxing Zhang, Wei Du, Zhengdong Yan, Chaojun Tang, Zhuo Chen. Ultralarge Rabi splitting and broadband strong coupling in a spherical hyperbolic metamaterial cavity[J]. Photonics Research, 2021, 9(5): 829
    Download Citation