• Photonics Research
  • Vol. 9, Issue 5, 829 (2021)
Ping Gu1, Jing Chen1、*, Siyu Chen1, Chun Yang1, Zuxing Zhang1, Wei Du2、3, Zhengdong Yan4, Chaojun Tang5、6, and Zhuo Chen2、7
Author Affiliations
  • 1College of Electronic and Optical Engineering & College of Microelectronics, Institute of Advanced Photonics Technology, Nanjing University of Posts and Telecommunications, Nanjing 210023, China
  • 2College of Physics, National Laboratory of Solid State Microstructures, and Collaborative Innovation Center of Advanced Microstructures, Nanjing University, Nanjing 210093, China
  • 3College of Physics Science and Technology, Yangzhou University, Yangzhou 225002, China
  • 4College of Science, Nanjing Forestry University, Nanjing 210037, China
  • 5College of Science, Zhejiang University of Technology, Hangzhou 310023, China
  • 6e-mail: chaojuntang@126.com
  • 7e-mail: zchen@nju.edu.cn
  • show less
    DOI: 10.1364/PRJ.417648 Cite this Article Set citation alerts
    Ping Gu, Jing Chen, Siyu Chen, Chun Yang, Zuxing Zhang, Wei Du, Zhengdong Yan, Chaojun Tang, Zhuo Chen. Ultralarge Rabi splitting and broadband strong coupling in a spherical hyperbolic metamaterial cavity[J]. Photonics Research, 2021, 9(5): 829 Copy Citation Text show less

    Abstract

    Strong coupling (SC) between two resonant plasmon modes can result in the formation of new hybrid modes exhibiting Rabi splitting with strong energy exchange at the nanoscale. However, normal Rabi splitting is often limited to 50320 meV due to the short lifetime of the plasmon mode. Here, we theoretically demonstrate a record Rabi splitting energy as large as 805 meV arising from the SC between the high-Q plasmonic whispering gallery mode and high-Q cavity plasmon resonance supported by a spherical hyperbolic metamaterial cavity, which consists of a dielectric nanosphere core wrapped in 7 alternating layers of silver/dielectric materials. In addition, the new hybrid modes formed by the SC are shown to exhibit an extralong lifetime of up to 71.9–81.6 fs, with the large electric field intensity enhancement at both the dielectric core and the dielectric layers. More importantly, the spectral ranges of SC can be tuned across an ultrabroad range from the visible to the near-IR by simply changing the dielectric core size. These findings may have potential applications in bright single-photon sources.

    1. INTRODUCTION

    Localized surface plasmon resonances (LSPRs) arising from the collective electron oscillation at the surfaces of metallic nanoparticles have the ability to concentrate light into the nanometric scale, produce highly localized fields, and promote light–matter interactions [1], which enables their use in a wide range of nanophotonic devices, such as nanolasers [2,3] and nanosensors [4,5], as well as in Purcell enhancement [6,7]. In recent years, LSPR-based strong coupling (SC) characterized by the realization of Rabi oscillation and the formation of anti-crossing behavior (new hybrid states) has become the focus of research, divided into three main categories. In the first category, the realization of SC between gap plasmons supported by metal nanoparticle-on-mirror structures (LSPR–mirror coupled modes) and different kinds of quantum emitters, including semiconductor quantum dots (QDs) [8], molecules [914], J-aggregates [1517], and two-dimensional materials [1822], has been intensively explored. In particular, more recently it has been observed experimentally that the SC between gap plasmons and a single molecule [23,24] or single QD [25,26] successfully forms part-light/part-matter states (mixed states) at the quantum limit, which paves the road toward quantum entangled single-photon sources. In the second category, the SC between LSPR or magnetic plasmons and optical modes (waveguide modes or Fabry–Perot nanocavity modes) enables high electric and magnetic intensity enhancement [27,28] and assisted hot-electron transfer [28], which has important applications in photovoltaic devices [29,30]. In addition, the SC between LSPR or magnetic plasmons and propagating surface plasmon polaritons (SPPs) (the third category) can also achieve high electric and magnetic intensity enhancement [31,32], assisted hot-electron transfer [33], enhanced dephasing time [34], and improved sensor performance [35,36].

    The common shortcoming of LSPR is the low quality factor (Q-factor) caused by intrinsic metal absorption (nonradiative) and radiative (scattering) losses, which severely shortens the lifetime of only 7–8 fs and subsequently limits the interaction time with the matter [3739]. In other words, for LSPR-based SC systems, the LSPR corresponds to a short-lifetime oscillator (78  fs), while the quantum emitter (QD, molecule, J-aggregate, two-dimensional material), the optical mode (waveguide mode, Fabry–Perot nanocavity mode), and the SPP correspond to a long-lifetime oscillator. As a result, the Rabi splitting energies of LSPR-based SC systems are limited to less than 320 meV [836]. To the best of our knowledge, the largest Rabi splitting, with a record value of up to 700 meV, has only been demonstrated between plasmonic Fabry–Perot cavity modes and dye molecules [40], which reveals that using high-Q plasmonic modes could be an effective way for improving Rabi splitting.

    In this paper, we aim to explore the SC effect between two high-Q plasmonic modes in a spherical hyperbolic metamaterial (HMM) cavity formed by seven alternating silver/dielectric layers wrapping around a dielectric nanosphere core. First, we theoretically demonstrate a very large Rabi splitting energy of up to 805 meV arising from the SC between a high-Q plasmonic whispering gallery mode (WGM) and high-Q cavity plasmon resonance in the spherical HMM cavity. In addition, the new hybrid modes formed by the SC are demonstrated to exhibit a longer lifetime of up to 71.9–81.6 fs and achieve electric field intensity enhancement at both the dielectric core and the dielectric layers. More importantly, by simply adjusting the dielectric core size, the SC is demonstrated to occur at the same dielectric core index and to be tuned across a broad spectral range (from visible to near-IR).

    2. RESULTS AND DISCUSSION

    A. Mode Analysis of a Spherical HMM Cavity

    (a) Schematic of a spherical HMM cavity composed of a dielectric nanosphere core (radius rcore; refractive index ncore) and seven alternating layers of silver (thickness: s1, s2, s3, and s4) and dielectric layers (thickness d1, d2, d3, and d4; refractive index nd1, nd2, nd3, and nd4). (b) Calculated decomposed absorption efficiency spectrum for the first two electric terms (a1, a2) and the first magnetic term (b1) of the Mie expansion for an HMM cavity with the parameters rcore=50 nm, ncore=2.0, s1=s2=s3=s4=15 nm, d1=d2=d3=20 nm, and nd1=nd2=nd3=nd4=1.4. The b1 term is enlarged 50 times for clarity. (c)–(h) The electric field intensity distributions of WGM1,1 (0.602 eV), WGM1,2 (0.873 eV), WGM1,3 (1.305 eV), TM1,1 (2.827 eV), WGM2,1 (1.021 eV), and TM2,1 (3.217 eV), respectively. Dashed circle lines show the silver/dielectric interfaces of the HMM cavity.

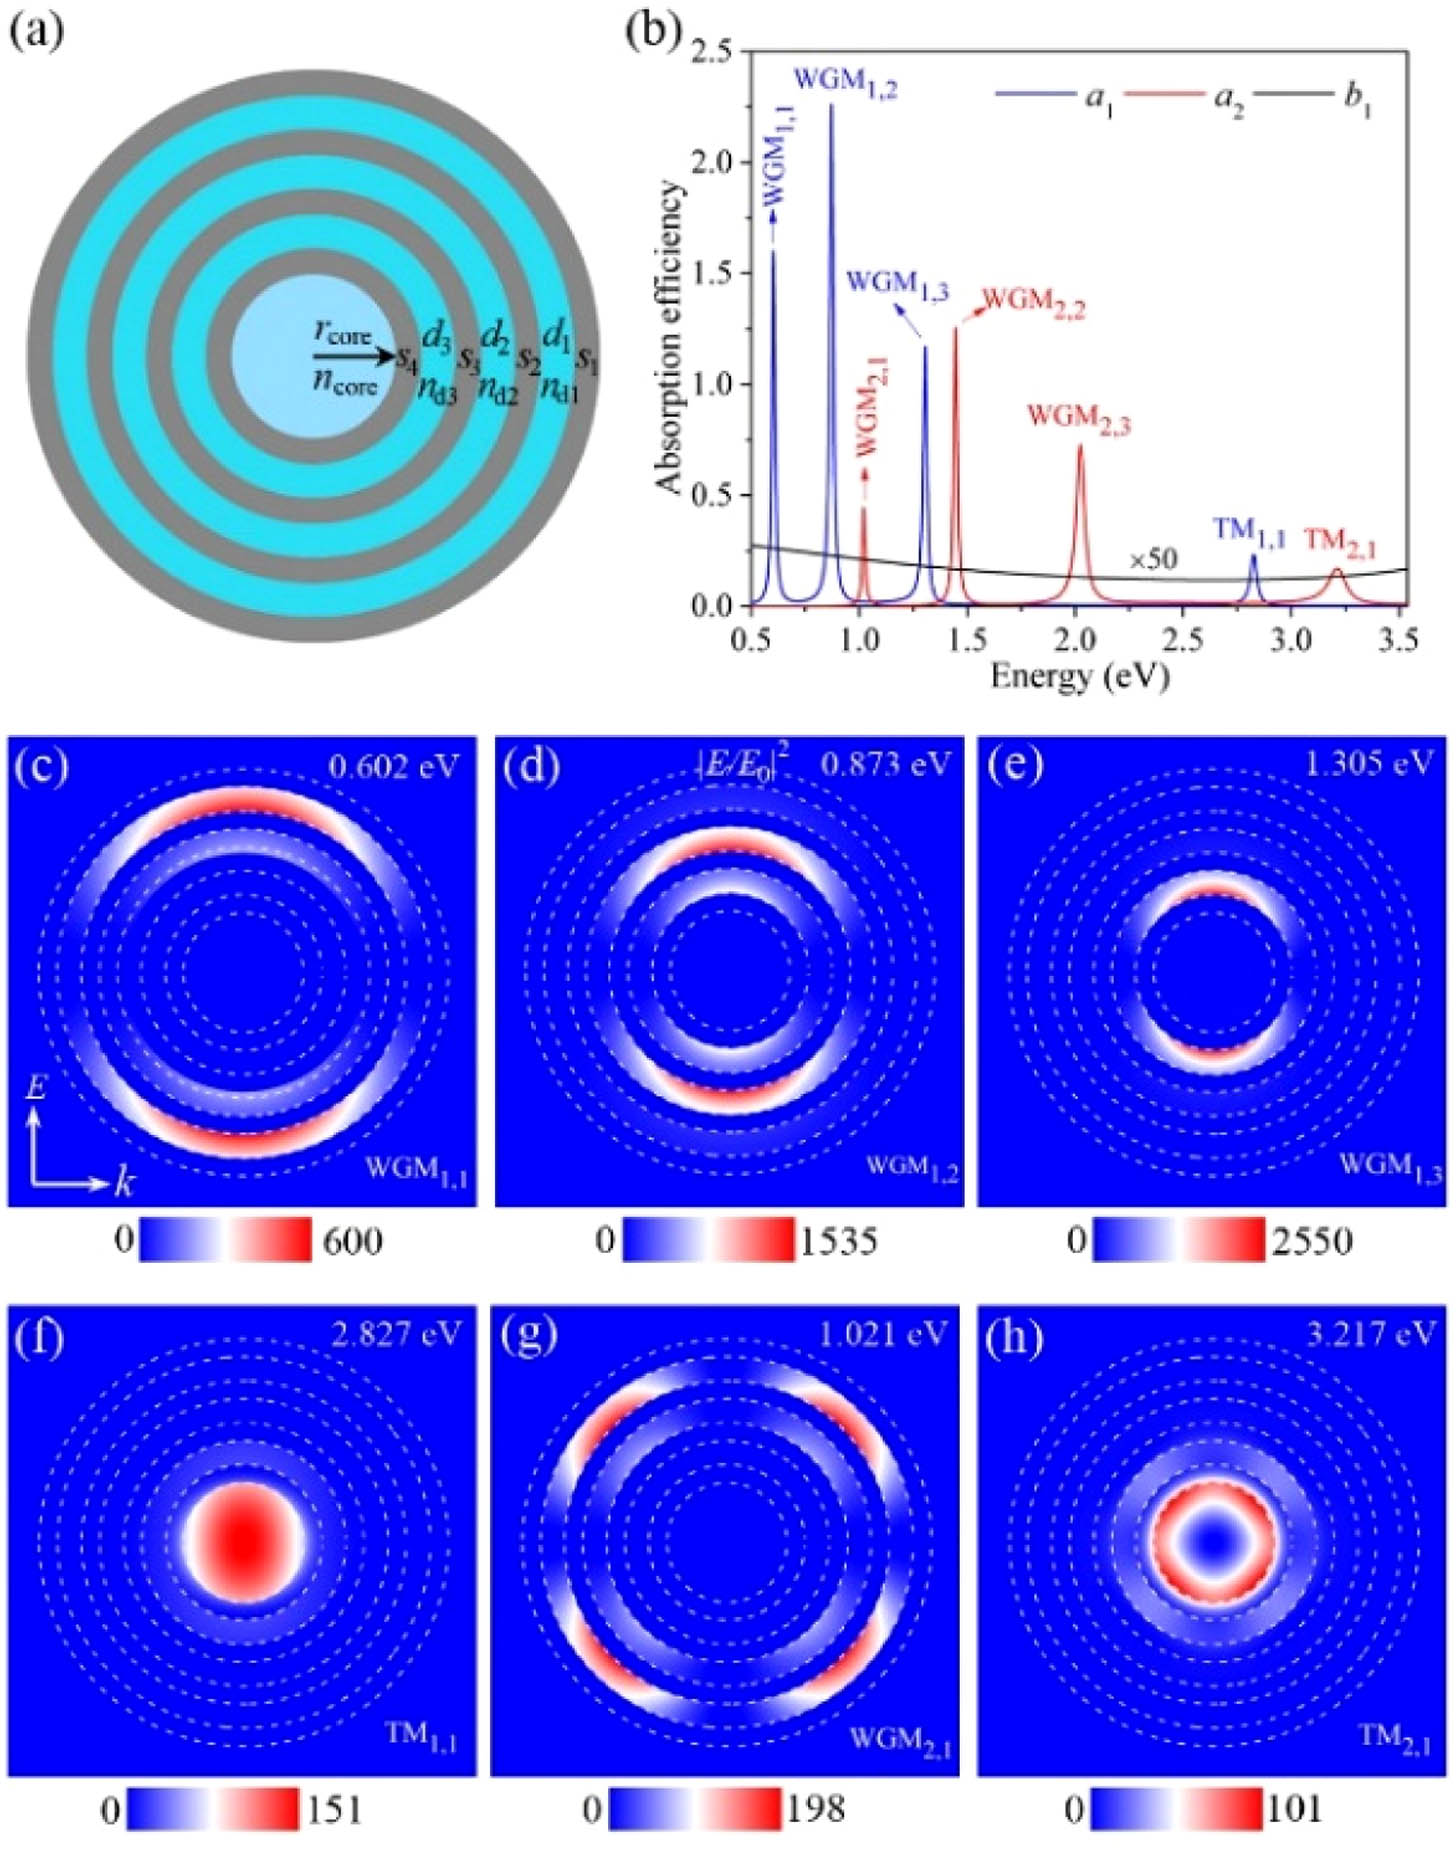
    Figure 1.(a) Schematic of a spherical HMM cavity composed of a dielectric nanosphere core (radius rcore; refractive index ncore) and seven alternating layers of silver (thickness: s1, s2, s3, and s4) and dielectric layers (thickness d1, d2, d3, and d4; refractive index nd1, nd2, nd3, and nd4). (b) Calculated decomposed absorption efficiency spectrum for the first two electric terms (a1, a2) and the first magnetic term (b1) of the Mie expansion for an HMM cavity with the parameters rcore=50  nm, ncore=2.0, s1=s2=s3=s4=15  nm, d1=d2=d3=20  nm, and nd1=nd2=nd3=nd4=1.4. The b1 term is enlarged 50 times for clarity. (c)–(h) The electric field intensity distributions of WGM1,1 (0.602 eV), WGM1,2 (0.873 eV), WGM1,3 (1.305 eV), TM1,1 (2.827 eV), WGM2,1 (1.021 eV), and TM2,1 (3.217 eV), respectively. Dashed circle lines show the silver/dielectric interfaces of the HMM cavity.

    In order to further understand these sharp resonant modes supported by the spherical HMM cavity, we perform the near-field profiles at the selected energies using an analytical Mie solution. Figures 1(c)–1(h) show the electric field intensity (|E/E0|2) distributions calculated at the resonances WGM1,1 (E0.602  eV), WGM1,2 (E0.873  eV), WGM1,3 (E1.305  eV), TM1,1 (E2.827  eV), WGM2,1 (E1.021  eV), and TM2,1 (E3.217  eV), respectively. It is clear in Figs. 1(c)–1(h) that the electric fields for all resonant modes are tightly confined in the different dielectric layers (WGMs) or the dielectric core (TM modes) of the HMM cavity, and their intensities are all greatly enhanced with factors from 101 to 2550. In addition, the electric field distributions of WGM1,1, WGM1,2, and WGM1,3 shown in Figs. 1(c)–1(e) are found to exhibit a similar twofold symmetry, which reveals that these three resonances correspond to the excitations of a dipolar WGM with an angular mode number of l=1. The difference in the field distribution is that the electric fields for WGM11, WGM1,2, and WGM1,3 are mainly concentrated in the first (d1), second (d2), and third dielectric layers (d3) of the HMM cavity, respectively. This confirms that WGM1,1, WGM1,2, and WGM1,3 are the first-order (m=1), second-order (m=2), and third-order modes (m=3), respectively, from the dipolar WGMs (l=1). For the resonance TM1,1 (E2.827  eV), the electric fields are mainly localized within the dielectric core, showing a single-lobed feature [Fig. 1(f)], which corresponds to the excitations of electric dipolar cavity plasmons (l=1) in the HMM cavity. Similar to the analysis above, the electric field intensity distributions for both WGM2,1 and TM2,1 modes should have the same fourfold symmetry feature (l=2), and should mainly be concentrated within the first dielectric layer (d1) and the dielectric core, as displayed in Figs. 1(g) and 1(h), respectively. The above results clearly demonstrate that both the plasmonic WGMs and the cavity plasmon modes can be excited in the HMM cavity. In addition, the sharpness of the WGMs and TM modes in the absorption spectrum reveals a long lifetime of τ1484  fs (Fig. 6 in Appendix A). As a result, the spherical HMM cavity can provide us with an ideal platform for investigating the coupling effect between two high-Q (long-lifetime) plasmonic modes.

    B. Ultralarge Rabi Splitting via Strong Coupling between WGM1,3 and TM1,1 Modes

    (a) Absorption efficiency spectra (a1) of a spherical HMM cavity (rcore=50 nm, s=15 nm, d=20 nm, and nd=1.4) as a function of the dielectric core index (ncore). The two red lines with circles present the dispersions of two hybrid modes predicted by the CTM fitting. The dashed white horizontal and oblique lines represent the resonant energy (left y axis) and wavelength (right y axis) of the uncoupled WGM1,3 and TM1,1 mode, respectively. (b) The absorption efficiency spectrum of the spherical HMM cavity with a dielectric core index of ncore=4.3 (ETM1,1=EWGM1,3). The blue lines are the Fano fitting results for the calculated absorption peaks.

    Figure 2.(a) Absorption efficiency spectra (a1) of a spherical HMM cavity (rcore=50  nm, s=15  nm, d=20  nm, and nd=1.4) as a function of the dielectric core index (ncore). The two red lines with circles present the dispersions of two hybrid modes predicted by the CTM fitting. The dashed white horizontal and oblique lines represent the resonant energy (left y axis) and wavelength (right y axis) of the uncoupled WGM1,3 and TM1,1 mode, respectively. (b) The absorption efficiency spectrum of the spherical HMM cavity with a dielectric core index of ncore=4.3 (ETM1,1=EWGM1,3). The blue lines are the Fano fitting results for the calculated absorption peaks.

    To further reveal the physical origins of the observed anti-crossing effect between WGM1,3 and TM1,1 mode, we use a semiclassical coupled two-oscillator model (CTM) in the following expression [34,36]: Ehybrid±=ETM+EWGM2±Δ2+(ETMEWGM)24,where Δ is the coupling strength and EWGM and ETM are the resonant energies of the uncoupled WGM1,3 and TM1,1 mode, respectively. To accurately obtain the resonant energies of the uncoupled WGM1,3 and TM1,1 mode, the coupling effect between these two modes should be completely excluded. As has been demonstrated above, most of the electric fields of the WGMs are tightly concentrated within the dielectric layers of the HMM cavity (Fig. 1). This feature reveals that the resonant energies of the WGMs should be insensitive to the core materials, even for metals. In addition, if we set the dielectric core of the HMM cavity as a solid silver nanosphere, the cavity plasmons cannot be supported. As a result, the coupling effect between cavity plasmons and WGMs can be completely excluded. The resonant energy of the uncoupled WGM1,3 is extracted as 1.444 eV by changing the dielectric core of the HMM cavity to a same-sized solid silver nanosphere, which is displayed as the horizontal white dashed line in Fig. 2(a). Similarly, the resonant energy of the uncoupled TM1,1 mode can be obtained via a metallic nanoshell, which cannot support plasmonic WGMs. The cavity plasmons supported by the metallic shell are highly dependent on both the dielectric core and the metal layer thickness [45]. For a silver nanoshell with a thicker silver layer (more than 60 nm), the cavity plasmons cannot be efficiently excited by the visible and near-IR light because the silver thickness is much greater than the optical skin depth in the current spectral range [45]. For a thinner silver layer (less than 15 nm), the light confinement ability is weak, and thus it cannot effectively concentrate the resonant energy within the dielectric core of the silver nanoshell, which also results in a broad feature in the far-field spectrum due to the large radiative loss [45]. Therefore, the resonant energy of an uncoupled TM1,1 mode is extracted in a silver nanoshell by choosing an appropriate value for the silver thickness (30 nm) for the same dielectric core size (rcore=50  nm). The resonant energies of uncoupled TM1,1 modes as a function of ncore are shown by the oblique white dashed line in Fig. 2(a).

    After we perform the CTM model, the resonant energies of the two hybrid modes are predicted and displayed with the red lines with circles in Fig. 2(a). Comparing the CTM model (red/circle lines) with the theoretical results (Mie theory) shows good agreement [Fig. 2(a)], which successfully reproduces the anti-crossing behavior of WGM1,3 and TM1,1 mode. As a result, the normal Rabi splitting energy is obtained at E(TM1,1)=E(WGM1,3) or ncore=4.3, with an ultralarge value of up to 629 meV (Ω=629  meV) displayed in Fig. 2(b), which corresponds to a large coupling strength of Δ=0.198(eV)2 (Ω=2Δ). It should be pointed out that the refractive index of several semiconductor materials can reach a value of 4.3, such as Si, Ge, and GaAs [46,47]. We also note that Ω(ΓTM+ΓWGM)/2=28  meV as required for SC. It is also clearly seen in Fig. 2(a) that the TM1,1 resonance can also result in anti-crossing behavior with WGM1,2 mode when shifting close to the resonant energy of WGM1,2 at a large ncore (6), while the Rabi splitting energy of TM1,1 and WGM1,2 is much smaller than that of TM1,1 and WGM1,3 due to the fact that the electric field spatial overlap between TM1,1 mode and WGM1,3 is much larger than that of WGM1,2 and WGM1,1 both at the dielectric core and in the dielectric layers (Fig. 8 in Appendix A). In Fig. 2(b), we further find that two hybrid modes formed by SC exhibit ultralong lifetimes of 71.9 fs (Ehybrid=1.1117  eV) and 81.6 fs (Ehybrid+=1.7405  eV), which are about 2 times larger than those of the uncoupled WGM1,3 and TM1,1 mode (Fig. 6 in Appendix A).

    (a), (c) Electric field intensity distributions of Hybrid− (resonant energy: 1.1117 eV) and Hybrid+ (resonant energy: 1.7405 eV) at the k−E plane, respectively; (b), (d) electric field intensities along the white dashed lines in (a) and (c), respectively. The light blue and turquoise vertical stripes in (b) and (d) are used to indicate the dielectric core and dielectric layers (d1, d2, and d3) of the HMM cavity, respectively. Dashed circle lines show the silver/dielectric interfaces of the HMM cavity.

    Figure 3.(a), (c) Electric field intensity distributions of Hybrid (resonant energy: 1.1117 eV) and Hybrid+ (resonant energy: 1.7405 eV) at the kE plane, respectively; (b), (d) electric field intensities along the white dashed lines in (a) and (c), respectively. The light blue and turquoise vertical stripes in (b) and (d) are used to indicate the dielectric core and dielectric layers (d1, d2, and d3) of the HMM cavity, respectively. Dashed circle lines show the silver/dielectric interfaces of the HMM cavity.

    (a), (c) x component of the electric field (Ex) for Hybrid −(resonant energy: 1.1117 eV) and Hybrid+ (resonant energy: 1.7405 eV) at the k−E plane, respectively; (b), (d) Ex along the white dashed line in (a) and (c), respectively. The light blue and turqoise vertical stripes in (b) and (d) are used to indicate the dielectric core and dielectric layers (d1, d2, and d3) of the HMM cavity, respectively.

    Figure 4.(a), (c) x component of the electric field (Ex) for Hybrid (resonant energy: 1.1117 eV) and Hybrid+ (resonant energy: 1.7405 eV) at the kE plane, respectively; (b), (d) Ex along the white dashed line in (a) and (c), respectively. The light blue and turqoise vertical stripes in (b) and (d) are used to indicate the dielectric core and dielectric layers (d1, d2, and d3) of the HMM cavity, respectively.

    In the following, we further demonstrate that the normal Rabi splitting energy (Ω) or the coupling strength (Δ) is mainly determined by the inner silver thickness (s4). As s4 increases from 15 nm to 25 nm and to 35 nm, not only does the Rabi splitting energy (or coupling strength Δ) decrease quickly from 629 meV [Δ=0.198(eV)2] to 335 meV [Δ=0.056  (eV)2] and to 185 meV [Δ=0.017  (eV)2], but the ncore also increases rapidly from 4.3 to 5.0 and to 5.5, respectively. The values of 5.0 and 5.5 obviously exceed the refractive index of most materials in the visible to the near-IR spectral range (Fig. 9 in Appendix A).

    C. Broadband Strong Coupling Produced by Varying the Dielectric Core Size

    (a) Absorption efficiency spectra (a1) of the spherical HMM cavity (s=15 nm, d=20 nm, and nd=1.4) as a function of ncore for dielectric core radii of (bottom to top) 30 nm, 40 nm, 60 nm, and 80 nm. The two red lines with circles in each panel present the dispersions of two hybrid modes predicted by the CTM fitting. The dashed white horizontal and oblique lines in each panel represent the resonant energies of the uncoupled WGM1,3 and TM1,1 mode, respectively. The vertical dashed line indicates the dielectric core index ncore=4.3 where the resonant energies of two uncoupled modes are equal, ETM1,1=EWGM1,3. (b) The absorption efficiency spectra of the spherical HMM cavity at ncore=4.3 with dielectric core radii of 30 nm (black line), 40 nm (red line), 60 nm (blue line), and 80 nm (magenta line) (with absorption spectra offset vertically for clarity). (c) The Rabi splitting energy as a function of dielectric core radius (rcore).

    Figure 5.(a) Absorption efficiency spectra (a1) of the spherical HMM cavity (s=15  nm, d=20  nm, and nd=1.4) as a function of ncore for dielectric core radii of (bottom to top) 30 nm, 40 nm, 60 nm, and 80 nm. The two red lines with circles in each panel present the dispersions of two hybrid modes predicted by the CTM fitting. The dashed white horizontal and oblique lines in each panel represent the resonant energies of the uncoupled WGM1,3 and TM1,1 mode, respectively. The vertical dashed line indicates the dielectric core index ncore=4.3 where the resonant energies of two uncoupled modes are equal, ETM1,1=EWGM1,3. (b) The absorption efficiency spectra of the spherical HMM cavity at ncore=4.3 with dielectric core radii of 30 nm (black line), 40 nm (red line), 60 nm (blue line), and 80 nm (magenta line) (with absorption spectra offset vertically for clarity). (c) The Rabi splitting energy as a function of dielectric core radius (rcore).

    The absorption efficiency spectra of the spherical HMM cavity at ncore=4.3 with dielectric core radii of 30 nm, 40 nm, 60 nm, and 80 nm are shown in Fig. 5(b). For the HMM cavity with a relatively small dielectric core radius of rcore=30  nm, a record normal Rabi splitting energy as large as 788 meV [Δ=0.31(eV)2] arising from the SC between WGM1,3 and TM1,1 mode is observed in the visible spectral range from 2.23 eV (556.1 nm) to 1.441 eV (860.5 nm), as indicated by the black line in Fig. 5(b). As rcore increases from 30 nm to 40 nm, to 60 nm, and to 80 nm, the Rabi splitting energy decreases from 788 meV (black line) to 713 meV (red line), to 552 meV (blue line), and to 428 meV (magenta line), respectively. It should be noted that the Rabi splitting energy for the HMM cavity with a relatively large dielectric core radius of rcore=80  nm still reaches a relatively high value of 428 meV, and a high-order cavity plasmon mode of TM1,2 appears at 2.813 eV in the current spectral range, which is shown by the magenta line in Fig. 5(b). In addition, the spectral ranges where the SC occurs are shifted from 2.23–1.441 eV (556.1–860.3 nm) to 1.965–1.252 eV (631–990.4 nm), to 1.554–1.003 eV (797.7–1236.4 nm), and to 1.273–0.844 eV (974.4–1469.1 nm) as rcore increases from 30 nm to 40 nm, to 60 nm, and to 80 nm [Fig. 5(b)], demonstrating that the SC between WGM1,3 and TM1,1 mode in the HMM cavity can be tuned across a broad spectral range by simply changing the dielectric core size.

    Figure 5(c) displays the Rabi splitting energy in the HMM cavity as a function of rcore (from 10 nm to 80 nm), and presents a trend of first an increase and then a decrease, revealing a maximum Rabi splitting energy of 805 meV at rcore=20  nm. As rcore is increased from 20 nm to 80 nm, the Rabi splitting energy linearly decreases from 805 meV to 428 meV, due to the fact that the longer-wavelength light has a smaller optical skin depth in silver, and the coupling strength (Rabi splitting) is thus reduced for the longer-wavelength modes supported by the larger rcore of the HMM cavity. For the smaller rcore, the coupling strength (Rabi splitting) between WGM1,3 and TM1,1 mode in the HMM cavity is also limited when the resonant modes blueshift to the vicinity of the interband transition of the silver [42,43]. It is shown in Fig. 5(c) that the Rabi splitting energy decreases quickly from 805 meV at rcore=20  nm to 626 meV at rcore=10  nm.

    3. CONCLUSION

    In summary, we have theoretically demonstrated a record Rabi splitting energy of up to 805 meV, arising from the SC between two high-Q (long-lifetime) plasmonic resonances (WGM1,3 and TM1,1 mode) in a spherical HMM cavity. The strong energy exchange between these two modes leads to the formation of new hybrid modes, which exhibit a longer lifetime (τ71.981.6  fs) and great enhancement of the electric field intensity both at the dielectric core and in the dielectric layers in the HMM cavity. Importantly, by adjusting the dielectric core size, we have shown that the SC occurs at the same dielectric core index and can be tuned across a broad range from the visible to the near-IR spectral range (broadband nature). These results provide direction for achieving ultralong lifetimes of surface plasmons and may find potential applications in bright single-photon sources [48,49].

    Acknowledgment

    Acknowledgment. G. P. thanks the NUPTSF and the Double Innovation Project of Jiangsu Province.

    APPENDIX A: DETAILED NUMERICAL CALCULATION METHOD

    1. Lifetime of the Resonant WGMs and TM Cavity Plasmon Modes

    To calculate the lifetime (τ) of resonant WGMs and TM modes in a spherical HMM cavity, the sharp absorption peaks are first fitted using a Fano formula: F(ε)=σbg+σ0(ε+q)2/(1+ε2), where σ0 and σbg are the normalized and background absorption, q is the asymmetry parameter, and ε=2(E?Eres)/Γ, with Eres and Γ being the resonant energy and linewidth of the mode, respectively. The Fano fitting results for WGM1,1, WGM1,2, WGM1,3, TM1,1, WGM2,1, WGM2,2, WGM2,3, and TM2,1 are shown as olive lines in Figs.?6(a)–6(h), and show good agreement with the theoretical absorption efficiency spectra. With the extracted linewidth of Γ, the lifetime (τ) of the resonant mode is then calculated by the formula τ=2?/Γ, where ?=6.582119514×10?16??eV·ns.

    Fano fitting (olive lines) for the multiple absorption peaks (hollow red circles) of a spherical HMM cavity (rcore=50 nm, ncore=2.0, s=15 nm, d=20 nm, and nd=1.4): (a) WGM1,1, (b) WGM1,2, (c) WGM1,3, (d) TM1,1, (e) WGM2,1, (f) WGM2,2, (g) WGM2,3, (h) TM2,1.

    Figure 6.Fano fitting (olive lines) for the multiple absorption peaks (hollow red circles) of a spherical HMM cavity (rcore=50  nm, ncore=2.0, s=15  nm, d=20  nm, and nd=1.4): (a) WGM1,1, (b) WGM1,2, (c) WGM1,3, (d) TM1,1, (e) WGM2,1, (f) WGM2,2, (g) WGM2,3, (h) TM2,1.

    (a)–(d) Resonant energies of TM1,1 (magenta triangles), WGM1,3 (blue triangles), WGM1,2 (red circles), and WGM1,1 (black squares) as a function of dielectric layer thickness (d), dielectric layer index (nd), dielectric core radius (rcore), and dielectric core index (ncore), respectively; (e)–(h) energy differences (ΔE) between TM1,1 mode and WGM1,3/WGM1,2/WGM1,1 [ΔE(TM1,1−WGM1,3), blue trangles; ΔE(TM1,1−WGM1,2), red circles; ΔE(TM1,1−WGM1,1), black squares] as a function of d, nd, rcore, and ncore, respectively.

    Figure 7.(a)–(d) Resonant energies of TM1,1 (magenta triangles), WGM1,3 (blue triangles), WGM1,2 (red circles), and WGM1,1 (black squares) as a function of dielectric layer thickness (d), dielectric layer index (nd), dielectric core radius (rcore), and dielectric core index (ncore), respectively; (e)–(h) energy differences (ΔE) between TM1,1 mode and WGM1,3/WGM1,2/WGM1,1 [ΔE(TM1,1WGM1,3), blue trangles; ΔE(TM1,1WGM1,2), red circles; ΔE(TM1,1WGM1,1), black squares] as a function of d, nd, rcore, and ncore, respectively.

    Radial (vertical direction) electric field intensity distributions of (a) WGM1,1, (b) WGM1,2, (c) WGM1,3, and (d) TM1,1. The light blue and turquoise vertical stripes are used to indicate the dielectric core and dielectric layers (d1, d2, and d3), respectively, of the HMM cavity (rcore=50 nm, ncore=2.0, s=15 nm, d=20 nm, and nd=1.4).

    Figure 8.Radial (vertical direction) electric field intensity distributions of (a) WGM1,1, (b) WGM1,2, (c) WGM1,3, and (d) TM1,1. The light blue and turquoise vertical stripes are used to indicate the dielectric core and dielectric layers (d1, d2, and d3), respectively, of the HMM cavity (rcore=50  nm, ncore=2.0, s=15  nm, d=20  nm, and nd=1.4).

    Calculated absorption efficiency spectra (a1) of the spherical HMM cavity (rcore=50 nm, s=15 nm, d=20 nm, and nd=1.4) as a function of ncore with an inner silver thickness (s4) of (a) 15 nm, (b) 25 nm, and (c) 35 nm. The two red lines with circles in each panel show the resonant energies of two hybrid modes predicted by the CTM fitting.

    Figure 9.Calculated absorption efficiency spectra (a1) of the spherical HMM cavity (rcore=50  nm, s=15  nm, d=20  nm, and nd=1.4) as a function of ncore with an inner silver thickness (s4) of (a) 15 nm, (b) 25 nm, and (c) 35 nm. The two red lines with circles in each panel show the resonant energies of two hybrid modes predicted by the CTM fitting.

    However, for d values larger than 20?nm, the resonant energies begin to converge as the layer-by-layer coupling becomes weak [Fig.?7(a)]. The resonant energy of TM1,1 mode shows a slightly linear decrease as d increases from 2?nm to 50?nm [Fig.?7(a)]. It should be noted that the strong layer-by-layer coupling leads to a larger ΔE (2.5??eV) between TM1,1 mode and WGM1,1/WGM1,2/WGM1,3 for a 2?nm dielectric layer thickness, and ΔE decreases as d increases from 2?nm to 50?nm (decreases quickly before 20?nm and decreases slowly after 20?nm) [Fig.?7(e)]. Although ΔE can be more smaller for a larger d, a larger d leads to a lower excitation efficiency of the resonant modes and a relatively large HMM cavity. As a result, when we comprehensively consider ΔE, the exicitation efficiency, and the cavity size, the dielectric layer thickness (d) of the sperical HMM cavity is choosen to be 20?nm in this study. In Fig.?7(b), the resonant energies of both TM1,1 mode and WGM1,1/WGM1,2/WGM1,3 all decrease linearly as the dielectric layer index (nd) increases from 1.4 to 2.0. It is also shown in Fig.?7(b) that the slope of the TM1,1 mode [?0.276??eV/RIU (refractive index unit)] is smaller than that of WGM1,1 (?0.294??eV/RIU), WGM1,2 (?0.423??eV/RIU), or WGM1,3 (?0.611??eV/RIU), resulting in ΔE increasing as nd increases from 1.4 to 2.0 [Fig.?7(f)]. Therefore, nd is choosen and fixed to be 1.4 in this paper, which corresponds to the refractive index of MgF2 material. The resonant energies of both TM1,1 mode and WGM1,1/WGM1,2/WGM1,3 are also decreasing near-linearly as the dielectric core radius (rcore) increases from 30?nm to 100?nm [Fig.?7(c)]. However, the slope of TM1,1 mode (–0.019?eV/nm) is obviously larger than that of WGM1,1 (–0.0037?eV/nm), WGM1,2 (?0.0066??eV/nm), or the WGM1,3 (?0.012??eV/nm), resuling in ΔE decreasing as rcore increases from 30?nm to 100?nm, as shown in Fig.?7(g). As the dielectric core index (ncore) increases from 1.8 to 2.4, the resonant energy of TM1,1 mode decreases linearly, while the resonant energies of WGM1,1, WGM1,2, and WGM1,3 all remain at the same value [Fig.?7(d)]. It is clear in Fig.?7(h) that ΔE decreases linealy as ncore increases from 1.8 to 2.4, demonstrating that adjusting the dielectric core index (ncore) is the most effective method of reducing ΔE while keeping the HMM cavity size unchanged.

    3. Electric Field Spatial Overlap between TM<sub>1,1</sub> Resonance and WGM<sub>1,3</sub>/WGM<sub>1,2</sub>/WGM<sub>1,1</sub>

    Figure?8 displays the spatial overlap of electric field between TM1,1 resonance and WGM1,3/WGM1,2/WGM1,1 in the HMM cavity (rcore?=?50?nm, ncore?=?2.0, s?=?15?nm, d?=20?nm, and nd?=?1.4), clearly revealing that the TM1,1 mode [Fig.?8(d)] has the largest electric field spatial overlap (both at the dielectric core and in the dielectric layers) with the WGM1,3 resonance [Fig.?8(c)] as compared to the WGM1,2 [Fig.?8(b)] and WGM1,1 [Fig.?8(a)].

    4. Rabi Splitting versus the Inner Silver Thickness

    Figure?9 shows the normal Rabi splitting energy (?Ω) or coupling strength (?) in the HMM for different inner silver thickness (s4). It is clear in Fig.?9 that the Rabi splitting energy (or coupling strength) decreases quickly from 629?meV [??=?0.198 (eV)2] to 335?meV [??=?0.056?(eV)2] and to 185?meV [??=?0.017?(eV)2] when the s4 increases from 15?nm [Fig.?9(a)] to 25?nm [Fig.?9(b)] and to 35?nm [Fig.?9(c)]. In addition, the ncore where the SC occurs at EWGM1,3=ETM1,1 increases rapidly from 4.3 to 5.0 and to 5.5 (Fig.?9).

    References

    [1] D. K. Gramotnev, S. I. Bozhevolnyi. Plasmonics beyond the diffraction limit. Nat. Photonics, 4, 83-91(2009).

    [2] M. A. Noginov, G. Zhu, A. M. Belgrave, R. Bakker, V. M. Shalaev, E. E. Narimanov, S. Stout, E. Herz, T. Suteewong, U. Wiesner. Demonstration of a spaser-based nanolaser. Nature, 460, 1110-1112(2009).

    [3] P. Song, J. H. Wang, M. Zhang, F. Yang, H. J. Lu, B. Kang, J. J. Xu, H. Y. Chen. Three-level spaser for next-generation luminescent nanoprobe. Sci. Adv., 4, eaat0292(2018).

    [4] S. Lal, S. Link, N. J. Halas. Nano-optics from sensing to waveguiding. Nat. Photonics, 1, 641-648(2007).

    [5] T. Xue, W. Liang, Y. Li, Y. Sun, Y. Xiang, Y. Zhang, Z. Dai, Y. Duo, L. Wu, K. Qi, B. N. Shivananju, L. Zhang, X. Cui, H. Zhang, Q. Bao. Ultrasensitive detection of miRNA with an antimonene-based surface plasmon resonance. Nat. Commun., 10, 28(2019).

    [6] A. Kinkhabwala, Z. Yu, S. Fan, Y. Avlasevich, K. Müllen, W. E. Moerner. Large single-molecule fluorescence enhancements produced by a bowtie nanoantenna. Nat. Photonics, 3, 654-657(2009).

    [7] G. M. Akselrod, C. Argyropoulos, T. B. Hoang, C. Ciracì, C. Fang, J. Huang, D. R. Smith, M. H. Mikkelsen. Probing the mechanisms of large Purcell enhancement in plasmonic nanoantennas. Nat. Photonics, 8, 835-840(2014).

    [8] K. Santhosh, O. Bitton, L. Chuntonov, G. Haran. Vacuum Rabi splitting in a plasmonic cavity at the single quantum emitter limit. Nat. Commun., 7, 11823(2016).

    [9] L. Shi, T. K. Hakala, H. T. Rekola, J. P. Martikainen, R. J. Moerland, P. Trömä. Spatial coherence properties of organic molecules coupled to plasmonic surface lattice resonances in the weak and strong coupling regimes. Phys. Rev. Lett., 112, 153002(2014).

    [10] G. Zengin, M. Wersäll, S. Nilsson, T. J. Antosiewicz, M. Käll, T. Shegai. Realizing strong light-matter interactions between single-nanoparticle plasmons and molecular excitons at ambient conditions. Phys. Rev. Lett., 114, 157401(2015).

    [11] E. M. Roller, C. Argyropoulos, A. Högele, T. Liedl, M. Pilo-Pais. Plasmon-exciton coupling using DNA templates. Nano Lett., 16, 5962-5966(2016).

    [12] F. Kato, H. Minamimoto, F. Nagasawa, Y. S. Yamamoto, T. Itoh, K. Murakoshi. Active tuning of strong coupling states between dye excitons and localized surface plasmons via electrochemical potential control. ACS Photon., 5, 788-796(2018).

    [13] O. S. Ojambati, R. Chikkaraddy, W. D. Deacon, M. Horton, D. Kos, V. A. Turek, U. F. Keyser, J. J. Baumberg. Quantum electrodynamics at room temperature coupling a single vibrating molecule with a plasmonic nanocavity. Nat. Commun., 10, 1049(2019).

    [14] K. S. Menghrajani, H. A. Fernandez, G. R. Nash, W. L. Barnes. Hybridization of multiple vibrational modes via strong coupling using confined light fields. Adv. Opt. Mater., 7, 1900403(2019).

    [15] P. Vasa, W. Wang, R. Pomraenke, M. Lammers, M. Maiuri, C. Manzoni, G. Cerullo, C. Lienau. Real-time observation of ultrafast Rabi oscillations between excitons and plasmons in metal nanostructures with J-aggregates. Nat. Photonics, 7, 128-132(2013).

    [16] D. Melnikau, R. Esteban, D. Savateeva, A. Sánchez-Iglesias, M. Grzelczak, M. K. Schmidt, L. M. Liz-Marzán, J. Aizpurua, Y. P. Rakovich. Rabi splitting in photoluminescence spectra of hybrid systems of gold nanorods and J-aggregates. J. Phys. Chem. Lett., 7, 354-362(2016).

    [17] A. J. Moilanen, T. K. Hakala, P. Törmä. Active control of surface plasmon−emitter strong coupling. ACS Photon., 5, 54-64(2018).

    [18] M. E. Kleemann, R. Chikkaraddy, E. M. Alexeev, D. Kos, C. Carnegie, W. Deacon, A. C. Pury, C. Große, B. Nijs, J. Mertens, A. I. Tartakovskii, J. J. Baumberg. Strong-coupling of WSe2 in ultra-compact plasmonic nanocavities at room temperature. Nat. Commun., 8, 1296(2017).

    [19] D. Zheng, S. Zhang, Q. Deng, M. Kang, P. Nordlander, H. Xu. Manipulating coherent plasmon-exciton interaction in a single silver nanorod on monolayer WSe2. Nano Lett., 17, 3809-3814(2017).

    [20] L. Liu, L. Y. M. Tobing, X. Yu, J. Tong, B. Qiang. Strong plasmon–exciton interactions on nanoantenna array–monolayer WS2 hybrid system. Adv. Opt. Mater., 8, 1901002(2019).

    [21] X. Yan, H. Wei. Strong plasmon–exciton coupling between lithographically defined single metal nanoparticles and monolayer WSe2. Nanoscale, 12, 9708-9716(2020).

    [22] M. Geisler, X. Cui, J. Wang, T. Rindzevicius, L. Gammelgaard, B. S. Jessen, P. A. D. Goncalves, F. Todisco, P. Bøggild, A. Boisen, M. Wubs, N. A. Mortensen, S. Xiao. Single-crystalline gold nanodisks on WS2 mono- and multilayers for strong coupling at room temperature. ACS Photon., 6, 994-1001(2019).

    [23] R. Chikkaraddy, B. Nijs, F. Benz, S. J. Barrow, O. A. Scherman, E. Rosta, A. Demetriadou, P. Fox, O. Hess, J. J. Baumberg. Single-molecule strong coupling at room temperature in plasmonic nanocavities. Nature, 535, 127-130(2016).

    [24] Y. Zhang, Q. S. Meng, L. Zhang, Y. Luo, Y. J. Yu, B. Yang, Y. Zhang, R. Esteban, J. Aizpurua, Y. Luo, J. K. Yang, Z. C. Dong, J. G. Hou. Sub-nanometre control of the coherent interaction between a single molecule and a plasmonic nanocavity. Nat. Commun., 8, 15225(2017).

    [25] H. Groß, J. M. Hamm, T. Tufarelli, O. Hess, B. Hecht. Near-field strong coupling of single quantum dots. Sci. Adv., 4, eaar4906(2018).

    [26] H. Leng, B. Szychowski, M. C. Daniel, M. Pelton. Strong coupling and induced transparency at room temperature with single quantum dots and gap plasmons. Nat. Commun., 9, 4012(2018).

    [27] P. Zeng, J. Cadusch, D. Chakraborty, T. A. Smith, A. Roberts, J. E. Sader, T. J. Davis. Photoinduced electron transfer in strong coupling regime: waveguide–plasmon polaritons. Nano Lett., 16, 2651-2656(2016).

    [28] Z. Xi, Y. Lu, W. Yu, P. Yao, P. Wang, H. Ming. Strong coupling between plasmonic Fabry-Pérot cavity mode and magnetic plasmon. Opt. Lett., 38, 1591-1593(2013).

    [29] C. Hägglund, G. Zeltzer, R. Ruiz, A. Wangperawong, K. Roelofs, S. F. Bent. Strong coupling of plasmon and nanocavity modes for dual band, near-perfect absorbers and ultrathin photovoltaics. ACS Photon., 3, 456-463(2016).

    [30] X. Shi, K. Ueno, T. Oshikiri, Q. Sun, K. Sasaki, H. Misawa. Enhanced water splitting under modal strong coupling conditions. Nat. Nanotechnol., 13, 953-958(2018).

    [31] Y. Chu, K. B. Crozier. Experimental study of the interaction between localized and propagating surface plasmons. Opt. Lett., 34, 244-246(2009).

    [32] C. Zhang, J. Fang, W. Yang, Q. Song, S. Xiao. Enhancing the magnetic resonance via strong coupling in optical metamaterials. Adv. Opt. Mater., 5, 1700469(2017).

    [33] H. Shan, Y. Yu, X. Wang, Y. Luo, S. Zu, B. Du, T. Han, B. Li, Y. Li, J. Wu, F. Lin, K. Shi, B. K. Tay, Z. Liu, X. Zhu, Z. Fang. Direct observation of ultrafast plasmonic hot electron transfer in the strong coupling regime. Light Sci. Appl., 8, 9(2019).

    [34] J. Yang, Q. Sun, K. Ueno, X. Shi, T. Oshikiri, H. Misawa, Q. Gong. Manipulation of the dephasing time by strong coupling between localized and propagating surface plasmon modes. Nat. Commun., 9, 4858(2018).

    [35] W. Ren, Y. Dai, H. Cai, H. Ding, N. Pan, X. Wang. Tailoring the coupling between localized and propagating surface plasmons: realizing Fano-like interference and high-performance sensor. Opt. Express, 21, 10251-10258(2013).

    [36] Y. Ji, C. Tang, N. Xie, J. Chen, P. Gu, C. Peng, B. Liu. High-performance metamaterial sensors based on strong coupling between surface plasmon polaritons and magnetic plasmon resonances. Results Phys., 14, 102397(2019).

    [37] T. Klar, M. Perner, S. Grosse, G. Plessen, W. Spirkl, J. Feldmann. Surface-plasmon resonances in single metallic nanoparticles. Phys. Rev. Lett., 80, 4249-4252(1998).

    [38] C. Sönnichsen, T. Wilk, G. Plessen, J. Feldmann, O. Wilson, P. Mulvaney. Drastic reduction of plasmon damping in gold nanorods. Phys. Rev. Lett., 88, 077402(2002).

    [39] Q. Sun, H. Yu, K. Ueno, A. Kubo, Y. Matsuo, H. Misawa. Dissecting the few-femtosecond dephasing time of dipole and quadrupole modes in gold nanoparticles using polarized photoemission electron microscopy. ACS Nano, 10, 3835-3842(2016).

    [40] T. Schwartz, J. A. Hutchison, C. Genet, T. W. Ebbesen. Reversible switching of ultrastrong light-molecule coupling. Phys. Rev. Lett., 106, 196405(2011).

    [41] C. F. Bohren, D. R. Huffman. Absorption and Scattering of Light by Small Particles(1983).

    [42] P. B. Johnson, R. W. Christy. Optical constants of the noble metals. Phys. Rev. B, 6, 4370-4379(1972).

    [43] C. Wu, A. Salandrino, X. Ni, X. Zhang. Electrodynamical light trapping using whispering-gallery resonances in hyperbolic cavities. Phys. Rev. X, 4, 021015(2014).

    [44] M. Wan, P. Gu, W. Liu, Z. Chen, Z. Wang. Low threhold spaser based on deep-subwavelength spherical hyperbolic metamaterial cavities. Appl. Phys. Lett., 110, 031103(2017).

    [45] J. J. Penninkhof, L. A. Sweatlock, A. Moroz, H. A. Atwater, A. van Blaaderen, A. Polman. Optical cavity modes in gold shell colloids. J. Appl. Phys., 103, 123105(2008).

    [46] D. E. Aspnes, A. A. Studna. Dielectric functions and optical parameters of Si, Ge, GaP, GaAs, GaSb, InP, InAs, and InSb from 1.5 to 6.0  eV. Phys. Rev. B, 27, 985-1009(1983).

    [47] D. E. Aspnes, S. M. Kelso, R. A. Logan, R. Bhat. Optical properties of AlxGa1-xAs. J. Appl. Phys., 60, 754-767(1986).

    [48] B. Ji, E. Giovanelli, B. Habert, P. Spinicelli, M. Nasilowski, X. Xu, N. Lequeux, J. P. Hugonin, F. Marquier, J. J. Greffet, B. Dubertret. Non-blinking quantum dot with a plasmonic nanoshell resonator. Nat. Nanotechnol., 10, 170-175(2015).

    [49] P. Senellart, G. Solomon, A. White. High-performance semiconductor quantum-dot single-photon sources. Nat. Nanotechnol., 12, 1026-1039(2017).

    Ping Gu, Jing Chen, Siyu Chen, Chun Yang, Zuxing Zhang, Wei Du, Zhengdong Yan, Chaojun Tang, Zhuo Chen. Ultralarge Rabi splitting and broadband strong coupling in a spherical hyperbolic metamaterial cavity[J]. Photonics Research, 2021, 9(5): 829
    Download Citation