
Hongwei Guo, Shuo Xing. Progress in self-correcting methods of projector nonlinearity for fringe projection profilometry[J]. Infrared and Laser Engineering, 2020, 49(3): 0303009
- Infrared and Laser Engineering
- Vol. 49, Issue 3, 0303009 (2020)
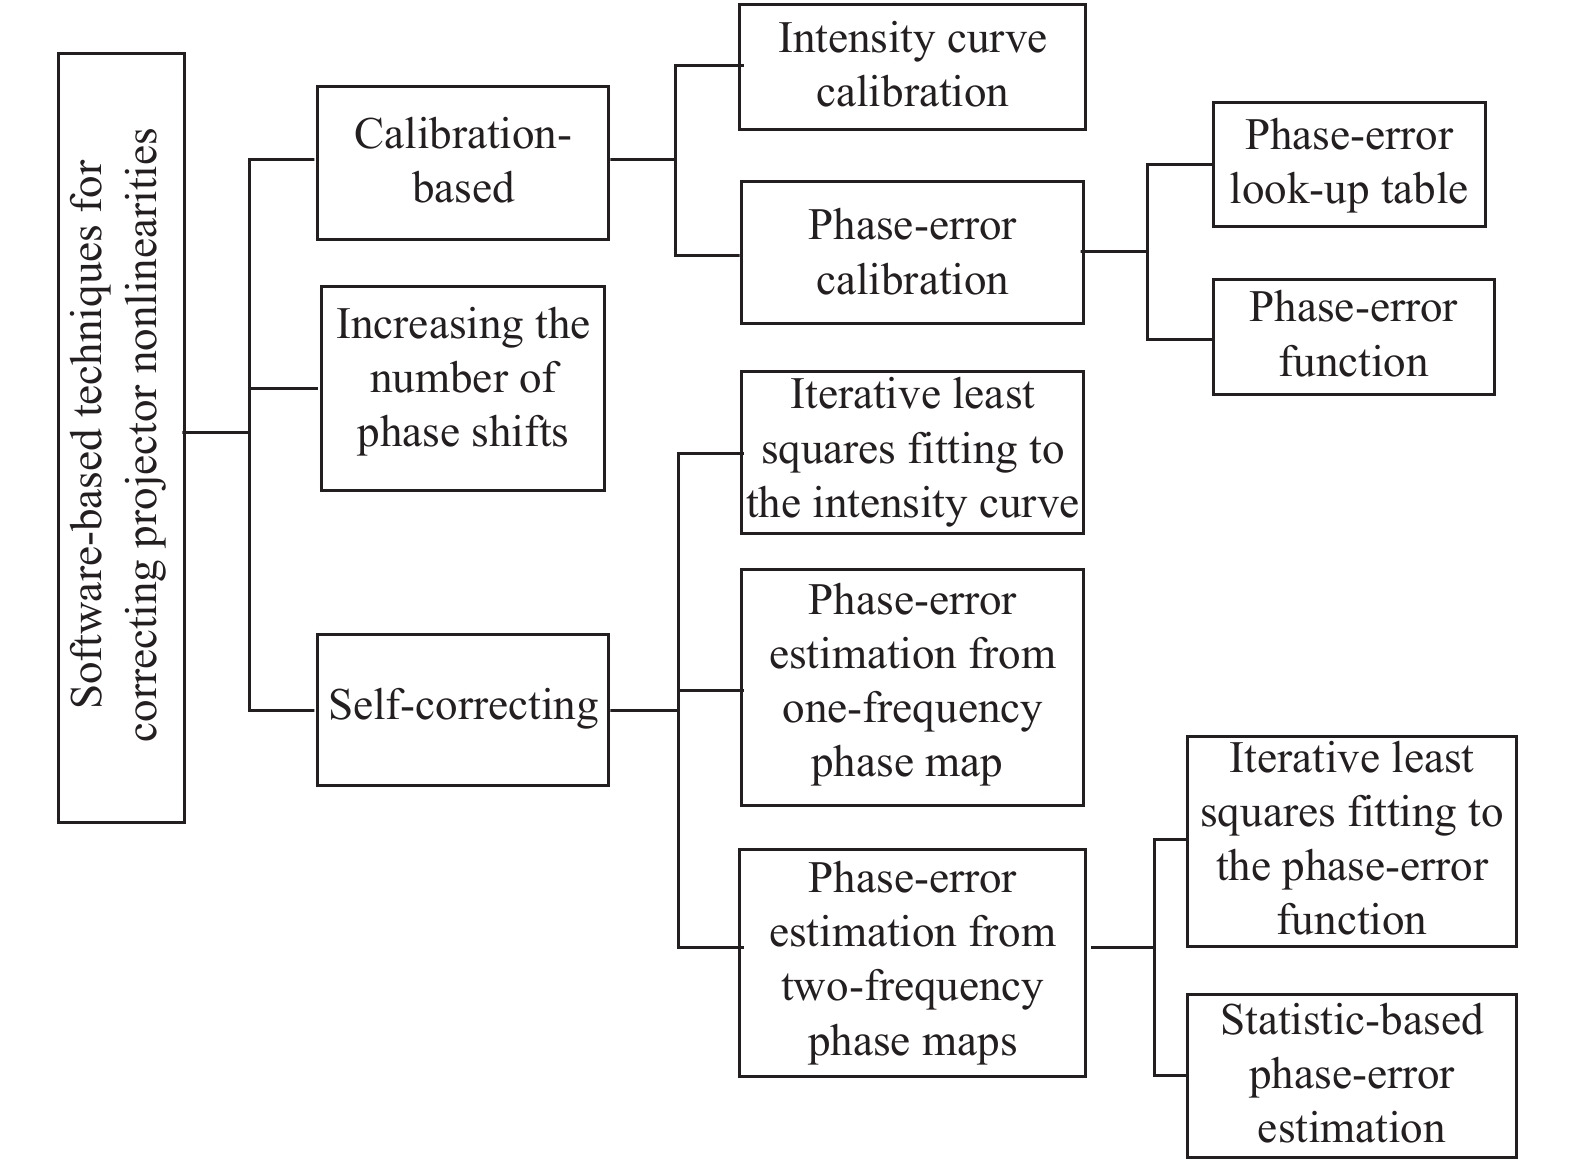
Fig. 1. Software-based methods for correcting projector nonlinearities error
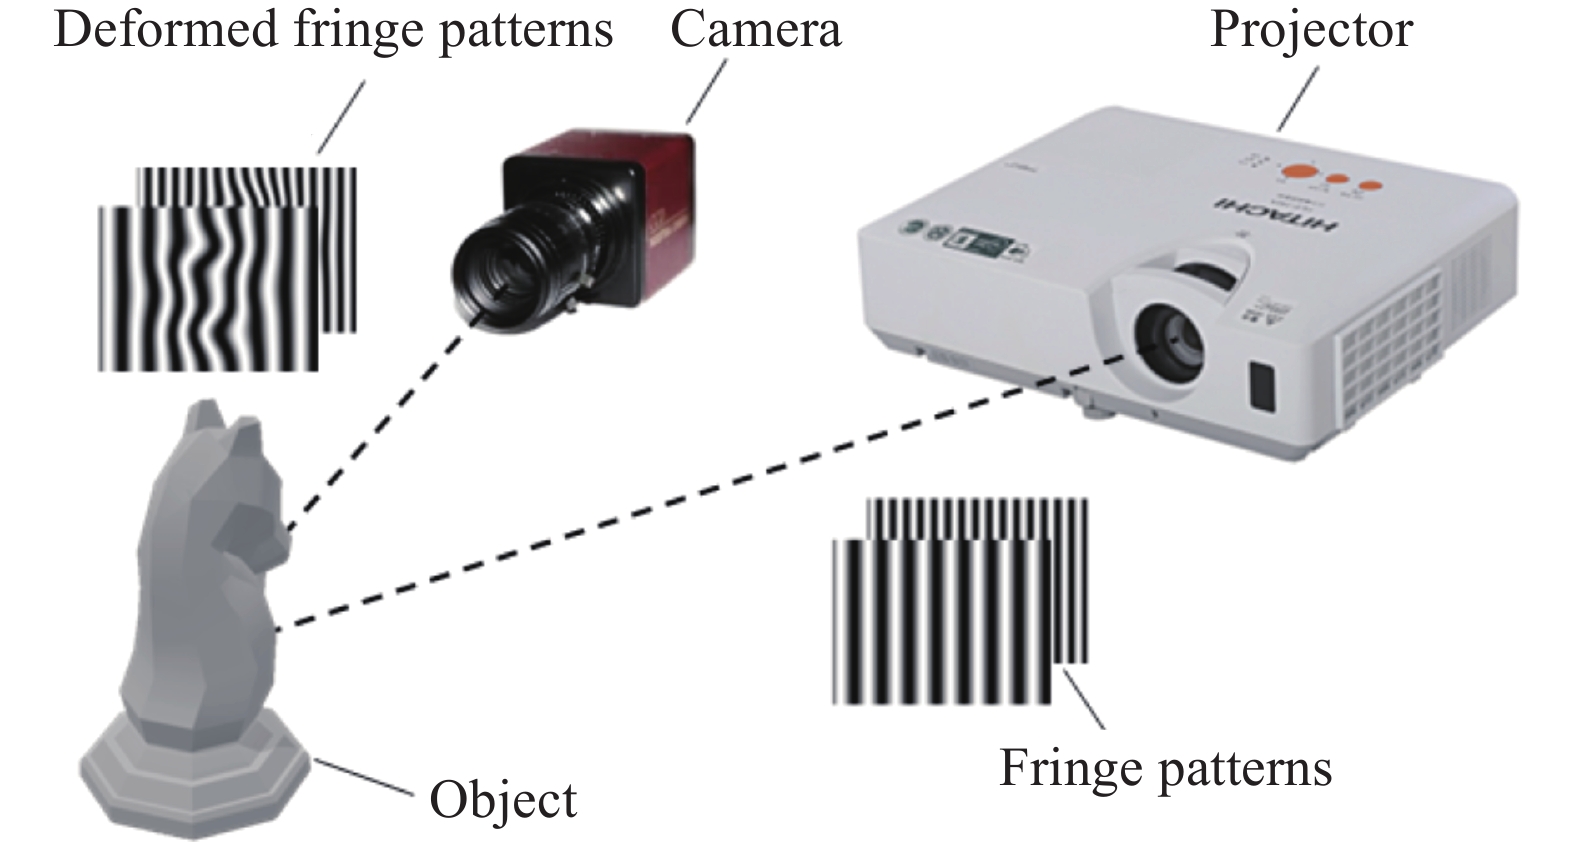
Fig. 2. Measurement system of fringe projection
Fig. 3. Effect of projector nonlinearity on the phase measuring results.(a) Simulated phase curve; (b) Simulated phases with a carrier added; (c) Nonlinearity curve of projector; (d) A phase-shifting intensity curve; (e) Measured phases without carrier;(f) Phase errors
Fig. 4. (a) Calculated background intensities (dotted curve) and modulations (solid curve); (b) Normalized intensity curve
Fig. 5. Self-correcting method based on iterative intensity curve fitting. (a) Smoothed phase curve ; (b) Phase difference before and after filtering; (c) Cosine of the smoothed phases; (d) Dependence between the normalized intensities and the cosine of smoothed phases; (e) Polynomial fitting to the clustering points in (d); (f) Corrected phases
Fig. 6. Recognizing and removing the projector nonlinearity from a single phase map. (a) Wrapped smoothed phases; (b) Dependence of phase errors on phases; (c) Iterative fitting result of phase error function; (d) Corrected phases
Fig. 7. Correction of the projector nonlinearity from two-frequency phase maps. (a) Low frequency fringe; (b) Measured low frequency fringe phases; (c) High frequency fringe; (d) Measured high frequency fringe phases; (e) Phase errors in Fig.(b) (dotted) and Fig.(d) (solid); (f) Corrected phases
Fig. 8. (a) A fringe pattern; (b)Unwrapped phase map without carrier
Fig. 9. Depth maps of different correcting methods for projector nonlinearities. (a) Projector nonlinearity not corrected; (b) Photometric calibration;(c) Self-correcting methods based on iterative fitting of intensity curve[41]; (d) Phase error estimation from a single phase map[42]; (e) Self-correcting method based on statistics[45]; (f) Iterative least squares fitting method based on two-frequency phase maps[44]
Fig. 10. Comparison among different compensating methods with the methods in (a)-(f) corresponding to those in Fig. 9(a)-(f)
|
Table 1. Performance comparisons of projector nonlinearity correcting methods

Set citation alerts for the article
Please enter your email address
© Copyright 2018-2021 | Chinese Laser Press. All Rights Reserved 沪ICP备15018463号-20