
Shuolin Wang, Yidong Shan, Dahuai Zheng, Shiguo Liu, Fang Bo, Hongde Liu, Yongfa Kong, Jingjun Xu. The real-time dynamic holographic display of LN:Bi,Mg crystals and defect-related electron mobility[J]. Opto-Electronic Advances, 2022, 5(12): 210135
- Opto-Electronic Advances
- Vol. 5, Issue 12, 210135 (2022)
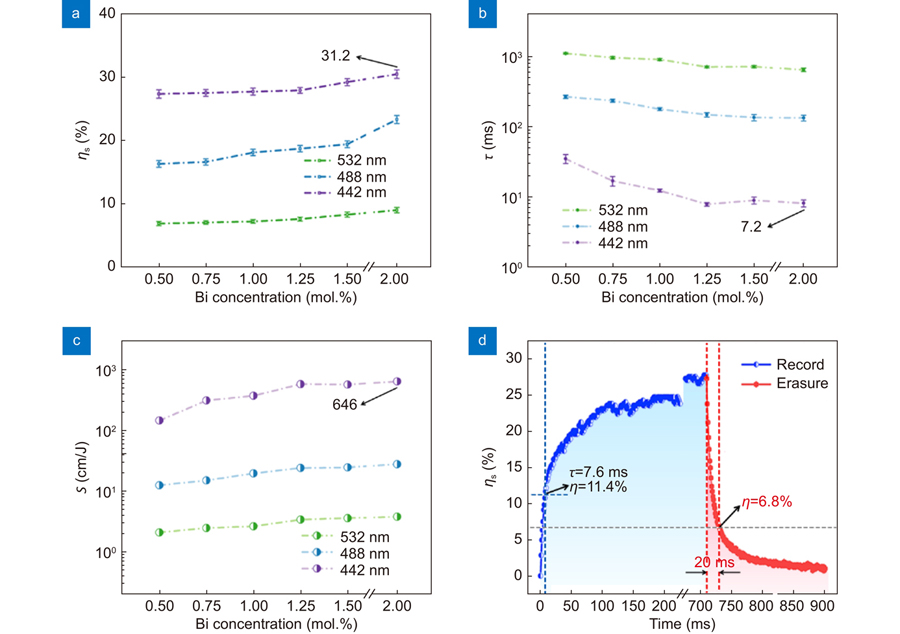
Fig. 1. (a ) Saturated diffraction efficiency, (b ) response time, and (c ) PR sensitivity of LN:Bia,Mg6.0 crystals as a function of Bi concentrations at 532 nm, 488 nm, and 442 nm, respectively. See Supplementary information for data details. (d ) The recording-erasing process of LN:Bi1.25,Mg6.0 crystal.
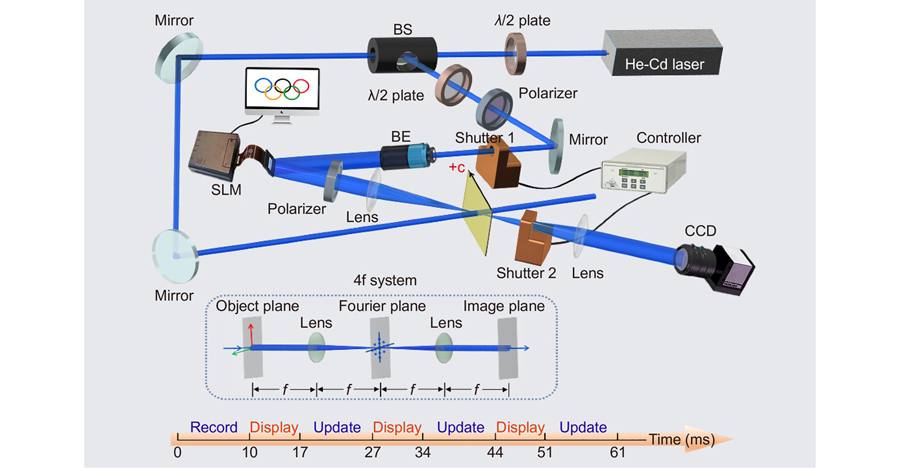
Fig. 2. Optical setup for a real-time holographic display. A He-Cd laser wave-length of 442 nm is used. A Glan-Taylor Polarizer acts as a beam splitter (BS). The diameter of the beam is adjusted appropriately by the beam expander (BE). The video animations are loaded by a spatial light modulation (SLM) on the signal beam. A controller is used to control the opening and closing process of shutters. A CCD is used to capture the holographic images. The insert shows a 4f system that performs a Fourier transform followed by an inverse Fourier transform to improve image quality. Schematic diagram of the timeline in the record-display-update process.
Fig. 3. Holographic images during the display (at 60 Hz). I. rhythmic gymnastics. II. karate kumite. III. diving. IV. baseball. V. Olympic rings. VI. basketball. VII. athletics. VIII. shooting. IX. surfing. A multimedia video with continuous action and a refresh rate of 60 Hz is given in Supplementary information Video S2.
Fig. 4. UV-Vis absorption spectra of (a ) LN:Bia,Mg6.0, (b ) LN:Bi1.0,Mgb. Absorbance difference between (c ) LN:Bia,Mg6.0, (d ) LN:Bi1.0,Mgb, and LN:Bi crystals. The OH– absorption spectra of (e ) LN:Bia, Mg6.0 and (f ) LN:Bi1.0,Mgb crystals. All the OH– spectra shown in the figures have been normalized and spectra of CLN and LN:Bi are presented for comparison.
Fig. 5. (a ) Schematic diagram of the local structure model in LN:Bi,Mg when Mg exceeds the threshold. The blue, yellow, red, purple, and orange balls represent Li, Nb, O, BiNb, and MgLi/MgNb, respectively. (b ) Total unit cell energy versus lattice dilation and (c ) band energy of CBM versus lattice dilation. The red and blue lines are the fitting curves.
|
Table 0. Electron mobility of the most stable point defects and the defect cluster of LN:Bi and LN:Bi,Mg.
| ||||||||||||||||||||||||||||||||||||||||||||
Table 0. Saturated diffraction efficiency, response time and PR sensitivity of LN:Bi1.0,Mgb crystals as a function of Mg concentrations.

Set citation alerts for the article
Please enter your email address
© Copyright 2018-2021 | Chinese Laser Press. All Rights Reserved 沪ICP备15018463号-20