Abstract
Holographic display has attracted widespread interest because of its ability to show the complete information of the object and bring people an unprecedented sense of presence. The absence of ideal recording materials has hampered the realization of their commercial applications. Here we report that the response time of a bismuth and magnesium co-doped lithium niobate (LN:Bi,Mg) crystal is shortened to 7.2 ms and a sensitivity as high as 646 cm/J. The crystal was used to demonstrate a real-time holographic display with a refresh rate of 60 Hz, as that of the popular high-definition television. Moreover, the first-principles calculations indicate that the electron mobility while Bi occupying Nb-site is significantly greater than that in Li-site, which directly induces the fast response of LN:Bi,Mg crystals when the concentration of Mg is above its doping threshold.Holographic display has attracted widespread interest because of its ability to show the complete information of the object and bring people an unprecedented sense of presence. The absence of ideal recording materials has hampered the realization of their commercial applications. Here we report that the response time of a bismuth and magnesium co-doped lithium niobate (LN:Bi,Mg) crystal is shortened to 7.2 ms and a sensitivity as high as 646 cm/J. The crystal was used to demonstrate a real-time holographic display with a refresh rate of 60 Hz, as that of the popular high-definition television. Moreover, the first-principles calculations indicate that the electron mobility while Bi occupying Nb-site is significantly greater than that in Li-site, which directly induces the fast response of LN:Bi,Mg crystals when the concentration of Mg is above its doping threshold.Introduction
Holographic displays can show the real information of object completely and has been considered as an ideal and ultimate 3D visualization technology1-3. Now static holographic 3D display has made a great progress, but dynamic holographic 3D display technology is still not mature. In recent years, real-time dynamic holographic 3D display has attracted great attention because of its broad application prospect and important strategic significance in national defense military, telemedicine, entertainment and advertising4. Due to the large amount of calculation in computer-generated holography (CGH), it is still difficult to realize dynamic holographic display5, 6. Optical holographic display based on photorefractive (PR) holographic materials is one of the effective approaches to realize real-time dynamic holographic 3D display. Peyghambarian et al.7, 8 successively realized a monochrome holographic 3D display with a refresh time of 3.0 minutes and then 2.0 seconds based on a PR organic polymer. Su et al.9 brought out a refresh rate of 10 Hz based on quantum dot-doped liquid crystals. Chen et al.10 achieved a dynamic holographic 3D display with a refresh rate of 20 frames per second based on a phase plate and a liquid crystal. Although, organic polymer films and liquid crystals are popular materials for holographic display, there are still several problems such as the refresh frame rate less than 25 Hz (that is, the minimum requirement for real-time dynamic display refresh frame rate), low glass transition temperature, easy aging, PR effect required an external high voltage11-13. In contrast, inorganic PR crystals have good temperature and chemical stability, high diffractive efficiency and do not need to be applied with high voltage, but its refresh rate is much lower than that of organic polymer.
Lithium niobate (LiNbO3, LN) is a kind of multi-functional ferroelectric crystal (Tc ~ 1150 °C) that combines electro-optic (EO), acousto-optic (AO), piezoelectric, pyroelectric, and nonlinear optics effects14-18. Based on its attractive properties, LN has played a prominent role in many recent technological achievements, such as nonlinear resonators19, modulators20, 21, permanent holographic recording equipment22, and integrated optics on-chip23, 24. As a classic inorganic PR material, LN crystal has stable physical and chemical properties, but the slow response rate limits its application in holographic display25-29. Recently, Zheng et al.30 reported that the response time of a bismuth (Bi) and Magnesium (Mg) co-doped LN (LN:Bi1.0,Mg6.0) was shortened to 13 ms and a dynamic display was realized with a refresh rate of 30 Hz. As a preliminary requirement for dynamic display, a refresh frequency of 30 Hz can meet the needs of human eyes for viewing comfort. But now we have entered the era of high-definition display. A higher refresh frequency can not only reduce the flicker of the screen and reduce the visual fatigue of the eyes, but also make the display more stable and smoothly, to obtain a better viewing experience. Meanwhile, the mechanism of such fast response rate of LN:Bi1.0,Mg6.0 crystal is still not clear. Zhao. et al.31 demonstrated that the lone-pair electron effect of Bi greatly influences the structural distortion of LN in theoretical calculations. The strongly polarized localization of Bi 6s2 lone-pair electrons causes a large local lattice relaxation and the huge energy gain. In a previous work, we proposed a binary-electron PR center model based on the lone-pair electrons of Bi3+ ions and found that lone-pair electron effect of Bi is pronounced when Bi3+ ions occupy Nb sites, forming the most highly efficient PR centers32. However, there is still lacking of exact theoretical support.
As reported, the LN:Bi1.0,Mg6.0 crystal exhibits excellent PR properties30. In order to find a LN crystal with much faster response, and understand the role of Bi and Mg ions in the PR enhancement, series of bismuth and magnesium co-doped lithium niobate crystals with adjusting Bi or Mg concentration were designed and grown. The PR properties of as-grown crystals were measured. A real-time holographic display with a refresh rate of 60 Hz was realized. The ultraviolet-visible (UV-Vis) spectra and OH– spectra of as-grown crystals were tested to analyze the site occupancy of defects. The first-principles calculations indicated the great difference in electron mobility of LN:Bi,Mg crystals with various sites occupancy of Bi ions.
Experimental and computational details
Experimental methods
Congruent LN (CLN) crystals co-doped with 6.0 mol.% Mg and serial concentrations (0.5, 0.75, 1.0, 1.25, 1.5 and 2.0 mol.%) of Bi; 1.0 mol.% Bi and serial concentrations (5.5, 6.0 and 6.5 mol.%) of Mg were grown along the z-axis by the Czochralski (CZ) method25. The composition of CLN was selected as [Li]/[Nb]=48.6/51.4. These crystals were labeled LN:Bia,Mg6.0 (a=0.5, 0.75, 1.25, 1.5, and 2.0) and LN:Bi1.0,Mgb (b=5.5, 6.0, and 6.5), respectively. The as-grown crystals were about 40 mm along the z-axis with a diameter of 30 mm. All crystals were annealed and polarized at 1210 °C in room atmosphere, and a current of 50 mA was given to the crystals for 1 h after the temperature had been keeping at 1210 °C for 24 h. Then, 3.0 mm- and 1.0 mm-thick y-oriented plates were cut and polished to optical grade for subsequent measurements.
Computational details
All the calculations in this work are done using the Vienna Ab initio Simulation Package (VASP)33 with the generalized gradient approximation (GGA) for the exchange-correlation energies and spin-restricted calculations are performed using the projector augmented wave method with the Perdew−Burke−Ernzerhof functional (PAW−PBE). The cut-off energy for planewave basis set is 400 eV. The allowed error in energy from relaxation is 1×10⁻⁵ eV. A 2×2×1 supercell of 120 atoms is used in the calculations. The K-mesh is chosen as 4 × 4 × 4, which is fine enough to give a reasonable result.
Results and discussion
Two-wave coupling method was used to characterize the PR properties of LN:Bi,Mg crystals. We selected three laser wavelengths, 532 nm from a continuous wave (CW) frequency-doubled solid-state laser and 488 nm from an Ar+ laser, and 442 nm from a He-Cd laser for the measurements.
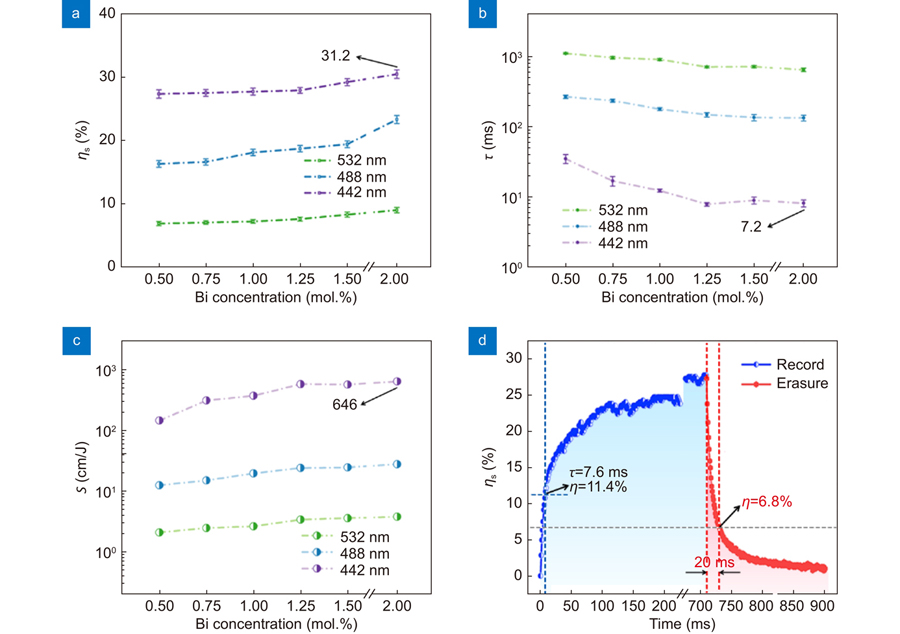
Figure 1 shows the saturated diffraction efficiency (ηs), response time (τ), and sensitivity (S) of LN:Bia,Mg6.0 (a = 0.5, 0.75, 1.0, 1.25, 1.5, and 2.0) crystals with various Bi concentrations at 532 nm, 488 nm and 442 nm, respectively. As shown in Fig. 1(a), the ηs increases with the increase of Bi doping concentration. Especially when Bi doping concentration exceeds 1.25 mol.%, the ηs is improved more obviously. The ηs of LN:Bi2.0,Mg6.0 crystal reaches the maximum at 31.2% at 442 nm. In Fig. 1(b), the τ of the crystals decreases with the increase of Bi concentration. When Bi concentration exceeds 1.25 mol.%, the τ has been further shortened to less than 10 ms, which is 7.6 ms, 7.9 ms and 7.2 ms at 442 nm, respectively. Figure 1(c) shows the PR sensitivities of LN:Bi2.0,Mg6.0 crystal reaches the maximum at 3.76 cm/J, 27.8 cm/J and 646 cm/J, respectively. The recording-erasing process of LN:Bi1.25,Mg6.0 crystal with the ηs as a function of time is shown in Fig. 1(d). A PR response time of 7.6 ms with a real time diffraction efficiency of 11.4% are obtained, as indicated on the left side of Fig. 1(d). The PR efficiency can be erased to a low level within 20 ms, as marked on the right side of Fig. 1(d). This result shows that the crystal is an excellent candidate material for dynamic display.

Figure 1.(a) Saturated diffraction efficiency, (b) response time, and (c) PR sensitivity of LN:Bia,Mg6.0 crystals as a function of Bi concentrations at 532 nm, 488 nm, and 442 nm, respectively. See Supplementary information for data details. (d) The recording-erasing process of LN:Bi1.25,Mg6.0 crystal.
Table Infomation Is Not EnableTable Infomation Is Not Enable
Table 1 shows the ηs, τ, and S of LN:Bi1.0,Mgb crystals with various Mg concentrations (b = 5.5, 6.0, and 6.5) at 532 nm, 488 nm and 442 nm, respectively. These PR properties of the LN:Bi1.0,Mgb crystals is basically stable in a certain range, with the change of Mg concentration at different wavelengths. Compared with the PR performance of LN:Bi1.0,Mg6.0 crystal, the ηs of LN:Bi1.0,Mgb crystals is slightly reduced, the τ is stable at the same order, and the difference in S is minor, at three wavelengths.
The above results show that Bi dopants concentration can further promote the PR properties of LN crystals more effectively compared with Mg dopants concentration. Specifically, the τ of LN:Bi2.0,Mg6.0 crystal shortened to 7.2 ms, with a sensitivity about 646 cm/J, these are nearly twice as good as that of the famous LN:Bi,Mg6.0 crystal30.
Based on the excellent PR properties of the aforementioned LN:Bi1.25,Mg6.0 crystal, a dynamic holographic display with a higher refresh frame rate is realized. Figure 2 shows the optical setup of the holography display based on two-wave coupling at 442 nm. A digital image of each video frame is transferred electronically from the personal computer to a spatial light modulator (SLM) light-emitting diode (LED) screen (1280 * 768 pixels). A 4f system was used to improve the image quality by performing a Fourier transform followed by an inverse Fourier transform.
Figure 2.Optical setup for a real-time holographic display. A He-Cd laser wave-length of 442 nm is used. A Glan-Taylor Polarizer acts as a beam splitter (BS). The diameter of the beam is adjusted appropriately by the beam expander (BE). The video animations are loaded by a spatial light modulation (SLM) on the signal beam. A controller is used to control the opening and closing process of shutters. A CCD is used to capture the holographic images. The insert shows a 4f system that performs a Fourier transform followed by an inverse Fourier transform to improve image quality. Schematic diagram of the timeline in the record-display-update process.
During the experimental process, each frame of the video was recorded for 10 ms. Turn off the signal beam, the hologram is subsequently displayed for 7 ms by the reference beam. Upon turning on the signal beam, the recorded holographic image is updated in the next 10 ms. While the last hologram will be completely erased during this 7 ms- display and next 10 ms-recording process. Display holographic images are received every 17 ms using a CCD, which reflects that the holograms can act as a real-time display at 60 Hz. Eight holograms of Olympic pictograms, including rhythmic gymnastics, karate kumite, diving, baseball, basketball, athletics, shooting and one hologram of Olympic rings are presented in Fig. 3(I–IX), demonstrating the realization of a dynamic holographic display with high resolution. The style of each pictogram is significantly different, which can prove that the crystal can refresh the image in 17 ms without crosstalk. A multimedia video with continuous action and a refresh rate of 60 Hz is given in Supplementary information Video S2.
Figure 3.Holographic images during the display (at 60 Hz). I. rhythmic gymnastics. II. karate kumite. III. diving. IV. baseball. V. Olympic rings. VI. basketball. VII. athletics. VIII. shooting. IX. surfing. A multimedia video with continuous action and a refresh rate of 60 Hz is given in Supplementary information Video S2.
The UV-Vis absorbance spectrum of an LN crystal is sensitive to the crystal’s defects energy levels34, 35. Based on our previous work, there would be an absorbance band from 320 nm to 420 nm when the Bi ions are introduced into the LN crystals28. Figure 4(a) and 4(b) show the UV-Vis absorption spectra of LN:Bia,Mg6.0 (a = 0.5, 0.75, 1.0, 1.25, 1.5, and 2.0) and LN:Bi1.0,Mgb (b = 5.5, 6.0, and 6.5) crystals, respectively. Compared with that of CLN and LN:Bi crystals, the spectra of LN:Bia,Mg6.0 and LN:Bi1.0,Mgb crystals have an absorbance band in the range of 320 nm–450 nm and 360 nm–450 nm, respectively. The absorption spectra reflect that Bi ions are introduced into the LN crystals, and there are differences with the change of Bi or Mg concentration. The absorbance difference between LN:Bia,Mg6.0 and LN:Bi crystals, and between LN:Bi1.0,Mgb and LN:Bi crystals are shown in Fig. 4(c) and 4(d) respectively. It can be found an absorbance band appears near 380 nm. The area of the absorbance band increases with the increase of Bi or Mg concentration. As reported the OH– stretching vibration is sensitive to changes in environment around ions, and it can be used to judge whether the co-doping concentration exceeds the threshold36. Figure 4(e) and 4(f) show that the OH– absorption peak of all LN:Bia,Mg6.0 and LN:Bi1.0,Mgb crystals is around 3535 cm–1, which is consistent with the doping threshold effect in Mg-doped LN crystals37. We infer that Mg concentrations are over the doping threshold in the co-doped LN crystals. Since the valence state of Bi is higher than that of Mg, Bi will occupy Nb site when Mg concentration exceeds the threshold. The occupation of LN:Bi,Mg is also confirmed by STEM in the literature32, and a deeper defect levels will emerge in the band gap when Bi occupies Nb site31. Therefore, the Fig. 4(c) and 4(d) indicate that the increase of Bi concentration will lead to the increase of the amount of
in the crystal, and the increase of Mg concentration will also promote the increase of
to a certain extent, thus leading to the increase of the absorbance band area near 380 nm.
Figure 4.UV-Vis absorption spectra of (a) LN:Bia,Mg6.0, (b) LN:Bi1.0,Mgb. Absorbance difference between (c) LN:Bia,Mg6.0, (d) LN:Bi1.0,Mgb, and LN:Bi crystals. The OH– absorption spectra of (e) LN:Bia, Mg6.0 and (f) LN:Bi1.0,Mgb crystals. All the OH– spectra shown in the figures have been normalized and spectra of CLN and LN:Bi are presented for comparison.
To explore the intrinsic reason for the difference of PR of LN:Bi,Mg crystals with various Bi and Mg concentrations. The PR process of the LN crystal includes the excitation, migration and capture of carriers, and finally forms a stable space charge field, which leads to the change of refractive index. As we known, there are three migration mechanisms of the photoexcited free carriers in PR process, including diffusion, drift and photovoltaic effect. It was reported that diffusion dominates the transport of charge carriers in LN:Bi,Mg28. The diffusion constant D equals to(μkBT)/e, here μ is the electron mobility, kB is Boltzmann's constant, T is temperature and e is charge of electrons. Therefore, the diffusion mainly depends on the electron mobility, then the effect of doping on the electron mobility in LNBi,Mg was studied. In LN majority of the carriers are electrons, and the migration direction of the photoexcited carrier is Z direction which is parallel to the direction of polarization. Hence, we qualitatively analyze the response rate of different doped LN by calculating its electron mobility in Z direction. According to the deformation potential (DP) theory proposed by Bardeen and Shockley38, the coherence length of thermally electrons at room temperature is close to the wavelength of phonons and much larger than the lattice length, the electron−acoustic phonon coupling dominates the scattering at low energy regime39, 40. On the basis of the effective mass, combining with DP theory, we can get the electron mobility formula of 3D material in the following form41:
where m* is the effective mass, T is the temperature.
is the 3D elastic constant, E is the total energy of the system,
is the cell volume at equilibrium,
is the lattice constant along direction of β.
is the DP constant, which denotes the shift of the band edges (conduction band minimum for electrons and valence band maximum for holes) induced by the strain. By fitting the total energy with respect to volume change, we change the lattice constant in the Z direction, and then fit the total energy of the system changing with volume to obtain
. Similarly, we fit the energy at conduction band minimum (CBM) as a function of the lattice constant, and then get the
.
Based on the above spectra results (Fig. 4), the occupancy model of LN:Bi,Mg crystals has been contributed. In Fig. 5(a), when the Mg concentration is over the doping threshold, Bi occupies Nb sites, and Mg simultaneously occupies both Li sites and Nb sites. The typical example, LN system with a defect cluster
, of the fitting of
and
are shown in the Fig. 5(b) and 5(c). The results turn out that the operation is feasible.
Table 2 shows the electron mobility of the most stable point defects and the defect cluster of LN:Bi and LN:Bi,Mg. Especially the two pairs of point defects that are considered to be PR centers in LN:Bi, i.e.
/
,
/
,32 and the defect cluster in LN:Bi,Mg crystal corresponding to Fig. 5(a). From
Table 2, we can see that both of the electron mobility of
is significantly greater than that of
. This indicates that the performance of PR centres
/
are better than that of
/
. In details, it can be seen that the electron mobility of
is significantly reduced, compared with the electron mobility of
/
. This means that if
/
concentration increases, the PR response of crystal will be longer. Combined with the spectra, the absorbance difference between LN:Bia,Mg6.0 crystals and LN:Bi crystal near 380 nm growing with the increase of Bi concentration, indicating that the amount of
in the crystal also increases, while the main defect cluster in the crystals is
. The calculation result presents that the defect cluster has a greater electron mobility, which directly leads to the best PR properties of LN:Bi2.0,Mg6.0 crystal.
Figure 5.(a) Schematic diagram of the local structure model in LN:Bi,Mg when Mg exceeds the threshold. The blue, yellow, red, purple, and orange balls represent Li, Nb, O, BiNb, and MgLi/MgNb, respectively. (b) Total unit cell energy versus lattice dilation and (c) band energy of CBM versus lattice dilation. The red and blue lines are the fitting curves.
Conclusions
In summary, we grew series of LN:Bia,Mg6.0 (a = 0.5, 0.75, 1.0, 1.25, 1.5, and 2.0) and LN:Bi1.0,Mgb (b = 5.5, 6.0, and 6.5) crystals, where LN:Bi2.0,Mg6.0 crystal presents a short response time of 7.2 ms, and a high PR sensitivity of 646 cm/J at 442 nm. We demonstrated a real-time dynamic holographic display in LN:Bi,Mg crystal with a refresh frequency of 60 Hz, which meets the demand of popular high-definition television. The first-principles simulation indicates that the electron mobility while Bi ions occupying Nb-site is significantly greater than that in Li-site, and it directly induces the rapid response of LN:Bi,Mg crystals as the concentration of Mg is above its doping threshold. Our results demonstrate LN:Bi,Mg crystal can be an ideal candidate material for real-time dynamic holographic 3D display, though great efforts are needed to promote its practical applications. And the defect-related electron mobility gives a method to design photorefractive materials with fast response speed.