• Acta Optica Sinica
  • Vol. 38, Issue 8, 0814002 (2018)
Zhiliang Yu1、**, Xiaoming Jiang2, Kairui Cao3、*, Song Li1、4, and Yan Wan1
Author Affiliations
  • 1 School of Astronautics, Harbin Institute of Technology, Heilongjiang, Harbin 150001, China
  • 2 Shanghai Electro-Mechanical Engineering Institute, Shanghai, 200233, China
  • 3 National Key Laboratory of Tunable Laser Technology, Harbin Institute of Technology, Heilongjiang, Harbin 150001, China
  • 4 Shenyang Institute of Automation, Chinese Academy of Sciences, Shenyang, Liaoning 110016, China
  • show less
    DOI: 10.3788/AOS201838.0814002 Cite this Article Set citation alerts
    Zhiliang Yu, Xiaoming Jiang, Kairui Cao, Song Li, Yan Wan. Hysteresis Characteristics of Steering Mirror Driven by Piezoelectric Actuator and Its Experimental Research[J]. Acta Optica Sinica, 2018, 38(8): 0814002 Copy Citation Text show less
    Hysteresis curves
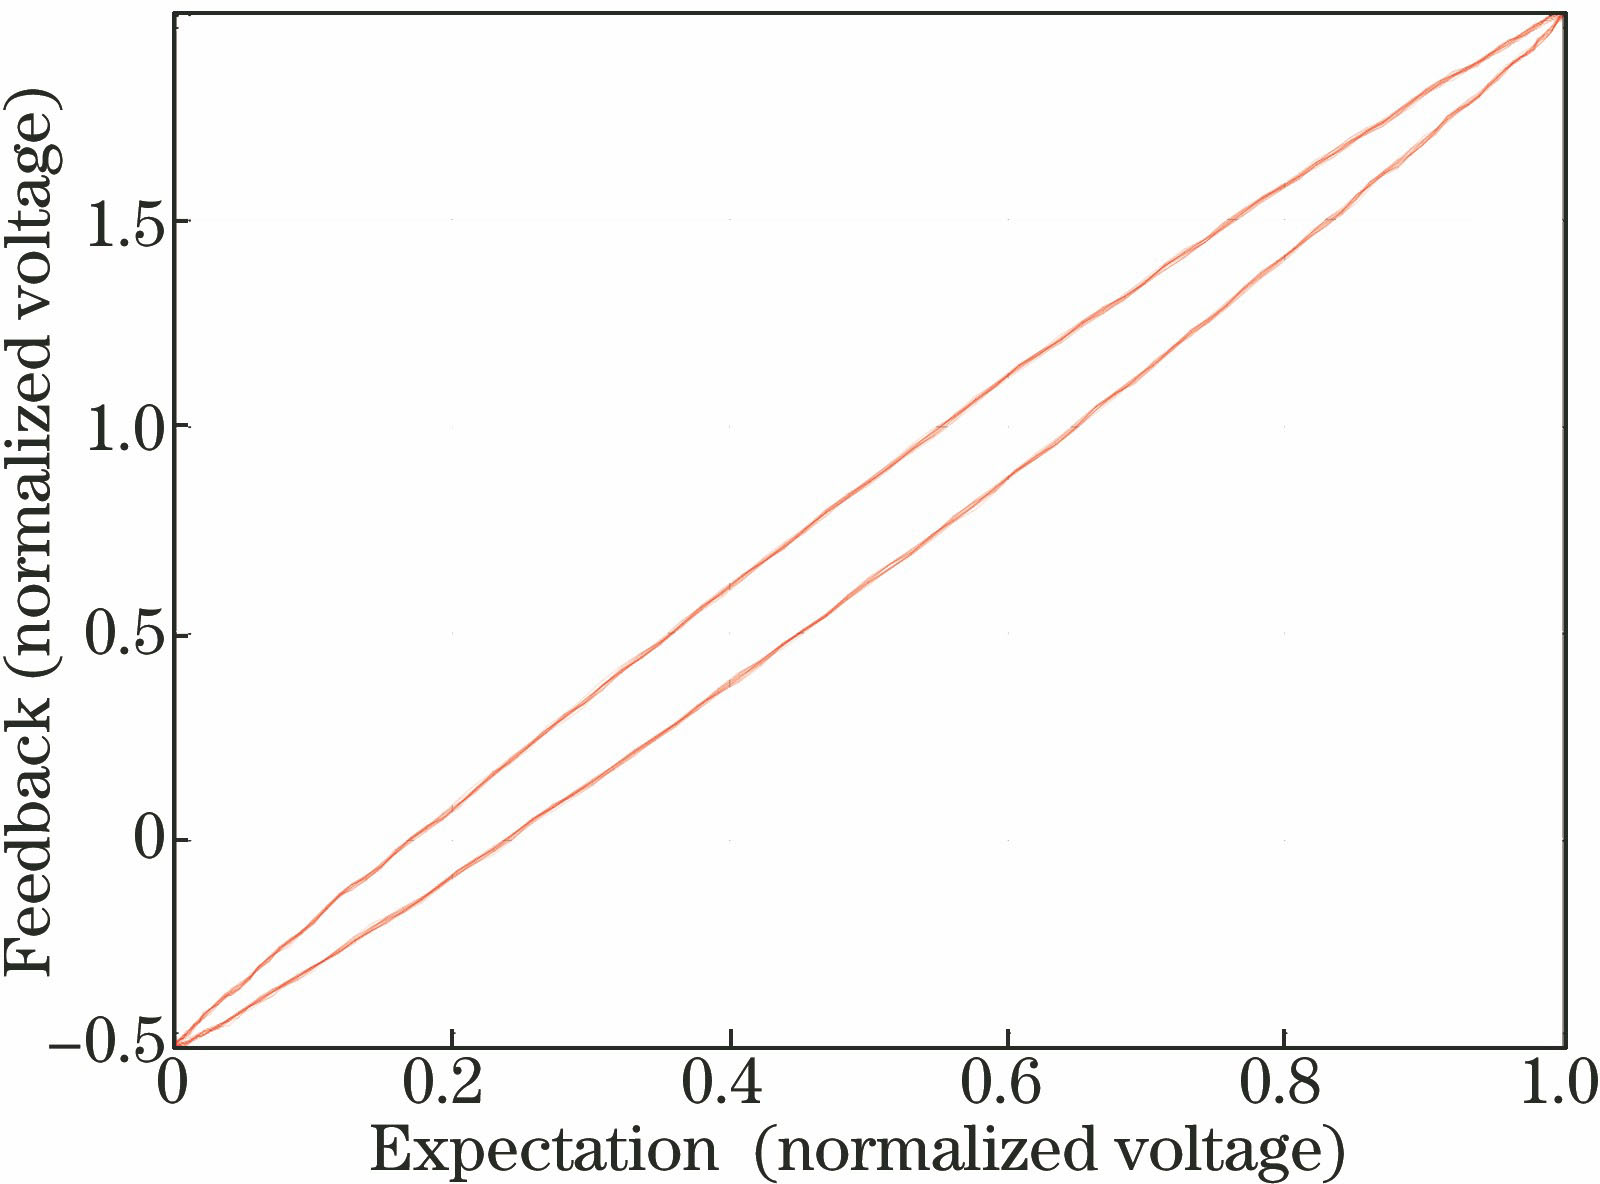
    Fig. 1. Hysteresis curves
    PEA experiment control system
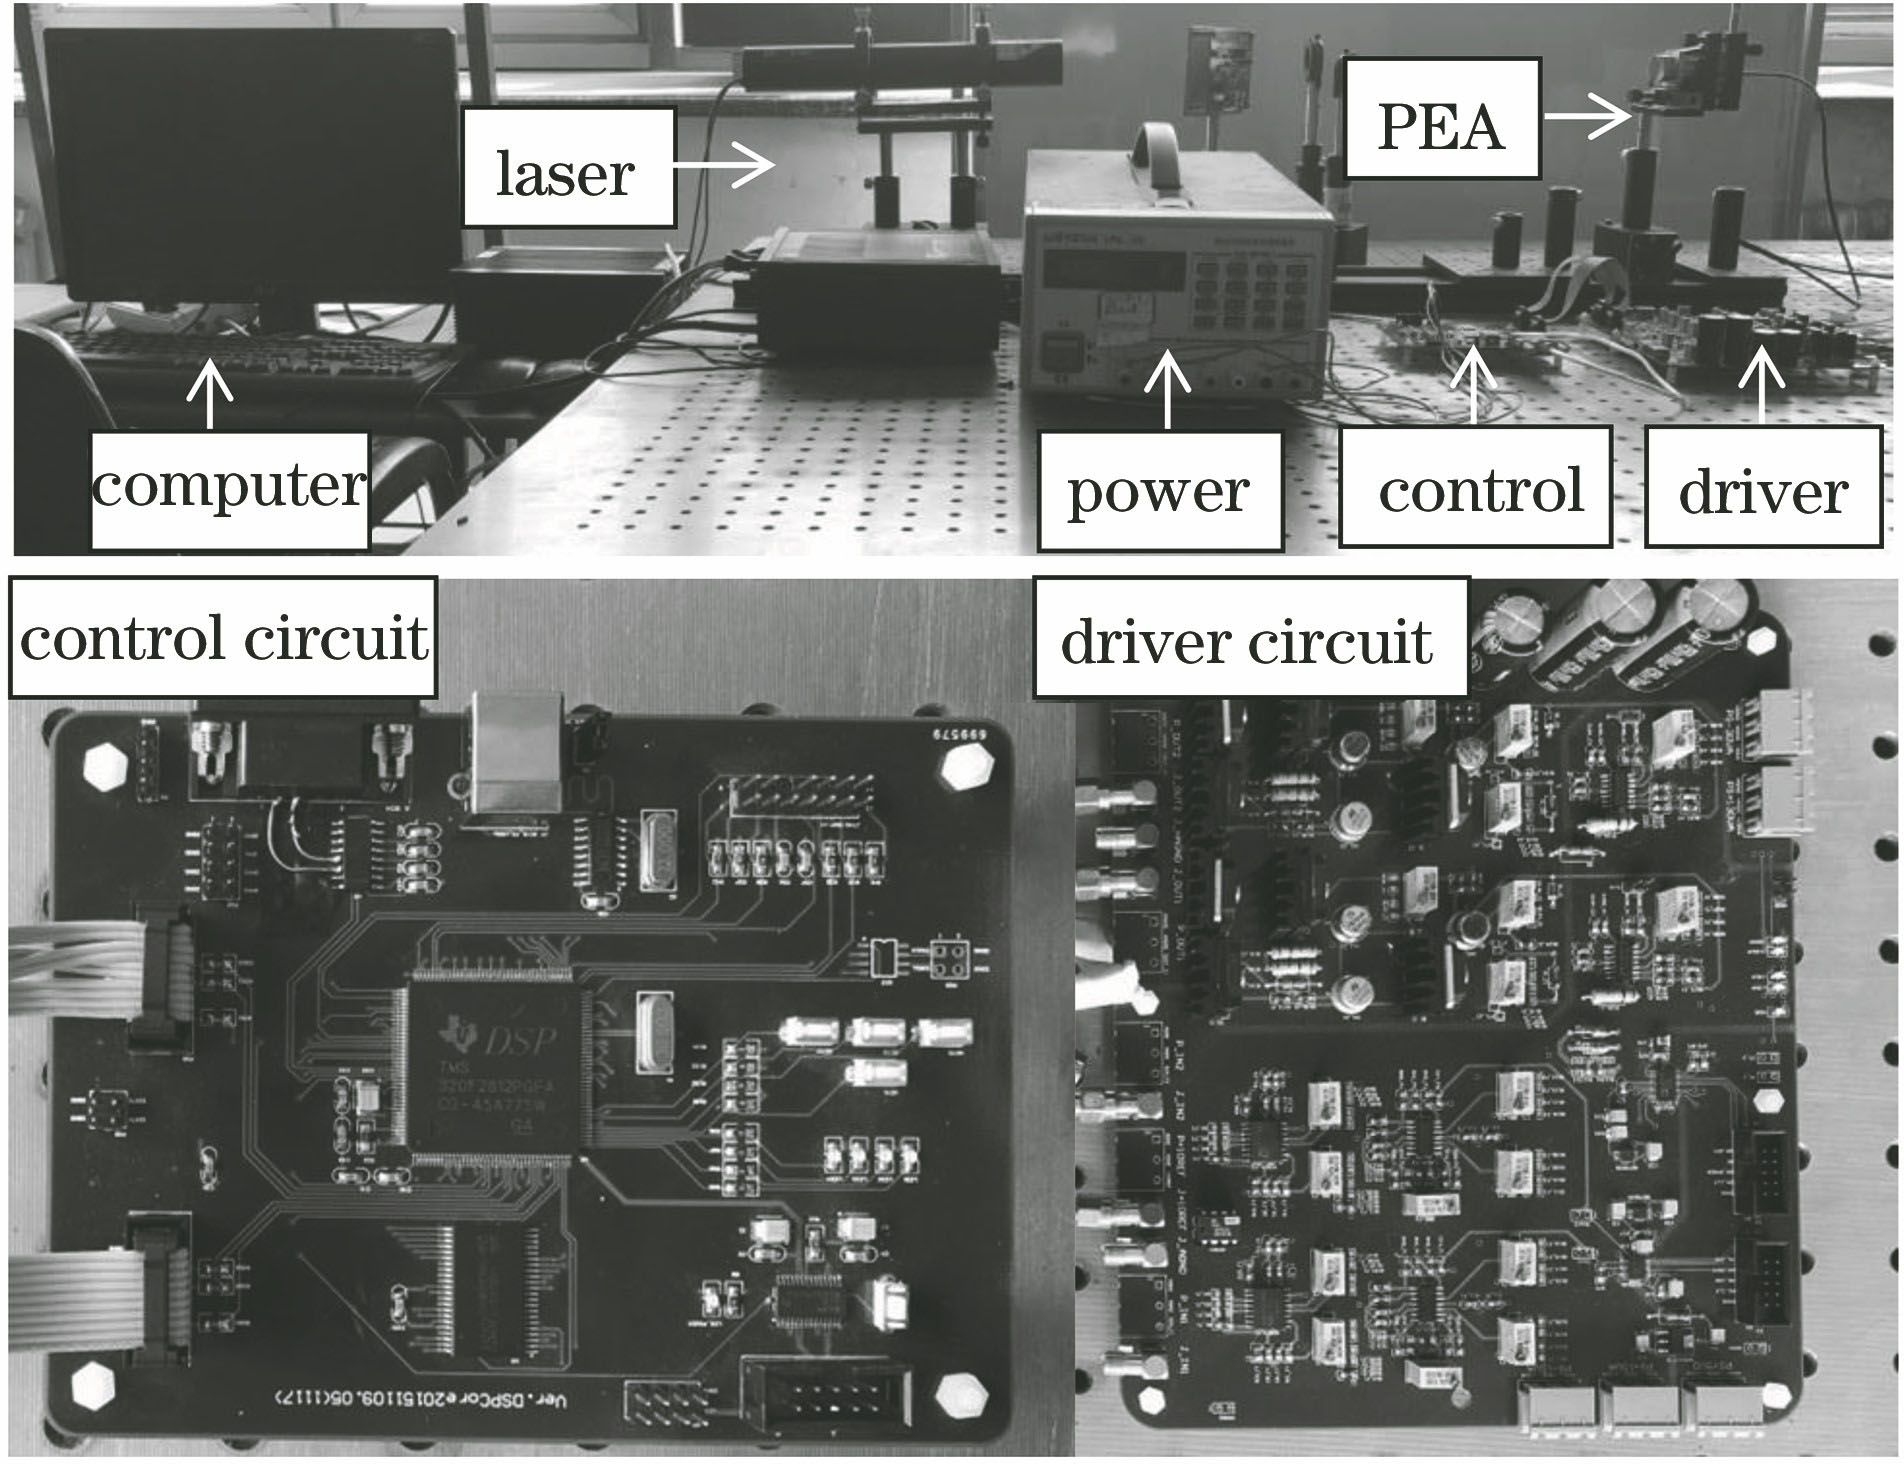
    Fig. 2. PEA experiment control system
    System validation
    Fig. 3. System validation
    100 Hz verification curve with the constant amplitude. (a) Physical system output (blue) and simulation model output (green); (b) output error of physical system and simulation model
    Fig. 4. 100 Hz verification curve with the constant amplitude. (a) Physical system output (blue) and simulation model output (green); (b) output error of physical system and simulation model
    100 Hz verification curve with decreasing amplitude. (a) Physical system output (blue) and simulation model output (green); (b) output error of physical system and simulation model
    Fig. 5. 100 Hz verification curve with decreasing amplitude. (a) Physical system output (blue) and simulation model output (green); (b) output error of physical system and simulation model
    Feedforward compensation
    Fig. 6. Feedforward compensation
    Verification curve with 50 Hz sine input and the constant amplitude. (a) Before and after compensation curves; (b) linear error before compensation; (c) linear error after compensation
    Fig. 7. Verification curve with 50 Hz sine input and the constant amplitude. (a) Before and after compensation curves; (b) linear error before compensation; (c) linear error after compensation
    Error of compound control method and no feedback control method under 10 Hz sine signal
    Fig. 8. Error of compound control method and no feedback control method under 10 Hz sine signal
    Frequency /HzUncompensated linearity/%Compensated linearity/%
    2(constant)4.810.808
    5(constant)4.900.870
    10(constant)4.960.886
    20(constant)4.970.911
    50(constant)5.020.967
    100(constant)5.040.985
    5(decreasing)4.580.818
    50(decreasing)4.661.160
    100(decreasing)4.831.230
    Table 1. Test linearity by sine input signal with different frequencies
    Frequency /HzFeedback controlsquare error /mVCompound controlsquare error /mV
    10(constant)12.42.4
    20(constant)23.12.7
    50(constant)57.37.1
    100(constant)120.024.0
    50(decreasing)36.05.0
    100(decreasing)77.017.0
    Table 2. Mean square error of feedback control and compound control with different frequencies
    Zhiliang Yu, Xiaoming Jiang, Kairui Cao, Song Li, Yan Wan. Hysteresis Characteristics of Steering Mirror Driven by Piezoelectric Actuator and Its Experimental Research[J]. Acta Optica Sinica, 2018, 38(8): 0814002
    Download Citation