Xiaoxiao Xue, Xiaoping Zheng, Bingkun Zhou, "Soliton regulation in microcavities induced by fundamental–second-harmonic mode coupling," Photonics Res. 6, 948 (2018)

Search by keywords or author
- Photonics Research
- Vol. 6, Issue 10, 948 (2018)

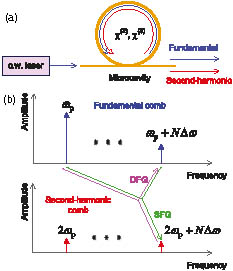
Fig. 1. (a) Scheme of Kerr comb generation in a microcavity with simultaneous χ ( 2 ) and χ ( 3 ) nonlinearities. (b) Illustration of mode coupling between the fundamental and second-harmonic waves through sum (SFG) and difference (DFG) frequency generation.

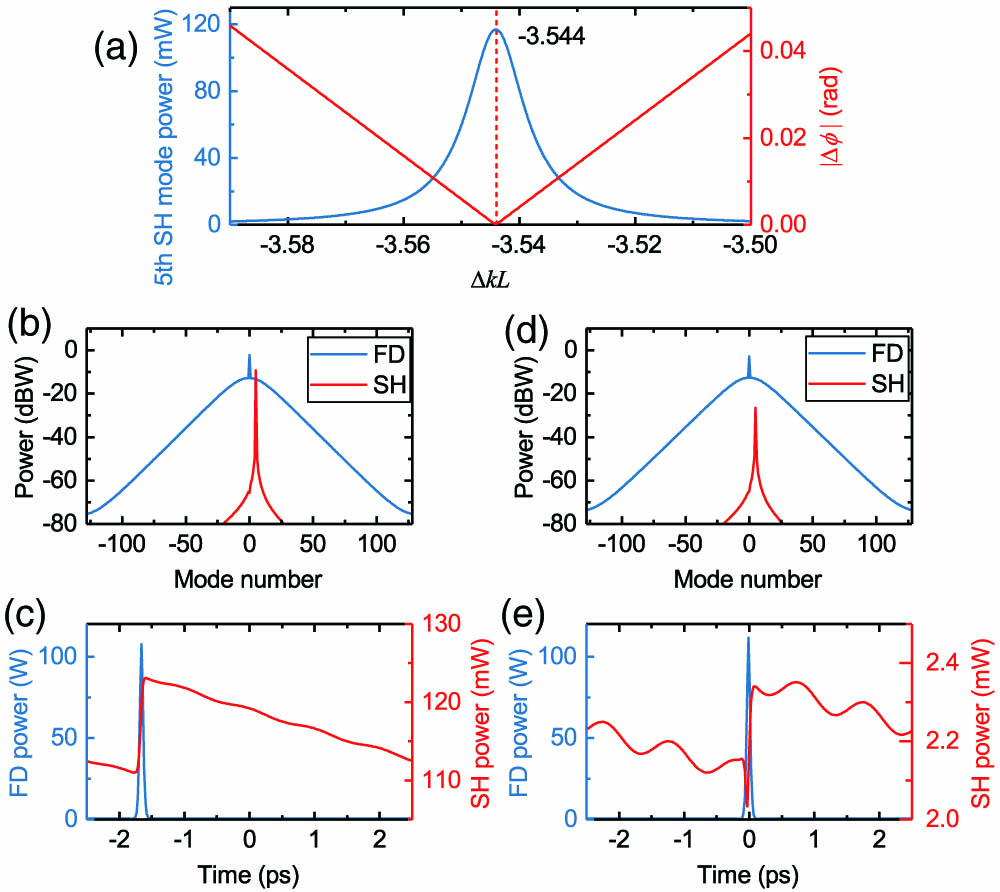
Fig. 2. (a) Fifth second-harmonic mode power and the absolute phase mismatch (| Δ ϕ | ) versus Δ k L . The vertical dash line indicates the calculated Δ k L for perfect phase matching. (b) Spectra and (c) waveforms of the fundamental (FD) and second-harmonic (SH) waves when Δ k L = − 3.544 (perfect phase matching). (d) Spectra and (e) waveforms when Δ k L = − 3.5 (not perfect phase matching).

Fig. 3. Soliton transitions in a cavity with only third-order Kerr nonlinearity (κ = 0 ). (a) Intracavity power versus pump detuning. 100 traces are overlaid. The number of traces corresponding to two, three, and four solitons is 21, 73, and 6, respectively. (b)–(d) Overlaid comb spectra for two, three, and four solitons.

Fig. 4. Deterministic single soliton formation assisted by FD-SH mode coupling when κ = 3 W − 1 / 2 · m − 1 and Δ k L = − 3.515 . (a) Intracavity fundamental power versus pump detuning. 100 traces are overlaid. The white dash line shows the absolute phase mismatch calculated according to Eq. (3 ). The full vertical scale corresponds to 0 − 0.1 rad . (b) Intracavity second-harmonic power versus pump detuning. (c) Spectra of the fundamental (FD) and second-harmonic (SH) waves when δ 0 = 0.025 . (d) Zoom-in spectra of the fundamental comb lines around the pump, showing weak amplitude and phase perturbations at the fifth mode (marked with a dashed circle). Circle (°): κ = 0 ; triangle (Δ ): κ = 3 W − 1 / 2 · m − 1 .

Fig. 5. Soliton binding due to FD-SH mode coupling when κ = 3 W − 1 / 2 · m − 1 and Δ k L = − 3.505 . (a) Intracavity fundamental power versus pump detuning. 100 traces are overlaid. The absolute phase mismatch calculated according to Eq. (3 ) is also plotted as in Fig. 4(a) . (b) Intracavity second-harmonic power versus pump detuning. (c) Overlaid spectra of the fundamental comb when δ 0 = 0.045 . Two patterns can be observed. (d) Time-domain waveforms of the two patterns, showing that the soliton is trapped by the oscillations induced by FD-SH mode coupling. The time offset is adjusted such that one soliton is aligned for the two patterns.

Fig. 6. Soliton prohibition caused by strong FD-SH mode coupling when κ = 6 W − 1 / 2 · m − 1 and Δ k L = − 3.515 . (a) Intracavity fundamental power versus pump detuning. 100 traces are overlaid. The absolute phase mismatch calculated according to Eq. (3 ) is also plotted as in Fig. 4(a) . (b) Intracavity second-harmonic power versus pump detuning.

Set citation alerts for the article
Please enter your email address