
Shu Pan, Li Wang, Yuanzheng Ma, Guangyu Zhang, Rui Liu, Tao Zhang, Kedi Xiong, Siyu Chen, Jian Zhang, Wende Li, Sihua Yang. Photoacoustic-enabled automatic vascular navigation: accurate and naked-eye real-time visualization of deep-seated vessels[J]. Advanced Photonics Nexus, 2023, 2(4): 046001
- Advanced Photonics Nexus
- Vol. 2, Issue 4, 046001 (2023)
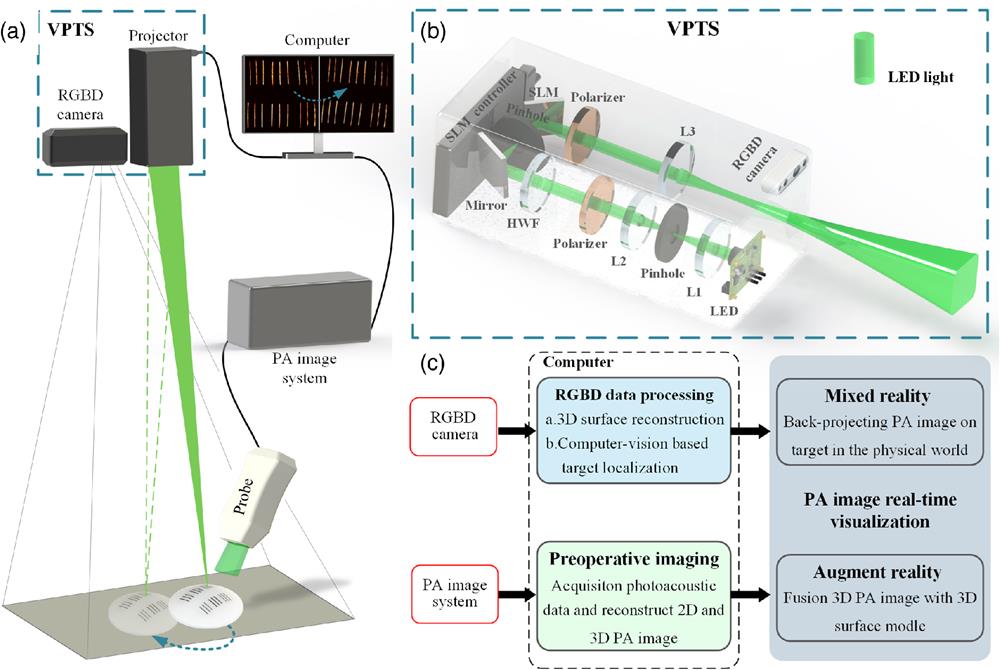
Fig. 1. (a) Schematic diagram of the experimental facility for photoacoustic-enabled automatic vascular navigation. The PA probe and the PA imaging system are used to image the target, the reconstructed image is accurately projected on the target surface in real time by the VPTS, and the RGBD camera locates and tracks the target in real time, so that the preoperative images can still be accurately reprojected on the target surface when the target moves. (b) Device diagram of the VPTS, including the light path of the projector and RGBD camera. L1, L2, and L3 are convex lenses. HWF is a half-wave plate. (c) System data flow diagram.
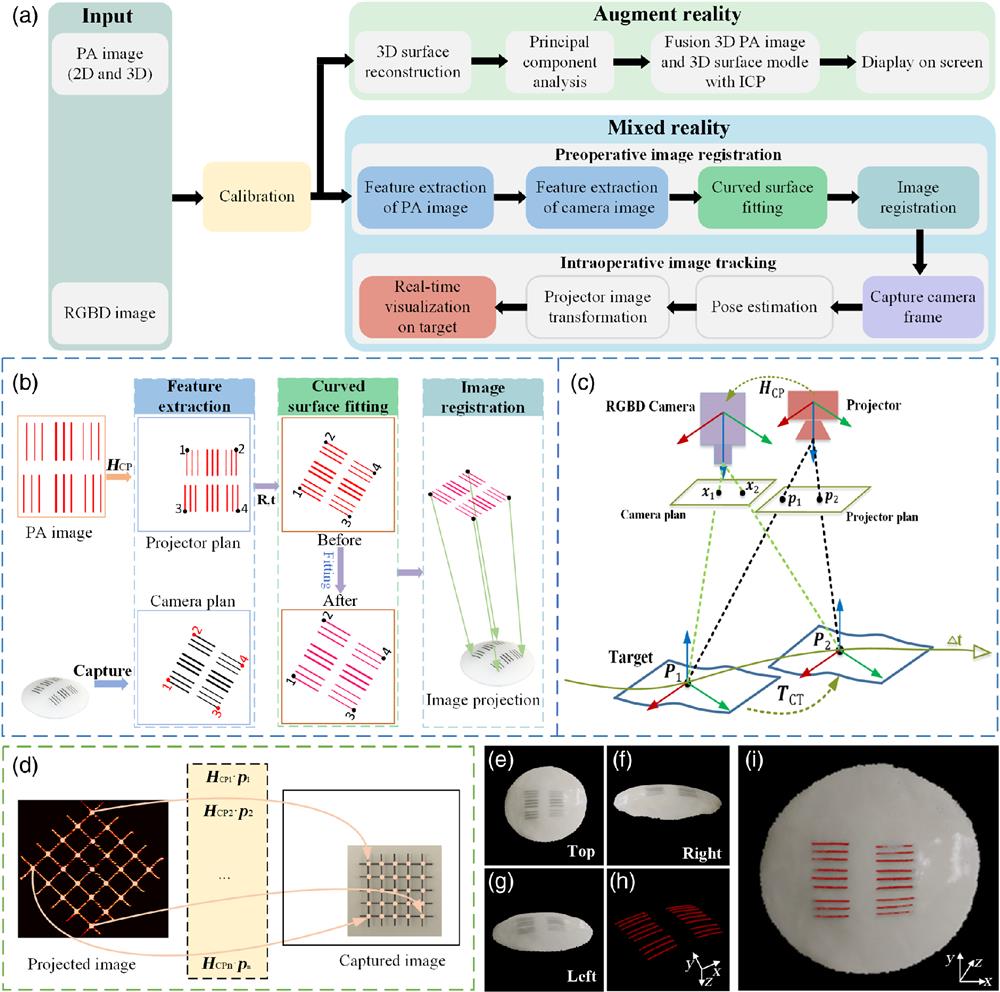
Fig. 2. (a) Flow chart of the system algorithm. (b) Detailed implementation steps of the preoperative image registration algorithm. (c) Schematic diagram of the implementation of the intraoperative image-tracking algorithm. (d) Schematic of the calibration of the camera and projector. (e)–(g) 3D surface models of the target reconstructed using computer vision. (h) 3D point cloud image of the 3D PA image. (i) Augmented-reality image after fusion of the 3D surface model and the 3D PA image.
Fig. 3. (a) PA image of the phantom. (b) Schematic diagram of 2D image projection on the 3D surface. A projection error will be caused by directly projecting a 2D image on the curved surface. Video 2 , MP4, 6.51 MB [URL: https://doi.org/10.1117/1.APN.2.4.046001.s2 ]).
Fig. 4. (a) Picture of a vascular-like network phantom composed of tungsten wires. (b) Corresponding 2D maximum amplitude projection PA image. (c1) A result that is not registered during preoperative image registration. (c2) A result after registration in the process of preoperative image registration. (d1) The reprojection result after moving 6 mm in the Video 1 , MP4, 8.70 MB [URL: https://doi.org/10.1117/1.APN.2.4.046001.s1 ]).
Fig. 5. (a) Photo of the rabbit thigh. The white dashed box area is selected for imaging, and P1 and P2 are randomly placed marks. (b) 2D PA vascular image corresponding to the dashed box in panel (a). (c) Tomography image corresponding to the white dashed line in panel (b). (d) and (e) Nonregistered and registered results during preoperative image registration. (f1)–(f3) Three results of vascular image reprojection after movement during intraoperative image tracking; the white dashed box in panel f3 is outside the projection area. (g) Mixed-reality effect on the rabbit thigh, deep blood vessels, and microvessels can be directly visualized on the surface. (h) Error statistics chart of the whole demonstration process based on the demonstration video of the rabbit thigh (Video 3 , MP4, 7.79 MB [URL: https://doi.org/10.1117/1.APN.2.4.046001.s3 ]). (i) Box plot of vascular localization accuracy obtained in rabbit thigh and human arm under two experimental conditions. The symbol *** indicates statistical significance of
Fig. 6. (a) Result of augmented reality after fusing the 3D surface model of the arm with the 3D PA vascular image. (b) Photo of the arm. ROI A was selected for PACT imaging; F1 and F2 were two randomly placed marks. (c) 3D PA vascular image corresponding to ROI A. (d)–(g) Visualization results of the augmented-reality model after rotation and scaling in ROI B marked by the red dashed box in panel (a) (Video 4 , MP4, 7.40 MB [URL: https://doi.org/10.1117/1.APN.2.4.046001.s4 ]; Video 5 , MP4, 12.2 MB [URL: https://doi.org/10.1117/1.APN.2.4.046001.s5 ]).
|
Table 1. Error statistics for current cases.

Set citation alerts for the article
Please enter your email address
© Copyright 2018-2021 | Chinese Laser Press. All Rights Reserved 沪ICP备15018463号-20