
Shu Pan, Li Wang, Yuanzheng Ma, Guangyu Zhang, Rui Liu, Tao Zhang, Kedi Xiong, Siyu Chen, Jian Zhang, Wende Li, Sihua Yang. Photoacoustic-enabled automatic vascular navigation: accurate and naked-eye real-time visualization of deep-seated vessels[J]. Advanced Photonics Nexus, 2023, 2(4): 046001
- Advanced Photonics Nexus
- Vol. 2, Issue 4, 046001 (2023)
Abstract
1 Introduction
Accurate localization of the vascular trajectory with preoperative image navigation is essential for vascular-related surgery, especially in cases where congenital abnormalities may accompany the anatomical position of blood vessels.1 Identifying these abnormalities through preoperative imaging and planning vascular surgery in advance can reduce the damage to blood vessels and surrounding tissues and avoid complications. For example, in the perforator flap transplantation process, high variability in the vascular anatomy is a major challenge. Therefore, preoperative planning is critical to rapidly and accurately finding perforators in an effort to minimize the sacrifice of muscle tissue around the perforators and enhance the efficiency of the surgery.2,3 As another example, in coronary intervention surgery, using the radial artery as the catheter entrance has the advantages of high success rate and few complications. As anatomical abnormalities of the radial artery will affect the success rate and operation time,4,5 locating and identifying anatomical abnormalities of the radial artery through preoperative images is vital. However, preoperative images are often presented on a 2D display screen; the combination of preoperative digital images and intraoperative patient surgical surface requires a high degree of physician experience, resulting in inefficient and unsafe image navigation.
With the development of augmented-reality and mixed-reality technology, a series of augmented-reality and mixed-reality devices have emerged to combine preoperative images with real surgical surfaces, greatly improving the efficiency of surgery and reducing surgical risks. For example, using the Microsoft HoloLens for perforator flap transplantation, computed tomography angiography (CTA)6,7 was used to image the complete vascular anatomy, and the HoloLens was used to combine the real surgical surface with CTA vascular images to accurately locate the perforators.8
Photoacoustic imaging (PAI)24
Based on the above, we propose a photoacoustic-enabled automatic vascular navigation method that combines PACT with augmented reality and mixed reality for noninvasive and accurate localization of blood vessels. In this navigation strategy, PACT was used to noninvasively reconstruct 2D and 3D vascular images. 3D surface reconstruction technology was used to reconstruct a 3D surface model of the surgical surface. With the assistance of 3D point cloud registration, the 3D vascular image and 3D surface model were fused to augment the interactivity between the 3D vascular image and surgical surface on the computer screen for vascular navigation. In addition, high-resolution 2D vascular images were modulated with a miniaturization-projector-based spatial light modulator (SLM). By means of a robot operation system-based visual localization and tracking technology, the 2D vascular images were precisely superimposed on the real surgical surface, enabling the deep vessels of the real surgical site to be visualized on the surgical surface in real time. Moreover, a curved surface fitting algorithm and a zero-mean normalization idea-based visual tracking algorithm were proposed to enhance the accuracy of vascular localization. This approach provides reliable assistance for locating blood vessels noninvasively and accurately by means of augmented reality and mixed reality, promising to improve the safety and success rate of vascular operations.
2 Structure and Method
2.1 Photoacoustic-Enabled Automatic Vascular Navigation
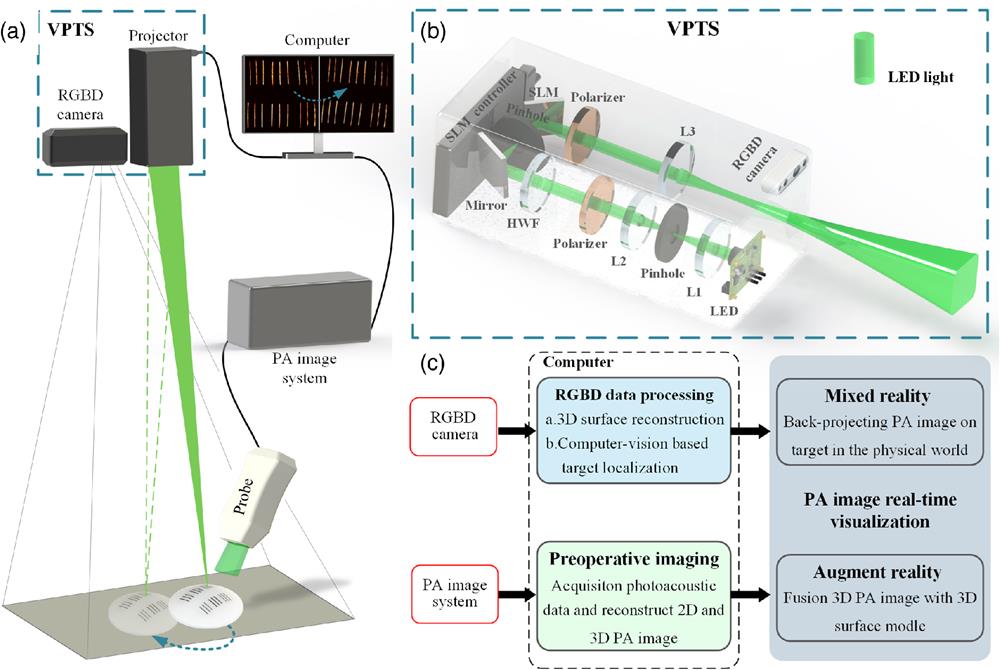
As shown in Fig. 1(a), the experimental facility for photoacoustic-enabled automatic vascular navigation consists of a PAI system, a computer vision-based projection tracking system (VPTS), and a computer. The PAI system is based on our previous work,36 which involved a PACT system with a hyperbolic-array transducer that consists of 128 elements with a central frequency of 5.4 MHz and nominal bandwidth of 65%. The PACT system is used to perform preoperative imaging of blood vessels; then the VPTS is used to accurately overlay preoperative photoacoustic (PA) vascular images on the surgical surface in real time. The VPTS includes an RGBD (R: Red, G: Green, B: Blue, D: Depth) camera (Intel Realsense D435i, Intel, United States) and a projector, where the projector is designed and manufactured based on an SLM (PLUTO-NIR-011, HOLOEYE, Germany). The SLM has the advantages of stable phase delay, a multifocal plane, aberration calibration by software, a simple optical engine, and high optical efficiency,37 which has been proven to be used in making miniaturized high-resolution projectors.38,39 During projection, the preoperative images are registered with the real surgical surface using visual localization technology, and the RGBD camera monitors the target in real time during the surgery. The pose transformation can be estimated when the target moves involuntarily; then the preoperative images are transformed and reprojected to the surgical surface so that the vascular images can still be projected on the surgical surface in situ after the target moves. All vision-based image registration and tracking calculations are performed on a computer.
![]()
Figure 1.(a) Schematic diagram of the experimental facility for photoacoustic-enabled automatic vascular navigation. The PA probe and the PA imaging system are used to image the target, the reconstructed image is accurately projected on the target surface in real time by the VPTS, and the RGBD camera locates and tracks the target in real time, so that the preoperative images can still be accurately reprojected on the target surface when the target moves. (b) Device diagram of the VPTS, including the light path of the projector and RGBD camera. L1, L2, and L3 are convex lenses. HWF is a half-wave plate. (c) System data flow diagram.
The specific optical path of the projector is shown in Fig. 1(b). We use a small size common light emitting diode (LED; CL-P10, LIGITEK, China) with red, green, white, and blue colors as the light source to increase the integration. The whole optical path is divided into four parts.
The data flow diagram of the whole system is shown in Fig. 1(c). The whole process is divided into two parallel parts, with two sensors as inputs. The first input is the PAI system. The PAI system is used to perform preoperative imaging of the target and reconstruct 2D and 3D PA vascular images. The second input is the images of the RGBD camera, which are used to reconstruct the 3D surface model of the target. At the same time, the RGBD camera is also used to locate the target in real time and estimate the pose transform when the target moves involuntarily. Once the data obtained from the two inputs are ready, the augmented reality and mixed reality start working.
2.2 Augmented Reality and Mixed Reality
The specific implementation of augmented reality and mixed reality is shown in Fig. 2. The algorithm flow chart of the whole system is shown in Fig. 2(a). 2D and 3D PA vascular images as well as RGBD camera images are the two inputs of the whole system. First, unifying the coordinate is needed. Once the homography matrix between the projector and camera is solved, the calibration is complete. The specific calibration principle is shown in Fig. 2(d). To make the calibration results have the physical characteristics of the imaging system and thus make the accurate vascular localization after the PA vascular image projection, we use the imaging data of the PA imaging system for calibration directly. After the calibration, the system enters into the concrete implementation stage, which is divided into two parts: augmented reality and mixed reality.
![]()
Figure 2.(a) Flow chart of the system algorithm. (b) Detailed implementation steps of the preoperative image registration algorithm. (c) Schematic diagram of the implementation of the intraoperative image-tracking algorithm. (d) Schematic of the calibration of the camera and projector. (e)–(g) 3D surface models of the target reconstructed using computer vision. (h) 3D point cloud image of the 3D PA image. (i) Augmented-reality image after fusion of the 3D surface model and the 3D PA image.
In the augmented-reality part, RGBD images are first used to reconstruct the 3D surface of the target,42 and then principal component analysis (PCA) is performed on the 3D surface model [Figs. 2(e)–2(g)] and 3D PA vascular image [Fig. 2(h)] to align their direction. After that, the iterative closest point (ICP) algorithm is used to fuse the 3D surface model of the target and the 3D PA vascular image, and the fused augmented-reality image is finally displayed on the screen, as shown in Fig. 2(i). The use of PCA can reduce the number of data dimensions and reduce the amount of computation, while improving the accuracy and success of ICP registration. It can be seen that the 3D PA image does not perfectly overlap with the 3D surface model because there is an error in 3D surface reconstruction using vision.
In the mixed-reality part, the goal is to precisely project the preoperative PA vascular images on the surgical surface, which is divided into two parts: (1) preoperative image registration and (2) intraoperative image tracking.
After solving the transformation relationship for and , the preoperative PA image in the projection coordinate system can be transformed to the projected image. However, when the target is a curved surface, a projection error will occur if the 2D images are directly projected to the curved surface; therefore, it is necessary to design an algorithm for curved surface fitting. The proposed curved-surface-fitting algorithm is specifically shown in Fig. 3. After curved-surface fitting, the final projected images can be projected on the surgical surface by the projector and registered with the real surgical surface. The specific implementation steps of preoperative image registration are shown in Fig. 2(b).
![]()
Figure 3.(a) PA image of the phantom. (b) Schematic diagram of 2D image projection on the 3D surface. A projection error will be caused by directly projecting a 2D image on the curved surface.
is the pose transformation of the target relative to the camera and includes rotation and translation , where ; is the projection function from the 3D world to the camera plane; and is the back projection function from the camera plane to the 3D world.
In the camera coordinate system, suppose that is the pixel point of the 3D point before the target moves and is the pixel point of the 3D point after the target moves. and are the pixel points of the 3D points and in the projection coordinate system, respectively, and in the 3D space and have the following relationship:
The pixel relationship between two images can be obtained from the camera projection function,
Based on the photometric invariance principle, a point in the image after the target moves that is the most similar to in before the target moves can be found. The error is defined as:
Assuming that the target has points and a least squares problem is constructed, the following pose optimization equation is obtained:
When the textures of the surgical surface are weak, or the environmental light changes during the surgery, the pose solution will not be accurate enough or even impossible to solve.43,44 To cope with these problems, the idea of traditional template-matching is added. The zero-mean normalization function zero-mean normalization cross correlation (ZNCC) is used to calculate the cross-correlation coefficient of the two points in the two images, and then the coefficient is used as a weight to optimize the optimization function. The final optimization equation is
If a projected PA vascular image is transformed, then the transformed projected image is expressed as
The reason for dividing these two processes is that the problem of weak texture on the surgical surface makes it difficult to extract enough feature points on the surgical surface. Fortunately, the preoperative image registration process has the promise of finding feature points on the static surgical surface. Even if extraction fails, the pose of the surgical surface can be changed until success. However, during the intraoperative image-tracking process, it is more difficult to extract feature points on the moving surgical surface, which will lead to image registration failure.
2.3 Curved-Surface-Fitting Algorithm
To solve the problem of projection error when projecting 2D PA images on a curved surface, a curved-surface-fitting algorithm was proposed. A hemisphere phantom composed of agar was used to verify the proposed algorithm. Six groups of tungsten wires with a certain radian were covered on the hemisphere surface to simulate blood vessels. The length of the tungsten wires was , and the tungsten wires had three different diameters of 0.5, 0.4, and 0.3 mm. The 2D PA image reconstructed after imaging is shown in Fig. 3(a). This 2D PA image is the projection of the 3D image on the same plane, as shown in Fig. 3(b). Suppose that is the 2D projection of a 3D PA image on the highest plane of the target, then and are the points of the 2D PA image in the projection plane, is the center of the projector, is the highest point of the 3D surface, and and are the projection points of and , respectively. In the physical world, there are and . As can be seen, if a 2D image is projected on a 3D curved surface, projection points and do not coincide with real points and on the real surface. To solve this problem, the camera is introduced, as shown in Fig. 3(c). The camera is used to reconstruct a 3D surface model of the target. Then the real physical coordinates of each point on the 3D surface can be obtained, and the error of the 3D surface reconstruction can be calibrated by calculating the point coordinates of the surface markers. The coordinates of , , in the 3D surface model can be used to calculate the constants , , and . With these variables, the curved edges and can be fitted by the approximate ellipse circumference equation, namely,
Then, and are transformed into and , respectively. Thus, there are: and . At the same time, and in the PA image on the projection plane are transformed into and , which can be obtained from and respectively; the relationships are
Finally, and are projected on the surface as and , which coincide with and . At this point, curved-surface fitting is completed. The same methods are used to fit the entire surface. For different skin surfaces, different regions can be divided according to different shapes; then the proposed curved surface fitting algorithm can be used for each region. Figures 3(d) and 3(e) show the results of curved-surface fitting. It can be seen that there was a projection error () when the PA image was projected on the surface before the fitting in Fig. 3(d), and the projection error was significantly reduced after the fitting, as shown by the white arrow in Fig. 3(e). However, due to the inevitable error in 3D surface reconstruction and the approximate surface-fitting method, there was still a small error after surface fitting ().
3 Experiments and Results
3.1 Localization Accuracy Verification with Phantom Experiments
To verify the localization accuracy of blood vessels during mixed reality, phantom verification experiments were conducted. In the first experiment, a blood vessel-like network was designed and fabricated using tungsten wires, which were randomly placed in agar at different heights. The tungsten wires had three different diameters of 0.5, 0.3, and 0.18 mm to simulate blood vessels of different sizes, as shown in Fig. 4(a). The size of the overall vascular-like network was . The imaging time of the phantom was using PACT; the reconstructed 2D PA image is shown in Fig. 4(b). Surface fitting was first conducted, and then localization accuracy of blood vessels for preoperative image registration was performed. The results of nonregistered and registered are shown in Figs. 4(c1) and 4(c2), respectively. To keep the target within the projection area () as much as possible, movement of 6 mm in the direction and 3 mm in the direction were chosen. The image reprojection results after target movement during intraoperative image tracking are shown in Figs. 4(d1) and 4(d2), respectively. The above steps were repeated 10 times, and the image projection errors were quantified. As shown in Fig. 4(e), the projection errors of both the preoperative image registration and the intraoperative image tracking did not exceed 0.8 mm in the projection area.
![]()
Figure 4.(a) Picture of a vascular-like network phantom composed of tungsten wires. (b) Corresponding 2D maximum amplitude projection PA image. (c1) A result that is not registered during preoperative image registration. (c2) A result after registration in the process of preoperative image registration. (d1) The reprojection result after moving 6 mm in the
In the second experiment, we adopted the hemispherical phantom shown in Fig. 3 and verified the accuracy of vessel localization by repeating the same procedure 10 times and calculating the projection errors in the preoperative image registration and intraoperative image-tracking process. The final results are shown in Fig. S1 in the Supplementary Material. To better evaluate the ability to locate blood vessels in mixed reality, comprehensive statistics of the two validation experiments, a box diagram was plotted to more intuitively represent the error distribution. As shown in Fig. 4(f), the deviation of mean projection errors between the two experiments was less than 0.1 mm, indicating a stable localization performance. It is obvious that the maximum error of the two validation experiments did not exceed 0.75 mm.
The detailed error calculation method for the two phantom experiments is shown in Fig. S2 in the Supplementary Material. Detailed demonstration videos of phantom experiments 1 and 2 are available in Videos 1 and 2. In addition, light sources of different colors can be switched to adapt to different environments so that the best projection effect can be achieved. The projection results of the two phantom experiments after switching the light source to green are shown in Fig. S3 in the Supplementary Material.
3.2 Validation Experiments of Vascular Localization in Vivo
We further verified vascular localization ability in vivo. An area of on the thigh of a living rabbit was first selected, as shown in the white dashed box in Fig. 5(a). Two copper wire marks, P1 and P2, were randomly placed in the selected area for registration; they will move simultaneously with the surgical surface. Then pose transformation of the entire surgical surface can be obtained by solving the pose transformation of the copper wire marks directly. In addition, the copper wire marks can be useful for judging the accuracy of vascular localization. The marks were 7 mm in length and 0.5 mm in diameter. PACT was performed in the selected area. A 1064 nm laser (VIBRANT, OPOTEK Inc, United States) with pulse width from 8 to 10 ns and a repetition rate of 10 Hz was used to excite PA signals. The 1064-nm wavelength was chosen because it has a deeper penetration depth than the 532-nm wavelength, which enhances the imaging depth. The laser fluence () used in the in vivo experiments was well within the American National Standards Institutes safety limit for laser exposure ( at 1064 nm at a 10-Hz pulse repetition rate).45 All in vivo experiments complied with the ethical review of South China Normal University (review number: SCNU-BIP-2022-044). To visualize smaller blood vessels, a small line spot was chosen; the size of the laser beam focus on the tissue surface was . After 60 s of imaging, a 2D PA image was reconstructed, as shown in Fig. 5(b). During image reconstruction, 10 sets of acquired radio frequency (RF) data for each B-scan were averaged to reduce image artifacts due to respiratory jitter, and the imaging speed can be increased by reducing the number of RF data acquired by each B-scan, but the imaging quality may reduce. The skin and tissue signals were removed from this PA image, with the aim of removing information that was not of interest to us. We could calculate that the maximum imaging depth was from the tomography image along the white dashed line in Fig. 5(b), as shown in Fig. 5(c). According to the previous section, curved surface fitting is first required. Then, preoperative image registration can be carried out using marks P1 and P2. This process takes only 10 s if the feature extraction goes well; otherwise the pose of the surgical surface needs to be changed until the feature extraction is successful. According to the data from multiple experiments, the process time remains within 1 min. The results of nonregistered and registered on the surface are shown in Figs. 5(d) and 5(e), in which the part indicated by the white arrow represents the projected PA vascular image that was accurately registered with the visible blood vessel on the rabbit thigh. When the position of the thigh moved, the PA vascular images were reprojected in real time and still registered with the visible blood vessels and marks on the thigh, as shown in Figs. 5(f1)–5(f3). The white dashed lines show movement up, down, and left. The specific demonstration video is given in Video 3. The white dashed box in Fig. 5(f3) shows the missing blood vessels; this is due to the image loss caused by the rotation and translation of the 2D image after the target moved. The missing area can be identified to be outside the projection area, but this did not affect the accurate visualization of blood vessels on the surgical surface when the target returned to the projection area. The projection area of the current experiment is set to by the software. This projection area can be changed; the size of the projection area depends mainly on how large an area corresponding to the PA image is used for calibration, but this requires a new camera-projector calibration. Through this mixed-reality method, the subcutaneous blood vessels can be directly visualized on the surgical surface in real time by the naked eye, which can be very convenient for noninvasive and accurate localization of blood vessels. As shown in Fig. 5(g), approximately 2.9-mm-deep vessels and diameter vessels could be directly visualized on the surface of the rabbit thigh.
![]()
Figure 5.(a) Photo of the rabbit thigh. The white dashed box area is selected for imaging, and P1 and P2 are randomly placed marks. (b) 2D PA vascular image corresponding to the dashed box in panel (a). (c) Tomography image corresponding to the white dashed line in panel (b). (d) and (e) Nonregistered and registered results during preoperative image registration. (f1)–(f3) Three results of vascular image reprojection after movement during intraoperative image tracking; the white dashed box in panel f3 is outside the projection area. (g) Mixed-reality effect on the rabbit thigh, deep blood vessels, and microvessels can be directly visualized on the surface. (h) Error statistics chart of the whole demonstration process based on the demonstration video of the rabbit thigh (
To further quantify the localization accuracy of blood vessels in vivo, we calculated the vascular localization accuracy during the entire mixed reality demonstration on the rabbit thigh. Since the deep blood vessels were projected on the surgical surface, we could not calculate the localization error of the deep blood vessels. Therefore, we calculated whether the marks randomly placed on the surgical surface coincided with their projection images as the error calculation standard. As shown in Fig. 5(g), four endpoints, , , , and , on the real marks and four endpoints, , , , and , on its projection image were selected to calculate the root mean square error (RMSE) and convert it into actual errors, respectively. The demonstration video (Video 3) on the rabbit thigh is 85 s. It was divided into 425 pictures to calculate their errors and finally form an error statistical graph, as shown in Fig. 5(h). As seen in the green dashed boxes of the statistical graph, there were large errors at the beginning of the experiment when the images were not registered. After the registration, the errors quickly dropped. In the rabbit thigh demonstration, the movement occurred after 17 s; after the target moved, vascular image reprojection was performed. The pink dotted box indicates the relocalization errors after the movement. According to the statistical graph, the relocation time was within 1 s. The average RMSE in the demonstration video of the rabbit thigh was calculated to be 8.6 pixels, with an actual average error of 0.72 mm.
In addition, we also demonstrated the use of mixed reality to locate blood vessels in real time on the skin surface of the human arm; the results are shown in Fig. S4 in the Supplementary Material and Video 4. After calculation, the average RMSE in the demonstration video of the human arm was 11.7 pixels and the actual average error was 0.89 mm. To analyze the statistical significance of the results, we performed a mixed ANOVA for the localization accuracy of blood vessels in the rabbit thigh and arm, with a significance threshold of , as shown in Fig. 5(i). As can be seen, the average values of the two sets are close, indicating that our proposed method is applicable to both animals and human beings, and can still work at different parts. The marked *** symbols indicate statistical significance () between the experimental conditions. After statistical analysis, our -value was . Therefore, it shows that our calculated vascular localization accuracy is statistically significant. The results show very high vascular localization accuracy, which is better than the 3.47-mm vascular localization error in perforator flap surgery using the Microsoft HoloLens previously reported.9 This is also better than the minimum error of 1.35 mm in the previously reported experiment using the HoloLens to verify the vascular localization error in the phantom model.46 Additionally, it is better than the 1.7 mm error already reported for vascular localization using the VascuLens,13 even within the clinically acceptable vascular localization accuracy range of 5 mm for perforator flap surgery.10 The specific vascular localization accuracy comparison is shown in Table 1, where case 1 and case 2 are cases of vascular localization using the combination of CTA and augmented reality, and case 3 is a case of vascular localization using the combination of CTA and mixed reality. This table shows that our method has high performance in vascular localization.
| Minimum | Maximum | Average | |
| Case 1 | — | — | 3.47 |
| Case 2 | 1.35 | 3.18 | — |
| Case 3 | — | — | 1.7 |
| Ours | 0.29 | 1.32 | 0.89 |
Table 1. Error statistics for current cases.
3.3 Ability of Augmented Reality to Assist Vascular Localization
In this work, we proposed combining augmented reality and mixed reality to provide reliable help for rapid and accurate localization of blood vessels. The above experiments have all verified the vascular localization performance in mixed reality, but the ability of augmented reality to assist vascular localization cannot be ignored. Therefore, a region of on a human arm was selected, as shown in region of interest (ROI) A in Fig. 6(b). Two copper wire marks, F1 and F2, were randomly placed in the area for registration. The length and diameter of the marks were 6 and 0.5 mm, respectively. PACT was first performed on the selected area, with an imaging time of 60 s. Different from the previous experiment on the rabbit thigh, the size of the laser beam focus on the tissue surface was to a greater depth. The reconstructed 3D vascular image is shown in Fig. 6(c). As seen from the 3D vascular image, the blood vessels 7 mm under the skin can be clearly visualized. Then the RGBD camera was used to reconstruct the 3D surface model of the arm, which was fused with the 3D PA vascular image into an augmented-reality model in a 3D point cloud space. The fused model was finally displayed on the computer screen in the form of dense point cloud using PCL libraries and C++ programming, as shown in Fig. 6(a). The final augmented-reality model can be rotated and scaled in 3D space; the detailed demonstration result is shown in Video 5. ROI B was selected to visualize the results of rotation and scaling, as shown in Figs. 6(d)–6(g). Moreover, the coordinates of each point of the augmented-reality model in the 3D point cloud space can be easily obtained, which means that the position and structure relationships between the 3D vascular image and the 3D surface model can be calculated with the help of 3D coordinate information. As shown in Fig. 6(e), we can calculate the coordinates of points in 3D space to measure the relationship. Moreover, the subcutaneous vessels can be directly visualized through the skin by enlarging the augmented-reality model to provide perspective, which can conveniently provide reliable information for preoperative planning. However, we do not calculate the accuracy of vascular localization in the augmented-reality part, but in the mixed-reality part.
![]()
Figure 6.(a) Result of augmented reality after fusing the 3D surface model of the arm with the 3D PA vascular image. (b) Photo of the arm. ROI A was selected for PACT imaging; F1 and F2 were two randomly placed marks. (c) 3D PA vascular image corresponding to ROI A. (d)–(g) Visualization results of the augmented-reality model after rotation and scaling in ROI B marked by the red dashed box in panel (a) (
4 Discussion
This work verified the accuracy of vessel localization in phantoms and in vivo. The localization error was in the phantoms, and the average localization error was in vivo, which is sufficient to prove the excellent performance of our vascular localization strategy. In this work, the imaging area for in vivo experiments is , but this area is not fixed: a larger imaging area can be selected to cover the clinically required imaging area. However, our PACT system was limited by the laser energy, so the maximum imaging depth was 7 mm in this work, while PACT has been demonstrated to have a maximum imaging depth of 4 cm.33
The proposed method showed excellent vascular localization performance in demonstrations. Even if the living tissue produced slight nonrigid deformation, this method could still stably and accurately visualize the vascular images on the body surface in real time. However, when the nonrigid deformation of the tissue on the surgical surface increased, the projection error also increased. As shown in the error statistics in Fig. 5(h), from 34 to 38 s, the error increased due to the nonrigid deformation of the tissue. Nevertheless, this did not affect the accuracy of vascular localization after the restoration of the nonrigid deformation. Introducing a mechanical model or using deep learning to predict nonrigid deformation to solve the increased errors should be the next area of study. In addition, vision-based 3D reconstruction has inevitable errors due to depth measurement or depth estimation problems; after measurement and comparison with the real size, the inevitable error was . This error will exist in the whole system, even if some error corrections had been made in engineering, such as error calibration of the reconstructed 3D surface model. This error was considered in the construction of the approximate elliptical model to improve the accuracy of curved-surface fitting in 2D projection images. However, there was still a projection error () after surface fitting. Therefore, more accurate and robust algorithms to further reduce this error and improve the accuracy of vascular localization need to be designed in the future. In this work, we adopted the scheme of imaging before real-time projection instead of real-time PA imaging, which is a decision we made, aiming at the target of clinical application. The reason is that PA imaging needs coupling. Real-time PA imaging will block the projection. Moreover, in the clinical process, it needs to leave time for doctors to evaluate. Therefore, the current method of imaging before real-time projection is a solution that fits the application scenario.
As SLM is a wavelength-sensitive device, it cannot modulate different wavelengths of light simultaneously. Therefore, we cannot project a depth-encoded image to carry the depth information of the blood vessels. By using the time-division multiplexing, one is able to project vascular image with depth information, which may be implemented in our future work.
5 Conclusion
Our proposed and experimentally demonstrated photoacoustic-enabled automatic vascular navigation method can noninvasively and accurately locate blood vessels under the navigation of PA images on the surgical surface. This is the first study to utilize PACT in conjunction with augmented and mixed reality for accurate and naked-eye real-time visualization of deep-seated vessels. The PACT used in this system can specifically identify blood vessels with high resolution and sufficient depth. In this work, we used PACT to noninvasively obtain vessels in the thigh of rabbit with a minimum diameter of and a maximum depth of , which is not possible with ultrasound, CTA and NIR imaging. In addition, we proposed a curved-surface-fitting algorithm and zero-mean normalization idea-based visual-tracking algorithm to achieve high-precision and low-latency vessel localization. With these two algorithms, the average error of vessel localization was within 0.89 mm, and the vessel relocation latency was within 1 s. Moreover, the use of augmented reality gives doctors the ability to perform perspective in the constructed 3D space, providing reliable information such as the position and structure information between blood vessels and surgical surface for preoperative planning. In addition, the mixed reality allows doctors to perform perspective in the real world by directly projecting deep vessels on the surgical surface.
Biographies of the authors are not available.
References
[13] S. Gonzalez et al. The vascuLens: a handsfree projector-based augmented reality system for surgical guidance during DIEP flap harvest(2021).
[42] T. Whelan et al. ElasticFusion: dense SLAM without a pose graph(2015).
[45] American National Standard for Safe Use of Lasers(2014).

Set citation alerts for the article
Please enter your email address
© Copyright 2018-2021 | Chinese Laser Press. All Rights Reserved 沪ICP备15018463号-20