• Photonics Research
  • Vol. 10, Issue 4, 855 (2022)
Zhaojian Zhang1, Junbo Yang1、2、*, Te Du1, and Xinpeng Jiang1
Author Affiliations
  • 1College of Liberal Arts and Sciences, National University of Defense Technology, Changsha 410073, China
  • 2Center of Material Science, National University of Defense Technology, Changsha 410073, China
  • show less
    DOI: 10.1364/PRJ.443025 Cite this Article Set citation alerts
    Zhaojian Zhang, Junbo Yang, Te Du, Xinpeng Jiang. Topological multipolar corner state in a supercell metasurface and its interplay with two-dimensional materials[J]. Photonics Research, 2022, 10(4): 855 Copy Citation Text show less
    Geometric configuration of the supercell metasurface. The metasurface consists of periodically arranged supercells along x and y directions, which include nontrivial and trivial unit cells highlighted in blue and gray, respectively. There is an x-polarized plane wave that is incident on the metasurface. The inset shows the schematic of the supercell.
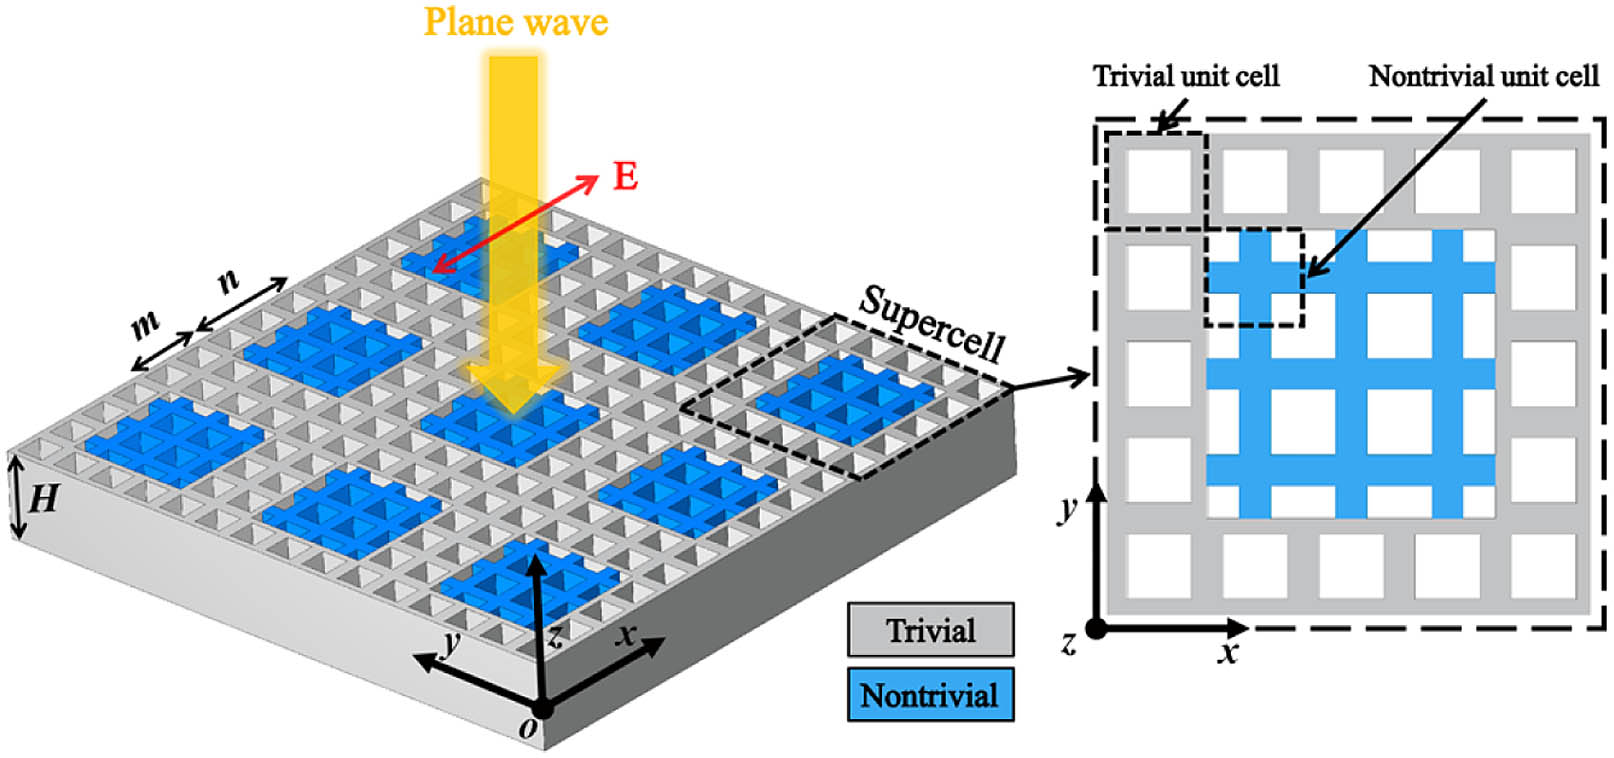
    Fig. 1. Geometric configuration of the supercell metasurface. The metasurface consists of periodically arranged supercells along x and y directions, which include nontrivial and trivial unit cells highlighted in blue and gray, respectively. There is an x-polarized plane wave that is incident on the metasurface. The inset shows the schematic of the supercell.
    (a)–(c) Schematics of cross sections in the x−y plane for the three unit cells. The yellow and white areas represent silicon and air regions, respectively. The FBZ is given in (a). (d)–(f) The TE bands of PhC-slabs with unit cells in (a)–(c), respectively, where the gray region indicates the light cone, and the bands in gray represent higher-order state bands. In (d) and (f), the insets are Hz field profiles at X point. The blue and red band colors indicate the band inversion of the two fundamental state bands, and symbols + and – represent even and odd parity of Hz, respectively. In (e), the green band color highlights the degenerated fundamental state bands.
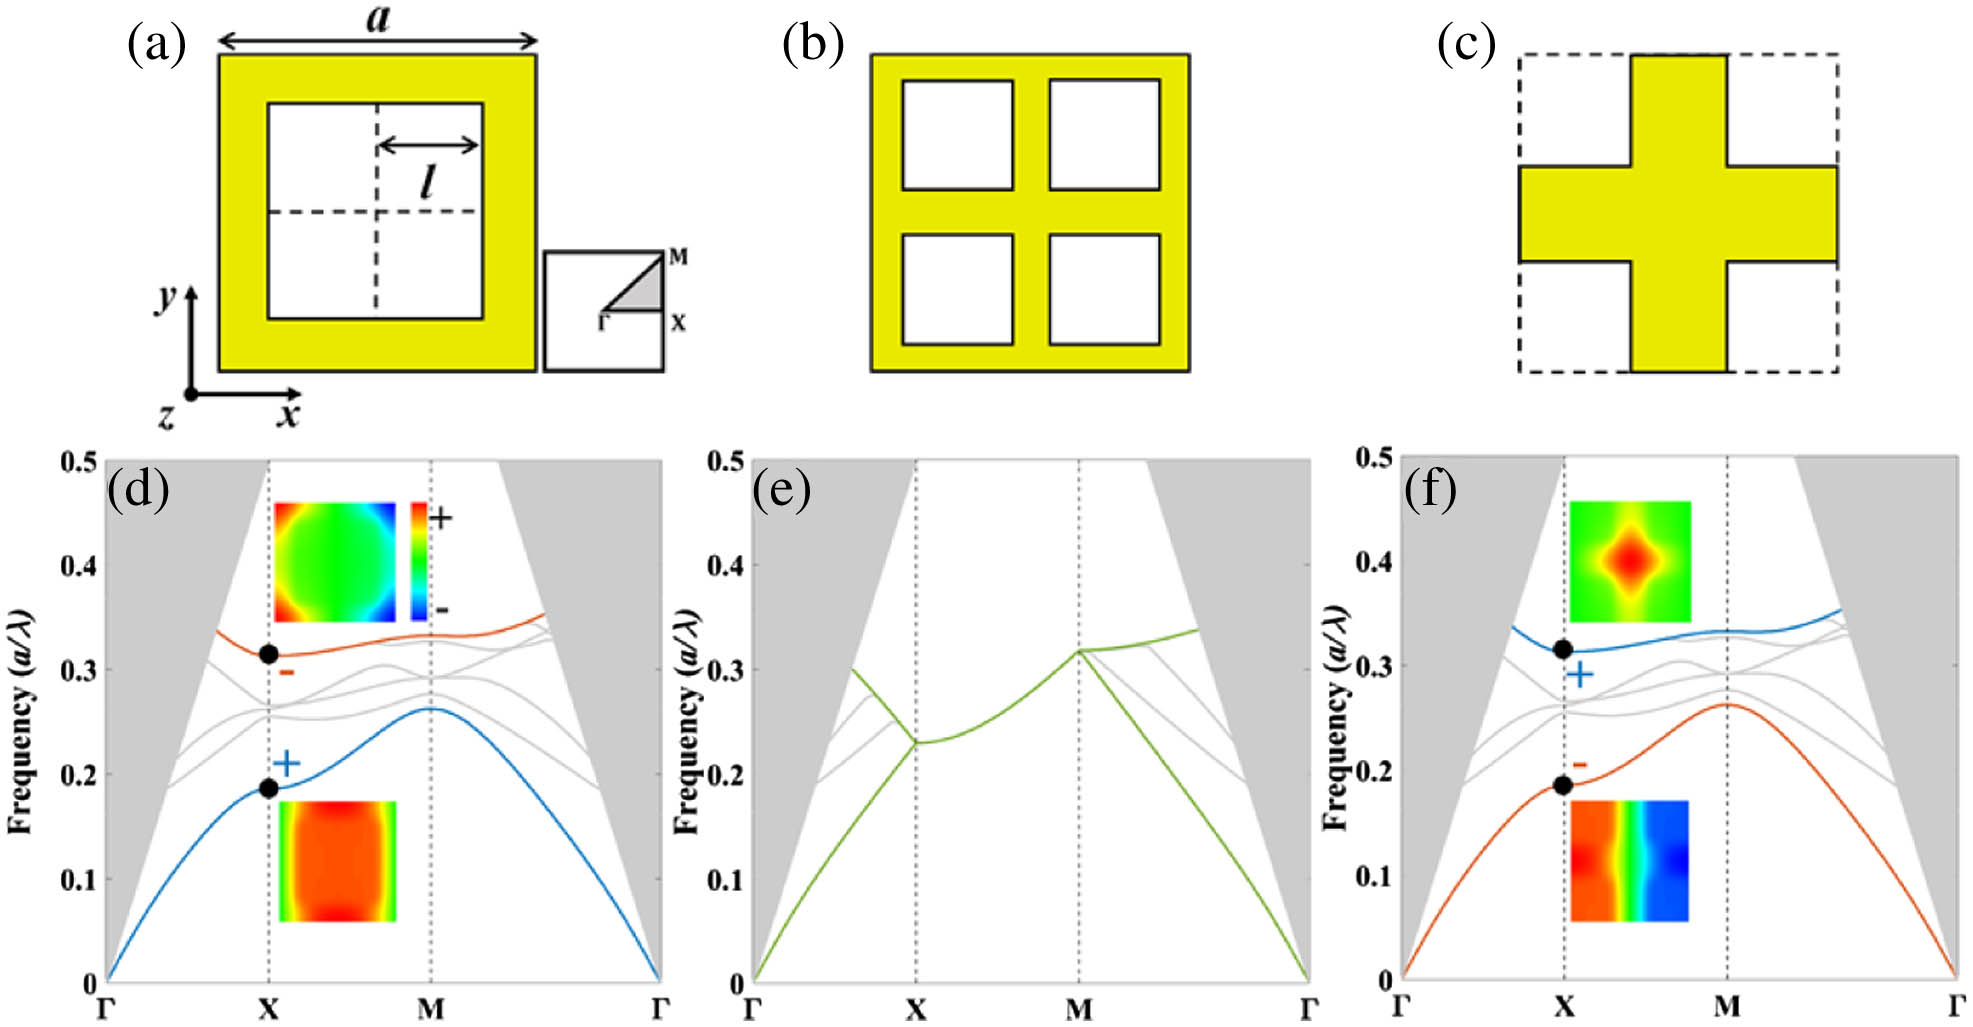
    Fig. 2. (a)–(c) Schematics of cross sections in the xy plane for the three unit cells. The yellow and white areas represent silicon and air regions, respectively. The FBZ is given in (a). (d)–(f) The TE bands of PhC-slabs with unit cells in (a)–(c), respectively, where the gray region indicates the light cone, and the bands in gray represent higher-order state bands. In (d) and (f), the insets are Hz field profiles at X point. The blue and red band colors indicate the band inversion of the two fundamental state bands, and symbols + and – represent even and odd parity of Hz, respectively. In (e), the green band color highlights the degenerated fundamental state bands.
    (a) Projected band structures of the metasurface along the kx direction when m=2 and n=3. The Hz profiles of the bands at Γ point are plotted in the insets. (b) Dependence of the eigenfrequencies at Γ point on m when n=5; (c) dependence of the eigenfrequencies at Γ point on n when m=4; (d) transmission spectra of the metasurface with different heights H; the insets show Hz distributions of the field at the transmission dip in the x−y and x−z cross sections, respectively. (e) Normalized scattering cross sections of the finite SOTI square arrays with different sizes. (f) Q factor of the finite SOTI array with the total number of supercells. The yellow and gray dashed lines indicate the Q factor of the infinite array and single isolated supercell, respectively.
    Fig. 3. (a) Projected band structures of the metasurface along the kx direction when m=2 and n=3. The Hz profiles of the bands at Γ point are plotted in the insets. (b) Dependence of the eigenfrequencies at Γ point on m when n=5; (c) dependence of the eigenfrequencies at Γ point on n when m=4; (d) transmission spectra of the metasurface with different heights H; the insets show Hz distributions of the field at the transmission dip in the xy and xz cross sections, respectively. (e) Normalized scattering cross sections of the finite SOTI square arrays with different sizes. (f) Q factor of the finite SOTI array with the total number of supercells. The yellow and gray dashed lines indicate the Q factor of the infinite array and single isolated supercell, respectively.
    (a) The transmission spectra of hBN (blue curve), metasurface (red curve), and metasurface covered by hBN (yellow curve), under the plane-wave excitation. The inset shows the schematic of the metasurface integrated with hBN. (b) Energy diagram of the hybridization due to the strong coupling;. (c) |H| distributions of the two polariton states at 1385.09 cm−1 and 1389.02 cm−1, respectively; (d) transmission spectra under different heights H while the phonon frequency ωp is kept as 1387 cm−1. (e) Frequencies of the two polariton branches ω± as a function of the frequency of the corner state ωc; the calculated results from FDTD (dots) and CHOM (curves) are plotted. ωp remains unchanged, as indicated by the green dashed line. (f), (g) The fractions of the corner state and phonon in upper and lower branches, respectively.
    Fig. 4. (a) The transmission spectra of hBN (blue curve), metasurface (red curve), and metasurface covered by hBN (yellow curve), under the plane-wave excitation. The inset shows the schematic of the metasurface integrated with hBN. (b) Energy diagram of the hybridization due to the strong coupling;. (c) |H| distributions of the two polariton states at 1385.09  cm1 and 1389.02  cm1, respectively; (d) transmission spectra under different heights H while the phonon frequency ωp is kept as 1387  cm1. (e) Frequencies of the two polariton branches ω± as a function of the frequency of the corner state ωc; the calculated results from FDTD (dots) and CHOM (curves) are plotted. ωp remains unchanged, as indicated by the green dashed line. (f), (g) The fractions of the corner state and phonon in upper and lower branches, respectively.
    (a) The transmission spectra under different heights H when hBN is at z=0. The phonon frequency ωp is kept as 1387 cm−1. (b) The frequencies of the two polariton branches ω± as a function of the corner state ωc when hBN is at z=0. The calculated results from FDTD (dots) and CHOM (curves) are plotted. ωp remains unchanged, as indicated by the green dashed line. (c) The Rabi splitting Ω under different phonon damping rates γp and hBN positions of the metasurface along the z axis; the missing data points represent the vanishing of Rabi splitting. (d) The strong-coupling factor C under different γp and hBN positions along the z axis; (e) Rabi splitting Ω and the strong-coupling factor C with hBN film or crystal at different positions of the metasurface along the z axis.
    Fig. 5. (a) The transmission spectra under different heights H when hBN is at z=0. The phonon frequency ωp is kept as 1387  cm1. (b) The frequencies of the two polariton branches ω± as a function of the corner state ωc when hBN is at z=0. The calculated results from FDTD (dots) and CHOM (curves) are plotted. ωp remains unchanged, as indicated by the green dashed line. (c) The Rabi splitting Ω under different phonon damping rates γp and hBN positions of the metasurface along the z axis; the missing data points represent the vanishing of Rabi splitting. (d) The strong-coupling factor C under different γp and hBN positions along the z axis; (e) Rabi splitting Ω and the strong-coupling factor C with hBN film or crystal at different positions of the metasurface along the z axis.
    (a) Schematic of the defects with side length l′ in the supercell. The number labels the defects in different positions of the supercell. (b) Transmission spectra of the metasurface with defect 1 under different l′; the black dashed line indicates the position of the dip without defects. (c) frequency detuning induced by defects in different positions with respect to l′; (d) transmission spectra of the hybrid metasurface with defects in different positions. Here, l′=0.69 μm for all defects. The black dashed lines indicate the positions of the dips without defects.
    Fig. 6. (a) Schematic of the defects with side length l in the supercell. The number labels the defects in different positions of the supercell. (b) Transmission spectra of the metasurface with defect 1 under different l; the black dashed line indicates the position of the dip without defects. (c) frequency detuning induced by defects in different positions with respect to l; (d) transmission spectra of the hybrid metasurface with defects in different positions. Here, l=0.69  μm for all defects. The black dashed lines indicate the positions of the dips without defects.
    (a) The transmission spectra of the metasurface with no graphene (blue curve), with top-covered graphene at 0.1 eV (red curve), 1.0 eV (yellow curve), and 2.0 eV (purple curve). The inset shows the schematic of the metasurface integrated with graphene. (b) Transmission spectra under different Fermi levels of graphene when graphene is at z=H/2; (c) resonant frequency of the corner state ωc under different Fermi levels of graphene when graphene position moves along the z axis; the case when graphene crystal is at z=H/2 is also plotted. (d) Transmission spectra under different Fermi levels of graphene when hBN–metasurface–graphene heterostructure is introduced. The inset shows the schematic of the heterostructure.
    Fig. 7. (a) The transmission spectra of the metasurface with no graphene (blue curve), with top-covered graphene at 0.1 eV (red curve), 1.0 eV (yellow curve), and 2.0 eV (purple curve). The inset shows the schematic of the metasurface integrated with graphene. (b) Transmission spectra under different Fermi levels of graphene when graphene is at z=H/2; (c) resonant frequency of the corner state ωc under different Fermi levels of graphene when graphene position moves along the z axis; the case when graphene crystal is at z=H/2 is also plotted. (d) Transmission spectra under different Fermi levels of graphene when hBN–metasurface–graphene heterostructure is introduced. The inset shows the schematic of the heterostructure.
    (a)–(c) The TE band structures of the three different 3D unit cells as shown in the insets, and the two fundamental state bands are highlighted in colors, respectively. The gray region indicates the light cone. (d)–(f) Corresponding Hz field distributions of the two fundamental state bands at symmetry points.
    Fig. 8. (a)–(c) The TE band structures of the three different 3D unit cells as shown in the insets, and the two fundamental state bands are highlighted in colors, respectively. The gray region indicates the light cone. (d)–(f) Corresponding Hz field distributions of the two fundamental state bands at symmetry points.
    (a)–(c) First two TE band structures of the corresponding 2D unit cells in the insets, respectively; (d)–(f) corresponding Hz field distributions of the two bands at symmetry points.
    Fig. 9. (a)–(c) First two TE band structures of the corresponding 2D unit cells in the insets, respectively; (d)–(f) corresponding Hz field distributions of the two bands at symmetry points.
    (a), (b) TE band structures of the two 3D unit cells as shown in the insets; the black dashed lines in the insets indicate the position of the cross-sectional plane. The gray region indicates the light cone. (c), (d) Corresponding Hz field distributions of the bands at X point.
    Fig. 10. (a), (b) TE band structures of the two 3D unit cells as shown in the insets; the black dashed lines in the insets indicate the position of the cross-sectional plane. The gray region indicates the light cone. (c), (d) Corresponding Hz field distributions of the bands at X point.
    (a) Transmission spectra of the metasurface under the plane wave with different polarization directions; (b), (c) supercells under the plane wave with polarization direction indicated by the red arrows; (d), (e) |H| field distributions at the transmission dip under the polarization directions indicated by (b) and (c), respectively; (f), (g) Hz field distributions at the transmission dip under the polarization directions indicated by (b) and (c), respectively.
    Fig. 11. (a) Transmission spectra of the metasurface under the plane wave with different polarization directions; (b), (c) supercells under the plane wave with polarization direction indicated by the red arrows; (d), (e) |H| field distributions at the transmission dip under the polarization directions indicated by (b) and (c), respectively; (f), (g) Hz field distributions at the transmission dip under the polarization directions indicated by (b) and (c), respectively.
    Zhaojian Zhang, Junbo Yang, Te Du, Xinpeng Jiang. Topological multipolar corner state in a supercell metasurface and its interplay with two-dimensional materials[J]. Photonics Research, 2022, 10(4): 855
    Download Citation