
Davide Bacco, Nicola Biagi, Ilaria Vagniluca, Tetsuya Hayashi, Antonio Mecozzi, Cristian Antonelli, Leif K. Oxenløwe, Alessandro Zavatta, "Characterization and stability measurement of deployed multicore fibers for quantum applications," Photonics Res. 9, 1992 (2021)
- Photonics Research
- Vol. 9, Issue 10, 1992 (2021)
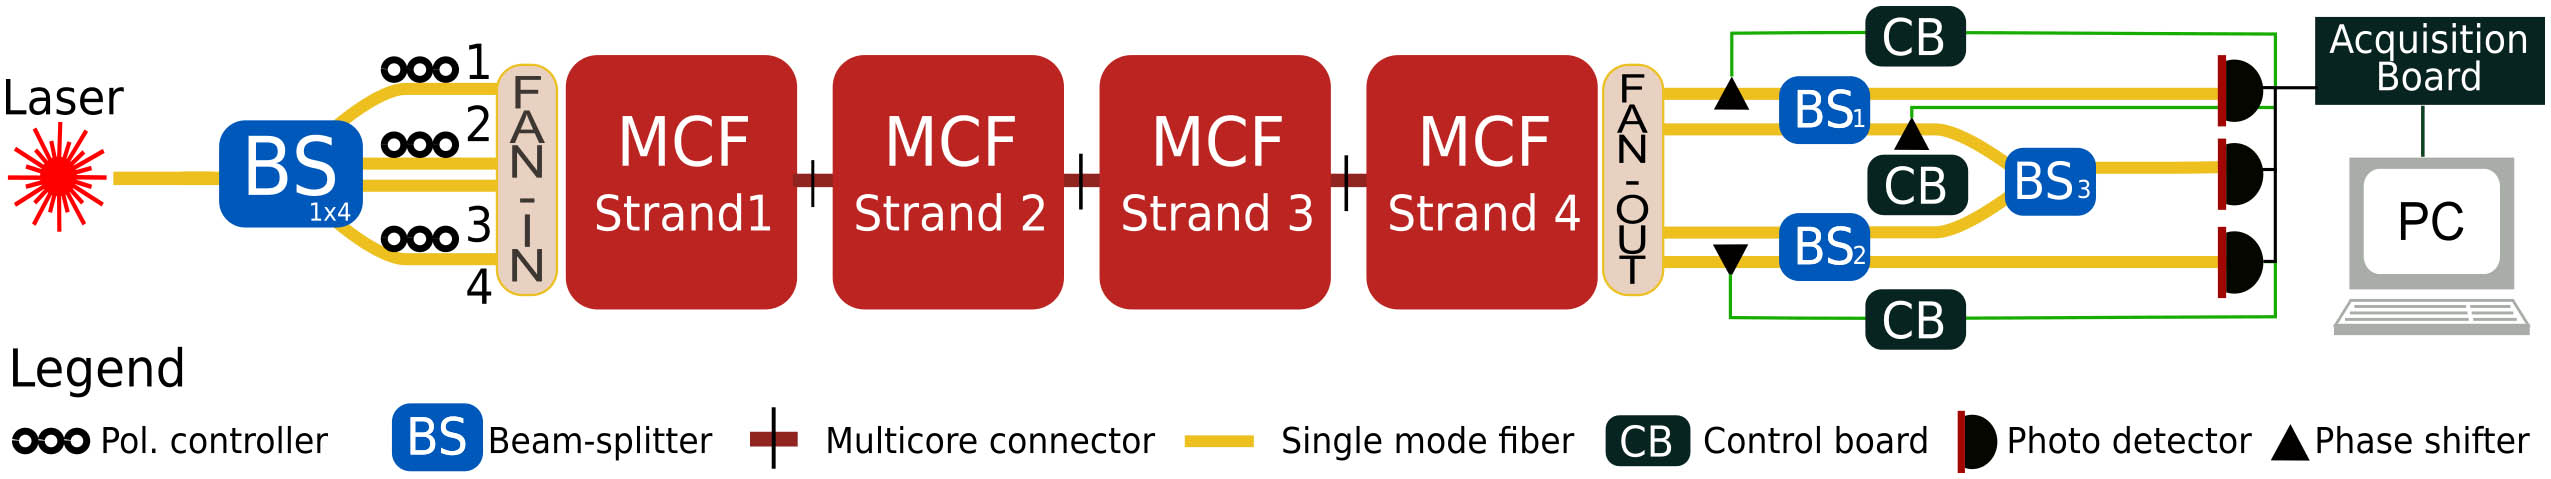
Fig. 1. Experimental setup. A continuous wave laser at 1550 nm is equally divided into four paths through a 1 × 4 BS 1 × 4 2 × 2 BS 1 BS 2 BS 3
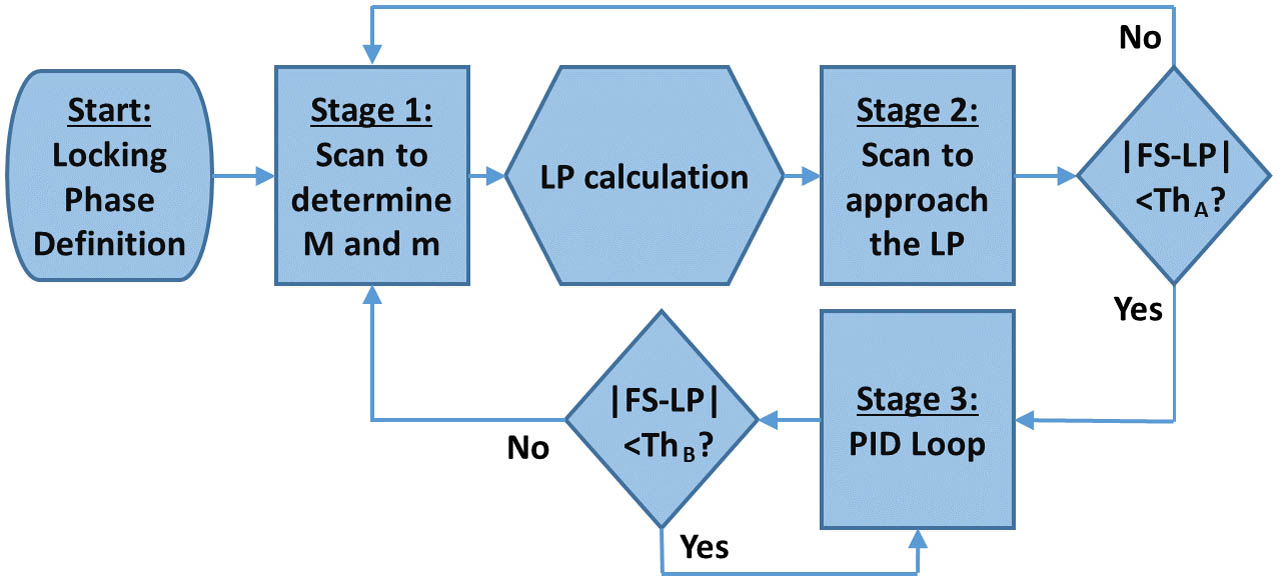
Fig. 2. Flow chart of the PID controller. This algorithm is used for controlling each phase shifter in the three different interferometers. M m Th A Th B
Fig. 3. Visibility fringes of the interferometers. (a) Interference signals as a function of time for the two independent interferometers between cores 1 and 2 and cores 3 and 4. Measured visibility of V 1 & 2 = 0.981 ± 0.008 V 3 & 4 = 0.945 ± 0.011 V 1 & 2 & 3 & 4 = 0.989 ± 0.004
Fig. 4. Phase drifts of the non-stabilized and stabilized four concatenated strands multicore interferometers over 10 min acquisition. (a) Phase drift between two-core and four-core interferometers without active phase stabilization. (b) Phase drift of (a) but with active phase stabilization loops. Different colors represent the three different configurations (red and blue, two-path interferometers; yellow, four-path interferometer).
Fig. 5. Frequency analysis of the interference signals. (a) Two-core intereferometers for the four different strands. (b) Four-core interferometer for the four different strands. Different colors represent different strands. Each measurement has been acquired for 30 min in the non-locked system.


Set citation alerts for the article
Please enter your email address

© Copyright 2018-2021 | Chinese Laser Press. All Rights Reserved 沪ICP备15018463号-20