
Wei-Jia XU, Da-Ping QIU, Shi-Qiang LIU, Min LI, Ru YANG. Preparation of Cork-derived Porous Activated Carbon for High Performance Supercapacitors [J]. Journal of Inorganic Materials, 2019, 34(6): 625
- Journal of Inorganic Materials
- Vol. 34, Issue 6, 625 (2019)
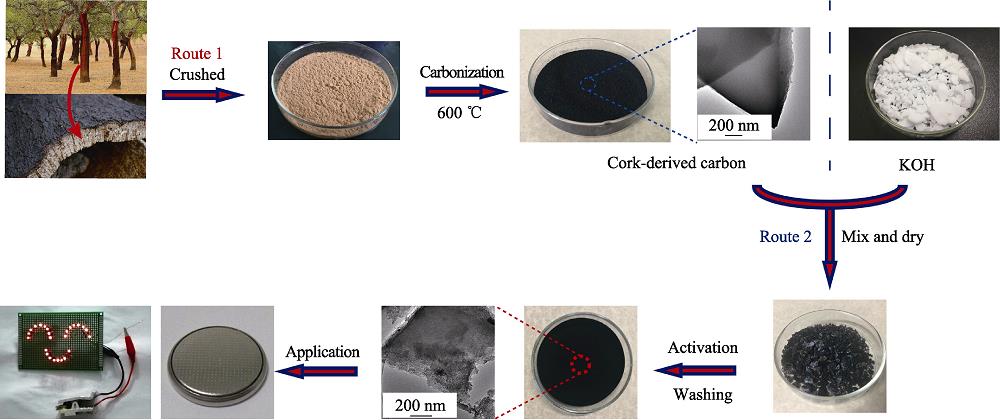
1. Schematic illustration of the preparation process for cork-derived porous activated carbon sheets and application of supercapacitor
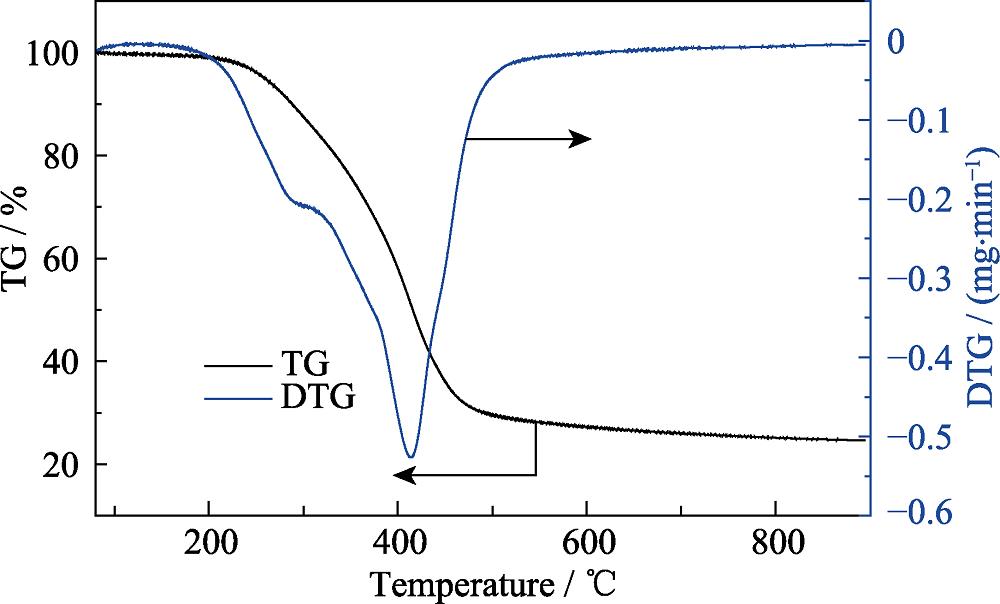
2. TG/DTG curves of raw cork in a flow of nitrogen gas
3. (a, d) SEM and (b, c, e, f) TEM images of (a-c) CC and (d-f) COAC-4.5
4. (a) N2 (77 K) adsorption/desorption isotherms and (b) pore size distribution curves of COAC-n samples
5. XRD patterns of the COAC-n samples
6. (a) XPS spectra of COAC-n , (b) C1s and (c) O1s XPS spectra of COAC-4.5
7. Electrochemical performance characteristics of COAC-n measured in a three-electrode system in the 6 mol/L KOH electrolyte: CV curves at (a) 1 mV/s and (b) 200 mV/s; (c) Galvanostatic charge/discharge curves at a current density of 0.1 A/g; (d) Specific capacitances at different current densities; (e) Nyquist plots in the frequency range from 10 kHz to 10 mHz with inset showing magnified figure of arc part
S1. Electrochemical performance of COAC-4.5 measured in two electrode system with 6 mol/L KOH electrolyte:(a), (b) CV curves at different scan rates; (c) Galvanostatic charge-discharge curves at different current densities; (d) Specific capacitances for a single electrode at different current densities; (e) Ragone plot of the symmetrical system; (f) Cycling stability at a current density of 5 A/g and inset is the charge-discharge curves of first cycle and 5000th cycle
S2. Electrochemical performance of COAC-4.5 measured in two electrode system with 1 mol/L Na2SO4 electrolyte: (a) CV curves of the cell operated in different voltage windows at a scan rate of 50 mV/s; (b) Galvanostatic charge/discharge curves of the cell at various current densities; (c) Specific capacitances for a single electrode at different current densities; (d) Ragone plot of COAC-4.5 and other carbon-based symmetrical supercapacitors
| ||||||||||||||||||||||||||||||||||||||||||||||||||||||||
Table 1. Porosity parameters of the COAC-n samples
|
Table 2. C, O and N contents of COAC-n samples from XPS analysis


Set citation alerts for the article
Please enter your email address

© Copyright 2018-2021 | Chinese Laser Press. All Rights Reserved 沪ICP备15018463号-20