• Photonics Research
  • Vol. 7, Issue 11, 1249 (2019)
Carlos Doñate-Buendía, Mercedes Fernández-Alonso, Jesús Lancis, and Gladys Mínguez-Vega*
Author Affiliations
  • GROC·UJI, Institute of New Imaging Technologies, Universitat Jaume I, Avda. Sos Baynat sn, 12071 Castellón, Spain
  • show less
    DOI: 10.1364/PRJ.7.001249 Cite this Article Set citation alerts
    Carlos Doñate-Buendía, Mercedes Fernández-Alonso, Jesús Lancis, Gladys Mínguez-Vega. Overcoming the barrier of nanoparticle production by femtosecond laser ablation in liquids using simultaneous spatial and temporal focusing[J]. Photonics Research, 2019, 7(11): 1249 Copy Citation Text show less
    Schemes of the experimental setups employed to fabricate and compare gold nanoparticle production. (a) Image-based SSTF system based on a diffraction grating that spatially separates the broad 30 fs laser spectrum schematically displayed as red, green, and blue. Two off-axis gold mirrors form an image of the grating’s surface and achieve spatial overlap of all the wavelengths at focal spot plane. (b) Analogous image system (IOS) without spatiotemporal focusing effect. (c) Standard laser ablation in liquids system (COS) based on direct focalization of the femtosecond laser onto the target’s surface.
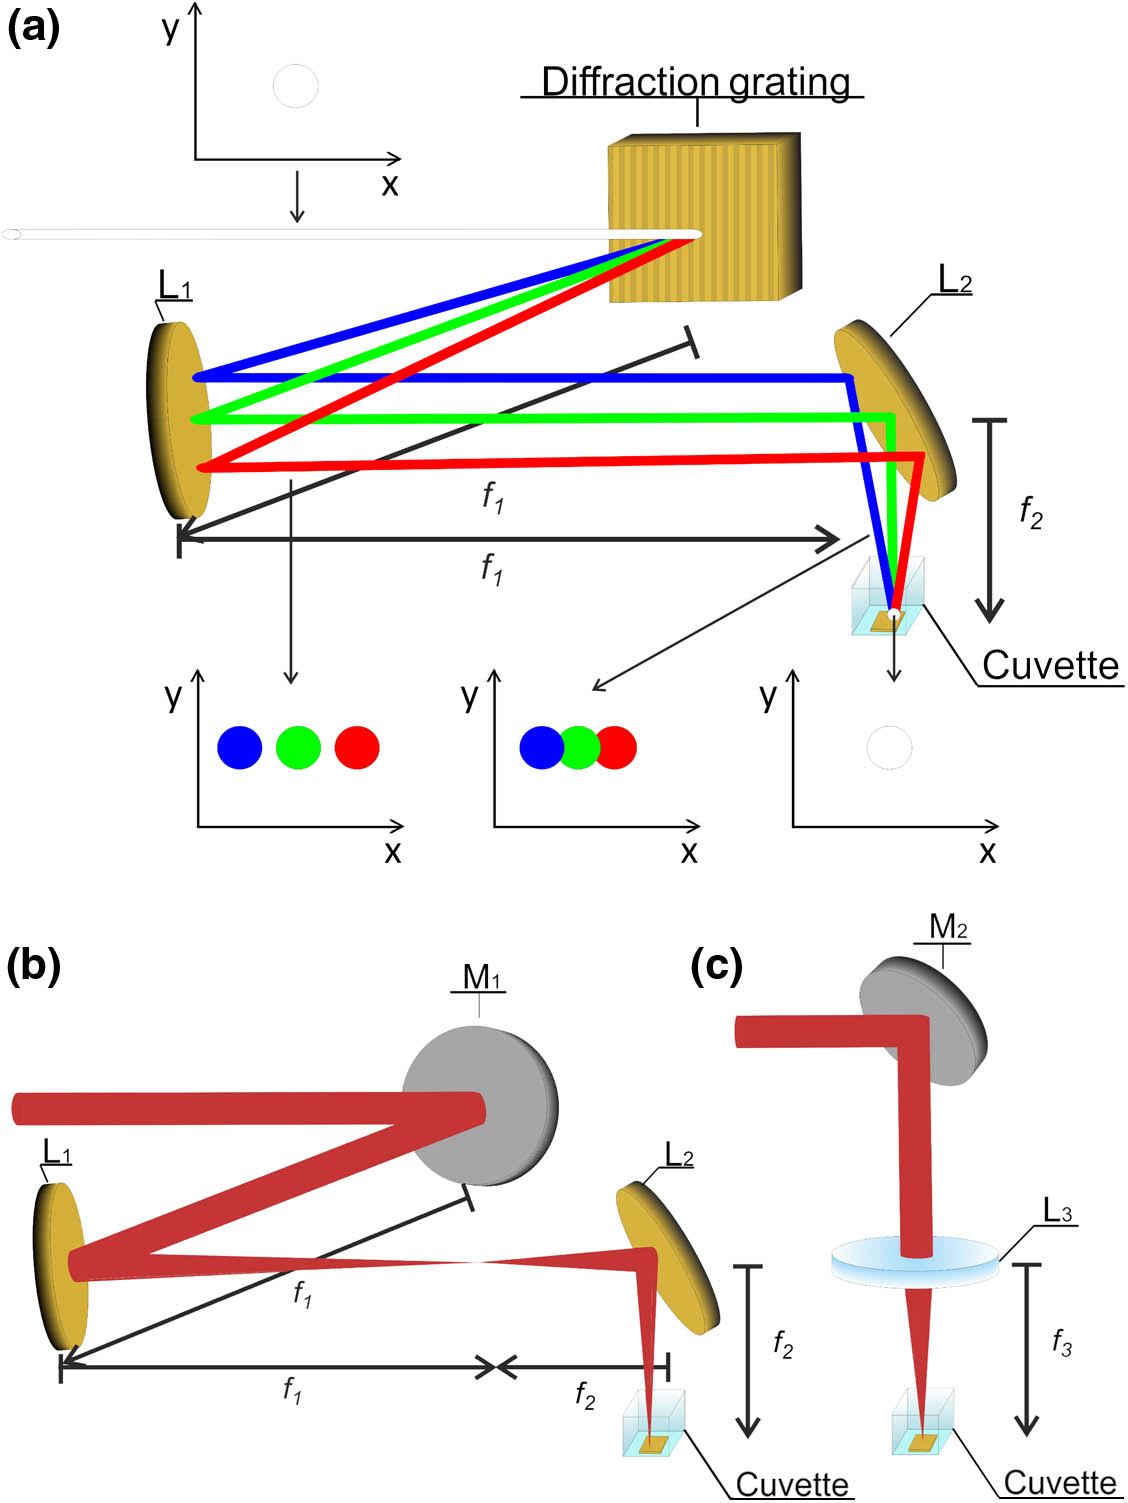
    Fig. 1. Schemes of the experimental setups employed to fabricate and compare gold nanoparticle production. (a) Image-based SSTF system based on a diffraction grating that spatially separates the broad 30 fs laser spectrum schematically displayed as red, green, and blue. Two off-axis gold mirrors form an image of the grating’s surface and achieve spatial overlap of all the wavelengths at focal spot plane. (b) Analogous image system (IOS) without spatiotemporal focusing effect. (c) Standard laser ablation in liquids system (COS) based on direct focalization of the femtosecond laser onto the target’s surface.
    Temporal characterization of the experimental setups. (a) Experimental setup employed for d-scan measurements detailed for the SSTF system. Two BK7 prisms control dispersion added to the pulses by displacing one of them. After propagation through the system a second-harmonic generation (SHG) crystal is placed in the focal spot plane of the system and the SH signal generated is acquired using a collecting lens and a fiber spectrometer. (b) D-scan trace measured for the COS. SH signal is represented as a function of the position of the movable BK7 prism. (c) D-scan trace measured for the SSTF system. (d) D-scan trace measured for the IOS.
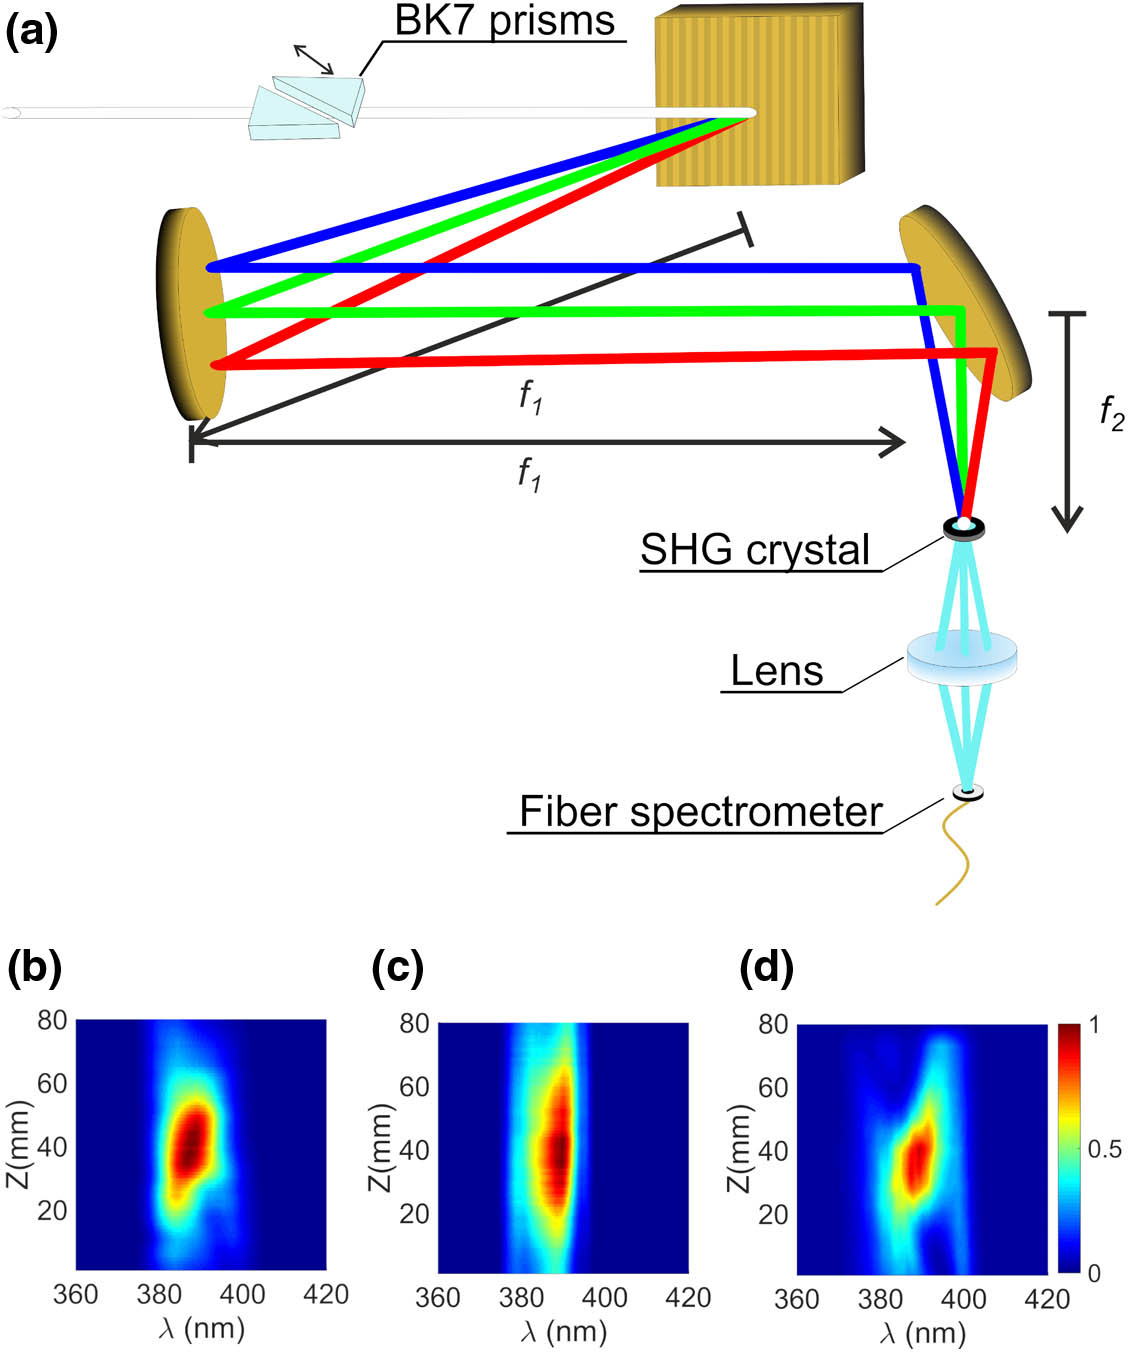
    Fig. 2. Temporal characterization of the experimental setups. (a) Experimental setup employed for d-scan measurements detailed for the SSTF system. Two BK7 prisms control dispersion added to the pulses by displacing one of them. After propagation through the system a second-harmonic generation (SHG) crystal is placed in the focal spot plane of the system and the SH signal generated is acquired using a collecting lens and a fiber spectrometer. (b) D-scan trace measured for the COS. SH signal is represented as a function of the position of the movable BK7 prism. (c) D-scan trace measured for the SSTF system. (d) D-scan trace measured for the IOS.
    Spectral and spatial characterization of the experimental setups. (a) IOS experimental measurement of the beam for several axial positions (left) and focal spot measured profile (right). (b) COS experimental measurement of the beam for several axial positions (left) and focal spot measured profile (right). (c) SSTF experimental measurement of the beam for several axial positions (left) and focal spot measured profile (right). (d) Spectral measurements performed at axial positions I, II, III, and IV corresponding to (c).
    Fig. 3. Spectral and spatial characterization of the experimental setups. (a) IOS experimental measurement of the beam for several axial positions (left) and focal spot measured profile (right). (b) COS experimental measurement of the beam for several axial positions (left) and focal spot measured profile (right). (c) SSTF experimental measurement of the beam for several axial positions (left) and focal spot measured profile (right). (d) Spectral measurements performed at axial positions I, II, III, and IV corresponding to (c).
    Pulse duration simulation and d-scan measurements. (a) D-scan pulse duration at focal spot plane for the COS. (b) D-scan pulse duration at focal spot plane for the SSTF system. (c) D-scan pulse duration at focal spot plane for the IOS. (d) IOS, COS, and SSTF systems pulse duration simulation as a function of the distance to the focal plane.
    Fig. 4. Pulse duration simulation and d-scan measurements. (a) D-scan pulse duration at focal spot plane for the COS. (b) D-scan pulse duration at focal spot plane for the SSTF system. (c) D-scan pulse duration at focal spot plane for the IOS. (d) IOS, COS, and SSTF systems pulse duration simulation as a function of the distance to the focal plane.
    Experimental characterization of the energy losses. Experimental transmittance measurements performed for a liquid layer of (a) 3 mm and (b) 7 mm. (c) Image system self-focusing distance zf as a function of the pulse energy. (d) Irradiance profile as a function of the distance to the focal plane for the IOS, COS, and SSTF systems together with the optical breakdown intensity threshold in water.
    Fig. 5. Experimental characterization of the energy losses. Experimental transmittance measurements performed for a liquid layer of (a) 3 mm and (b) 7 mm. (c) Image system self-focusing distance zf as a function of the pulse energy. (d) Irradiance profile as a function of the distance to the focal plane for the IOS, COS, and SSTF systems together with the optical breakdown intensity threshold in water.
    Gold nanoparticle synthesis and productivity evaluation. Images of the gold colloids generated for pulse energy values from I–VI for the (a) SSTF system, (b) IOS, and (c) COS. In every case energy values for I–VI are 100, 120, 140, 160, 180, and 200 μJ. (d) Productivity comparison between the IOS, COS, and SSTF for 3 mm liquid layer. (e) Productivity comparison for 3, 5, and 7 mm liquid layer using the SSTF system.
    Fig. 6. Gold nanoparticle synthesis and productivity evaluation. Images of the gold colloids generated for pulse energy values from I–VI for the (a) SSTF system, (b) IOS, and (c) COS. In every case energy values for I–VI are 100, 120, 140, 160, 180, and 200 μJ. (d) Productivity comparison between the IOS, COS, and SSTF for 3 mm liquid layer. (e) Productivity comparison for 3, 5, and 7 mm liquid layer using the SSTF system.
    Nanoparticle characterization. TEM image of the gold colloid generated for a pulse energy value of 180 μJ with the (a) SSTF system, (b) IOS, and (c) COS. (d)–(f) Corresponding histograms displaying nanoparticle size distributions from (a)–(c).
    Fig. 7. Nanoparticle characterization. TEM image of the gold colloid generated for a pulse energy value of 180 μJ with the (a) SSTF system, (b) IOS, and (c) COS. (d)–(f) Corresponding histograms displaying nanoparticle size distributions from (a)–(c).
    Carlos Doñate-Buendía, Mercedes Fernández-Alonso, Jesús Lancis, Gladys Mínguez-Vega. Overcoming the barrier of nanoparticle production by femtosecond laser ablation in liquids using simultaneous spatial and temporal focusing[J]. Photonics Research, 2019, 7(11): 1249
    Download Citation