Carlos Doñate-Buendía, Mercedes Fernández-Alonso, Jesús Lancis, Gladys Mínguez-Vega, "Overcoming the barrier of nanoparticle production by femtosecond laser ablation in liquids using simultaneous spatial and temporal focusing," Photonics Res. 7, 1249 (2019)
Copy Citation Text
There exists an increasing demand of industrial-scale production of high-purity ligand-free nanoparticles due to the continuous development of biomedicine, catalysis, and energy applications. In this contribution, a simultaneous spatial and temporal focusing (SSTF) setup is first proposed for increasing nanoparticle productivity of the eco-friendly pulsed laser ablation in liquids (PLAL) technique. In spite of the fact that femtosecond pulses have proved to achieve higher ablation rates in air than picosecond pulses, in PLAL this is reversed due to the nonlinear energy losses in the liquid. However, thanks to the incorporation of SSTF, the energy delivered to the target is increased up to 70%, which leads to a nanoparticle production increase of a 2.4 factor. This breaks a barrier toward the employment of femtosecond lasers in high-efficiency PLAL.
1. INTRODUCTION
Arising from its inherent interdisciplinarity, nanotechnology is being recognized as a new technological revolution that will affect many of the aspects of human society. Nanotechnology has answers to solve some of the grand challenges that face our society, such as energy production [1], water supply [2], climate change [3], and health [4,5]. In this context, many different routes for the synthesis of nanoparticles (NPs) have been developed. However, the industry has a high demand for methods easy to integrate in a production process, simply scalable, and with low environmental impact. Following these requirements, pulsed laser ablation in liquids (PLAL) has become a promising alternative to conventional methods for the synthesis of NPs, thanks to the simplicity of the procedure, the pureness of the NPs, the low reaction times, the synthesis from almost any raw element, the effortless in situ functionalization, and the absence of unnecessary toxic or hazardous adducts and byproducts [6–9]. In PLAL, the interaction of the laser radiation with a target immersed in a liquid directly promotes the extraction of NPs that are collected in the liquid as colloids. In this way, PLAL provides ligand-free NPs without residual chemical precursors or stabilizers avoiding the time-consuming and costly NPs cleaning treatments [10–12].
The generation of NPs with PLAL requires continuous working on its challenges, such as the fabrication of NPs with specific size and shape, the reduction of the polydispersity, and the increase of the productivity, among others. Despite some physical, chemical, and technical problems that are still unsolved, several strategies have been presented to take aim at these issues, including post-irradiation of colloids [13,14], different liquid handling configuration [15,16], optimization of the focusing conditions and liquid levels [17,18], selection of the appropriate liquid or stabilizer agent [19,20], and the optimization of the laser parameters [21]. In this sense, to explore in PLAL the wide range of opportunities that bring the unique properties of femtosecond lasers is an appealing hot topic of research not only due to the aim to increase nanoparticle production but also to generate structural modifications and new material phases only achievable with ultrafast and ultraintense pulsed radiation [22–27].
Laser ablation efficiency of femtosecond pulses in air (ablated matter volume to laser pulse energy ratio) has been proven to be higher than for its nano/picosecond counterparts [28,29]. As in PLAL methodology the target is immersed in a based fluid, the huge peak power of the ultrashort pulses causes nonlinear excitation and laser-induced breakdown in the liquid. Due to the higher nonlinear index of refraction compared to air or vacuum that liquids such as water exhibit, nonlinear effects such as self-focusing due to the Kerr effect and filamentation are produced in the liquid previous to the interaction of the ultrashort pulses with the solid target. This is a serious bottleneck that reduces up to 46% the amount of energy that is delivered to the target [30] generating a drastic reduction of nanoparticle productivity. In this paper, we demonstrate that it is possible to avoid these limitations by employing a disruptive technique, the simultaneous spatial and temporal focusing (SSTF) of femtosecond pulses. The key idea of SSTF is that the temporal pulse width becomes a function of the propagation distance, with the shortest pulse width confined to the spatial focus. SSFT was originally conceived as a novel method for increasing the field-of-view and reducing the background excitation in multiphoton imaging applications [31,32]. However, thanks to the benefits of focalizing femtosecond beams with SSTF, this technology has spread quickly to other areas, such as imaging through turbid media [33], micromachining [34], and nonlinear materials processing [35]. Up to now, a similar configuration but without taking advantage of the shorter pulse duration has been used for the synthesis of gold nanoparticles in a solution following a photo-chemical route [36–38]. But, to the best of our knowledge, SSTF has never been exploited before to increase nanoparticle production, overcoming in this way one of the main barriers in the use of femtosecond lasers in PLAL.
Sign up for Photonics Research TOC. Get the latest issue of Photonics Research delivered right to you!Sign up now
2. MATERIALS AND METHODS
A. Optical Setups for Femtosecond Pulsed Laser Ablation in Liquids
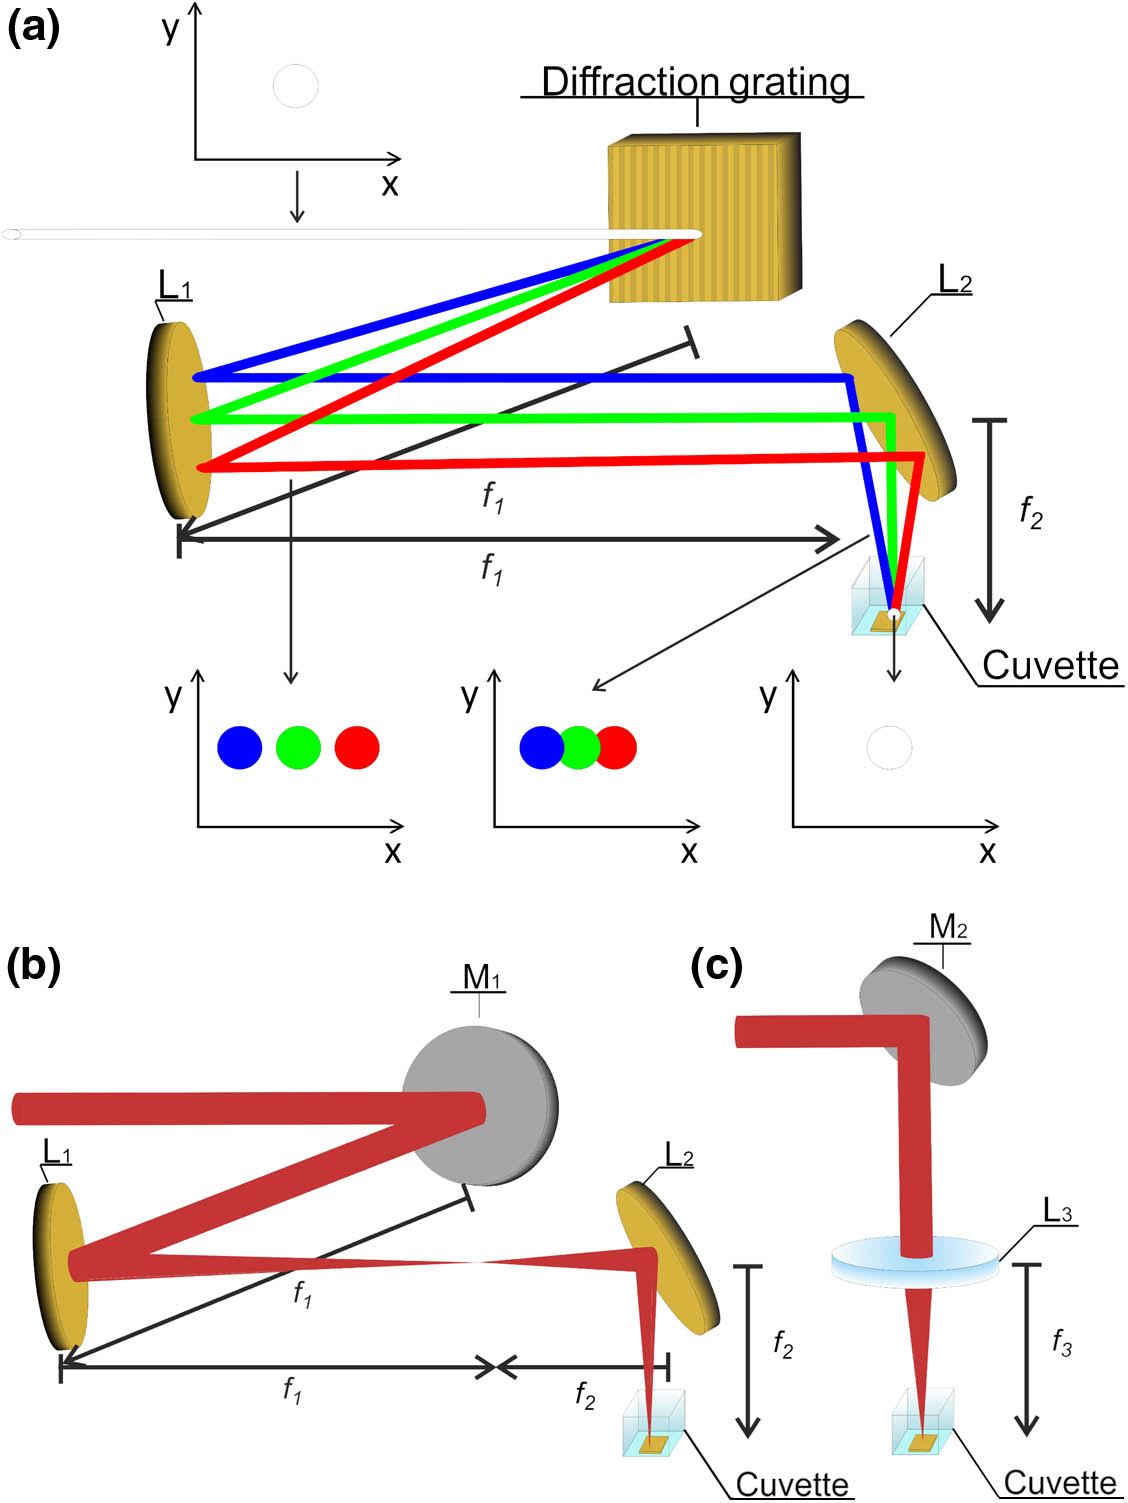
In order to study the production and the properties of the nanoparticles synthesized by femtosecond PLAL, three different optical setups are implemented. In all the setups, the laser source is an amplified Ti:sapphire laser (Femtopower Compact Pro, Femtolasers, Vienna, Austria) that generates pulses of about 30 fs pulse duration, centered at a wavelength of 800 nm, and with a repetition rate of 1 kHz. The first setup is based on the SSTF technique [31], later on referred to as the SSTF system; see Fig. 1(a). It consists of a thin 600 grooves/mm gold-coated blazed diffraction grating G1 (Richardson Gratings, 53066BK02-351R), sitting at the front focal plane of a gold off-axis mirror (Edmund, TechSpec, New Jersey, USA) of focal length . The second gold off-axis mirror of focal length is placed at the focal plane of and forms the image of the diffraction grating at the output plane. Only at the geometric focus of the different spectral components of the pulse overlap, leading to the shortest pulse duration and the highest peak intensity. At this position is where the surface of the target is placed.
Figure 1.Schemes of the experimental setups employed to fabricate and compare gold nanoparticle production. (a) Image-based SSTF system based on a diffraction grating that spatially separates the broad 30 fs laser spectrum schematically displayed as red, green, and blue. Two off-axis gold mirrors form an image of the grating’s surface and achieve spatial overlap of all the wavelengths at focal spot plane. (b) Analogous image system (IOS) without spatiotemporal focusing effect. (c) Standard laser ablation in liquids system (COS) based on direct focalization of the femtosecond laser onto the target’s surface.
The second optical setup, from now on referred to as the image optical system (IOS), is represented in Fig. 1(b). This configuration is analogous to the one of the SSTF optical setup but just replacing the diffraction grating by a plane mirror and positioning the off-axis mirrors and in a telescope configuration. Then, the chromatic dispersion is no longer present and the required conditions for temporal focusing are suppressed, while keeping the same focal spot size at the output plane. This allows a direct comparison of the temporal focusing effect on the synthesis of nanoparticles.
The third optical setup is the conventional setup used for laser ablation in liquids, later on referred to as the conventional optical system (COS). This system is based on the focalization of the collimated laser beam with a refractive lens onto the surface of the target; see Fig. 1(c). A key factor in the COS is the choice of the appropriate focal length of the focusing lens . As a simple rule of thumb, in laser ablation, the shorter the focal length, the higher the fluence (pulse energy per unit area) and the production rate. However, femtosecond PLAL presents some additional limitations, such as vaporization of the liquid layer, self-focusing, and optical breakdown, that drastically reduce ablation efficiency [17]. So for each experiment appropriate parameters must be chosen. A commonly used lens for femtosecond PLAL [22,39] that was experimentally found to be optimum for this purpose is an achromatic lens, , with a focal length , as the mentioned limiting factors are minimized.
The gold target immersed in ultrapure water (Milli-Q , Merck Millipore, Darmstadt, Germany) was placed in a quartz cuvette. The cuvette is attached to a two-dimensional motion-controlled stage (H101A, Prior, Cambridge, UK) moving at a constant speed. In every case the displacement is performed perpendicular to the laser beam in a raster scan pattern. This way, distortions of the laser beam associated with the presence of cavitation bubbles or to the plasma plume are reduced [40].
B. Femtosecond Ultrashort Laser Pulse Characterization
To completely characterize each system, the temporal, the spatial, and the spectral profiles of the laser pulse at the processing plane are measured. Temporal characterization is done by the dispersion scan (d-scan) technique [41] adapted to measure pulses in the range from 10 to 70 fs. In the d-scan technique, a phase scan of the pulse is performed by continuously increasing the glass thickness added to the beam optical path. Then, the acquisition of the second-harmonic (SH) spectra generated in the focal spot plane for each glass insertion leads to the recording of a two-dimensional trace. The trace’s information is used by the d-scan numerical iterative algorithm to retrieve the spectral phase and the pulse duration [42]. To build the d-scan technique in our lab, a pair of BK7 prisms (angle 35º), in a parallel configuration, is used to control the dispersion added to the pulse by displacing one of them using a motorized stage (PLS-85, Micos, Barcelona, Spain); see Fig. 2(a). The dispersion scan was performed with very fine sampling (100 acquired spectra, with a thickness step of about 800 μm). The SH signal from an uncoated Type I β crystal (, , ), aligned at quasi-normal incidence in the output plane, is acquired with a fiber spectrometer (HR4000, Ocean Optics, Florida, USA). Some recorded traces are shown in Figs. 2(b)–2(d).
Figure 2.Temporal characterization of the experimental setups. (a) Experimental setup employed for d-scan measurements detailed for the SSTF system. Two BK7 prisms control dispersion added to the pulses by displacing one of them. After propagation through the system a second-harmonic generation (SHG) crystal is placed in the focal spot plane of the system and the SH signal generated is acquired using a collecting lens and a fiber spectrometer. (b) D-scan trace measured for the COS. SH signal is represented as a function of the position of the movable BK7 prism. (c) D-scan trace measured for the SSTF system. (d) D-scan trace measured for the IOS.
In order to reconstruct the complete three-dimensional spatial beam profile around the processing region, a laser beam profiler (WinCamD, DataRay Inc., California, USA) is used. It is coupled to a three-axis linear stage to acquire the intensity profile at several axial positions. Finally, the spectral characterization of the pulses is performed with a fiber spectrometer (BLK-CXR-SR-50, StellarNet Inc., Florida, USA) also attached to a three-axis linear stage. The fiber has a core of 200 μm and a numerical aperture (NA) of 0.5. The relatively high numerical aperture favors the coupling of light. It should be noticed that in the SSTF setup the incidence angle is different for each wavelength, and consequently a low-NA fiber limits the measured spectrum.
C. Simulation of the Temporal Focusing Effect
To simulate the temporal focusing effect the procedure described by Zhu et al. [31] is followed. In summary, each wavelength is described as a monochromatic Gaussian beam and the paraxial propagation around the processing area is analytically performed. Then, the expression of the pulse duration as a function of the axial distance can be obtained by with parameter defined as and where is the laser spectral width, is the axial position, is the focal length of the second off-axis mirror, is the wavenumber for the central frequency of the laser spectrum, is the diameter of each monochromatic beam at plane, and is a parameter that counts for the spatial separation between each monochromatic beam at . The origin of axial position, , is considered at . At the processing plane is located, where the spatially dispersed initial laser spectrum overlaps and so the minimal pulse duration is achieved.
This model is employed to compare pulse duration as a function of the axial position for the three optical setups. It should be pointed out that only the spatial overlapping of the spectral components of the pulse is taken into account in the simulation. This approximation can be used as the increase of pulse duration caused by any other effect, as dispersion, is common in all the systems and negligible compared to the variation related to the temporal focusing effect.
D. Production and Nanoparticle Characterization
To compare the different systems, production measurements as well as the characterization of the NPs are carried out. The production is evaluated by measuring the concentration of the generated gold nanoparticles in water using UV-Vis absorbance data acquired at a wavelength of 400 nm [43]. The selection of this wavelength is not arbitrary but based on the fact that this value is not affected by the localized surface plasmon resonance of gold. To this end, Au NPs with different laser parameters were prepared and their concentration measured by inductively coupled plasma mass spectroscopy obtaining concentration values of 0.15, 0.30, 0.45, 0.75, 0.90, 1.05, 1.35, and 1.50 mmol/L. The absorbance of these samples was measured by UV-Vis. In this concentration range, there is a linear dependence of the absorbance at 400 nm with the concentration of Au NPs. Now, the concentration of unknown samples can then be easily found by measuring the absorbance at 400 nm and inserting this value in the linear fit obtained from the calibration. For our experiments, the samples were measured with a spectrophotometer (Cary 500 Scan UV-VIS-NIR Spectrometer, Varian, California, USA) in the range from 300 to 900 nm with a 10 mm path length quartz cuvette.
The morphology and size distribution of NPs were observed by transmission electron microscopy (TEM). The TEM (2100 thermionic gun lanthanum hexaboride, JEOL, Tokyo, Japan) was operating at a voltage of 200 kV. A droplet of the colloid was dispersed onto a carbon-coated copper-based TEM grid. The liquid content was dried so the solid particles remained on the grid surface. To characterize the size distribution of each sample, the acquired TEM images are computer analyzed using ImageJ software [44].
3. RESULTS AND DISCUSSION
A. Experimental Characterization of the Optical Setups
The spatial intensity profiles along the propagation axis are acquired for the three optical configurations; see Fig. 3. The fluence is defined as , where is pulse energy deposited on the immersed target and is the area of the output spot. As the fluence is directly related to the nanoparticle production [45], for the same spot size, a lower productivity indicates energy losses in the liquid layer due to nonlinear effects. In our setup the spot diameters at full width at half-maximum (FWHM) for the three systems in air are: μ, μ, and μ. The SSTF and IOS exhibit the same output spot size; this fact allows a perfect comparison between both systems for studying energy losses during propagation through the liquid layer. The focal spot of the COS is smaller than the one of the SSTF, which would potentially produce a higher fluence in the COS. The other key parameter for the optical system is the NA. The NA is calculated as , where D is the beam diameter at the last optical component and f its focal length. Lower-NA beams are strongly susceptible to nonlinear effects, such as self-focusing or supercontinuum. In our setups, , , and in the axis and , , and in the axis. Note that the only system where the NA depends on the axis is the SSTF, as the spatial chromatic dispersion is applied. Hence, taking into account these spatial focusing conditions, the parameters in the IOS and COS are chosen in order to support a fair comparison with the SSTF.
Figure 3.Spectral and spatial characterization of the experimental setups. (a) IOS experimental measurement of the beam for several axial positions (left) and focal spot measured profile (right). (b) COS experimental measurement of the beam for several axial positions (left) and focal spot measured profile (right). (c) SSTF experimental measurement of the beam for several axial positions (left) and focal spot measured profile (right). (d) Spectral measurements performed at axial positions I, II, III, and IV corresponding to (c).
Temporal characterization of the pulse at the focal plane is performed by means of the d-scan technique for the COS, IOS, and SSTF systems. The results show that the COS exhibits a pulse duration at FWHM of , very similar to the value obtained for the IOS, , while for the SSTF it is ; see Figs. 4(a)–4(c). Theoretically, the temporal duration for every system should be expected to be the same as the group delay dispersion is compensated for every system and slight differences are caused by higher-order phase terms. These experimental differences are attributed mainly to two causes. The first one is related to the spherical aberrations caused by the focusing optics that directly affect the spatial overlap of the spectral components at the focal spot. The second one is the coupling of all the spectral components in the optical fiber of the spectrometer that can be limited by its numerical aperture, producing a broader temporal profile for the SSTF system. The spatial aberrations produce a real pulse width increase, while the loose of spectral components due to the fiber NA only generate an apparent pulse enlargement in the d-scan measurement, being the real pulse width shorter. Hence, the given value represents the upper pulse width limit and the real pulse width can be closer to and .
Figure 4.Pulse duration simulation and d-scan measurements. (a) D-scan pulse duration at focal spot plane for the COS. (b) D-scan pulse duration at focal spot plane for the SSTF system. (c) D-scan pulse duration at focal spot plane for the IOS. (d) IOS, COS, and SSTF systems pulse duration simulation as a function of the distance to the focal plane.
Pulse duration evolution as a function of the target position is theoretically calculated (details can be found in the Materials and Methods section). In the case of the IOS and COS, the pulse duration is constant with the axial position of the target; see Fig. 4(d). This is due to the fact that the spectral content of the beam does not depend on the position. In both systems, the measured spectrum around the focal plane is always the complete laser spectrum. However, in the case of the SSTF system the chromatic dispersion induced by the diffraction grating generates a spatial dependence of the spectral content; see Fig. 3(d). This dependence causes the variation of the pulse duration with the axial distance, as can be observed in Fig. 4(d).
B. Quantification of the Energy Delivered to the Target
To quantify the energy losses associated with each optical setup, transmittance through 3 and 7 mm water layers for different laser powers from 20 to 200 mW is measured; see Fig. 5. The transmittance is defined as the fraction of incident energy that is transmitted through the water layer. In the SSTF system its value is about 95% and it is constant even for different water layers and laser powers. For the IOS there exists a region of low energy where the transmittance is 95% and then it drops to a minimum of 60% for 200 mW and 7 mm liquid layer. In the COS the transmittance is constant and lower, around 30%–45% in every case.
Figure 5.Experimental characterization of the energy losses. Experimental transmittance measurements performed for a liquid layer of (a) 3 mm and (b) 7 mm. (c) Image system self-focusing distance as a function of the pulse energy. (d) Irradiance profile as a function of the distance to the focal plane for the IOS, COS, and SSTF systems together with the optical breakdown intensity threshold in water.
To further understand the differences observed in transmittance, the main processes involved in the energy losses are considered, filamentation and optical breakdown. These effects cause an energy loss together with the distortion of the focal spot. Filamentation occurs when the pulse experiences a complex nonlinear propagation in which self-focusing (optical Kerr effect) and laser-induced ionization dynamically interact to produce self-guiding of the pulses for distances larger than the Rayleigh length [46]. This propagation of the pulse along the liquid leads also to an extreme spectral broadening known as supercontinuum generation. The power threshold for filamentation is the same as the critical power, , for self-focusing and it is given by [47]where is the wavelength for the maximum of the spectrum, is the refractive index, and is the nonlinear refractive index of the material [48]. The value obtained with our laser for water (, , and ) is , which is exceeded in the IOS and COS with an average power of just few tens of milliwatts.
Taking into account this consideration, filamentation should appear in the three proposed systems. However, the transmittance values measured for the IOS at low energies prove that no filament and no energy losses appear in the experiment in all the circumstances. Consequently, it is suggested that the self-focusing collapse distance, , more than the itself, is the key parameter to understand filamentation appearance. The collapse distance is provided by [47]Normally, as the laser beam self-focuses, the intensity rises and eventually becomes sufficient to nonlinearly ionize electrons; however, if is larger than the liquid layer this phenomenon no longer occurs and the filament is not activated [49,50]. This hypothesis is supported by the experimental findings, Figs. 5(a) and 5(b), where the beginning of transmittance reduction for every liquid layer is directly related with the average power value where equals the layer thickness; see Fig. 5(c). In the case of the SSTF system the average power also exceeds , nevertheless the variation of pulse duration with the axial distance avoids filamentation generation in the liquid, as is larger than 20 mm.
Optical breakdown has a disruptive character and in aqueous media its threshold is defined by bubble formation [51]. The absorbed energy in optical breakdown follows different paths that are the evaporation of the focal volume, the plasma radiation, and the mechanical effects, such as shock wave emission and cavitation. Optical breakdown generation is related to the delivered intensity, that is defined as where is the fluence and is the pulse duration. The threshold of optical breakdown in water is [52]. This effect predominates in the COS due to the higher NA and intensity values; see Fig. 5(d). It is straightforward to notice that for the SSTF system the intensity is drastically reduced out of the output plane [see Fig. 5(d)] due to the increase of pulse duration and the larger beam area. However, in the case of the COS and IOS, as pulse duration does not vary with the axial position, the intensity only depends on the change of the beam area while it is focalized. In addition, the intensity threshold for optical breakdown in water [53] clearly evidences that SSTF can reduce the generation of this effect out of the focal spot even if the peak intensity was higher than the threshold value, as with an axial displacement of 50 μm the intensity decreases more than an order of magnitude. This implies that using the SSTF, the focal spot position can be adjusted on the target’s surface to avoid optical breakdown and filamentation in the liquid, while in the other systems these effects and the consequent energy losses are always produced.
C. Productivity
In order to evaluate and compare nanoparticle production in the three different optical systems, ablation of gold targets immersed in water is performed for six different energy values and a liquid layer of 3 mm. The fluence values associated with these energies are calculated based on the focal spot sizes in air measured in Fig. 3 and range from to for the IOS and SSTF and to for the COS. The reduced liquid layer was chosen to benefit the IOS and COS as energy losses are lower. In the three systems, the scan velocity was set to 0.75 mm/s. However, nanoparticle production in IOS was so tiny and difficult to evaluate that for this system it was changed to 0.25 mm/s, leading to a three times longer processing time, to increase nanoparticle production.
A visual inspection of the colloids obtained with the three systems evidences the increased production achieved with the SSTF, as it is shown in Figs. 6(a)–6(c). To quantify the differences, UV-Vis measurements are acquired and the concentrations are calculated. The productivity (ablated mass per ablation time interval) for every system and pulse energy value is displayed in Fig. 6(d). In comparison with the IOS, the production rate in SSTF is increased by a factor that ranges from 3 at 120 μJ to 9.4 at 180 μJ. If the comparison is with the COS, the production rate is improved by a factor of 1.7 at 120 μJ up to 2.4 at 180 μJ. The increase of the productivity factor with the pulse energy is directly associated with the higher energy losses in the IOS and COS. The value obtained for the pulse energy of 200 μJ is not compared as the high concentration obtained with the SSTF is shielding the laser beam previous to the incidence on the gold target, thus limiting nanoparticle production. This limitation is easily overcome by increasing liquid volume or with a flow configuration.
Figure 6.Gold nanoparticle synthesis and productivity evaluation. Images of the gold colloids generated for pulse energy values from I–VI for the (a) SSTF system, (b) IOS, and (c) COS. In every case energy values for I–VI are 100, 120, 140, 160, 180, and 200 μJ. (d) Productivity comparison between the IOS, COS, and SSTF for 3 mm liquid layer. (e) Productivity comparison for 3, 5, and 7 mm liquid layer using the SSTF system.
To evaluate the effect of the liquid layer over the SSTF system, the processing is performed with three different water layers, i.e., 3, 5, and 7 mm using the SSTF system, see Fig. 6(e), where the error bars have been avoided for clear visualization but are comparable to the ones shown for SSTF in Fig. 6(d). The obtained results evidence that the liquid layer is not affecting nanoparticle production rate, indicating that SSTF ensures an equal energy delivered to the gold target even if the liquid layer thickness is modified.
D. Nanoparticle Characterization
Finally, the synthesized nanoparticles for a 3 mm liquid layer and 180 μJ are analyzed using TEM to compare the morphology and size distributions. As evidenced in Fig. 7, the SSTF generated nanoparticles show a population of and a second one of . The COS exhibits also two populations, the main one with and the second one with . The mean particle size is similar in both systems, but the size dispersion is higher in the COS. This fact can be attributed to the suppression of the nonlinear effects in the SSTF configuration, thus modifying the interaction between the liquid and the target [37]. The higher fluence used in the COS is also a factor that leads to a larger size dispersion [22]. The IOS nanoparticles also exhibit a bimodal distribution with and . The reduction of the nanoparticle size is attributed to the lower fluence [39] achieved at the focal spot in the IOS due to the bigger focal spot compared to the COS and the reduction of the energy delivered to the target compared to SSTF.
Figure 7.Nanoparticle characterization. TEM image of the gold colloid generated for a pulse energy value of 180 μJ with the (a) SSTF system, (b) IOS, and (c) COS. (d)–(f) Corresponding histograms displaying nanoparticle size distributions from (a)–(c).
In the development of this work, the SSTF technique has been employed for the first time achieving on focus femtosecond laser pulses for nanoparticle generation by pulsed laser ablation in liquids. The performance of this system is evaluated against an analogous optical system and the standard processing system leading to a productivity increase of 9.4 and 2.4 factors. This enhancement is proved to be achieved even for a higher fluence of the COS and a 3 times longer processing time in the IOS. To evaluate these differences, spatial and temporal characterization of the systems is performed. Evaluation of the energy losses in the interaction with the liquid reveals that the maximum energy loss for the COS is 70% and 40% for the IOS, while in the SSTF it is only 5%. These results are justified in terms of filamentation and optical breakdown, taking into account the threshold and limiting parameters for these nonlinear interactions. The losses in the surrounding liquid media explain the outstanding performance of the SSTF due to the improved delivery of the energy to the target. The results prove SSTF as a technique suitable for overcoming PLAL limitations when femtosecond pulses are employed. It implies that the efforts for nanoparticle production increase can also focus on the employment of femtosecond lasers. In that sense, it reveals a new paradigm where the existing aim for achieving shorter and more powerful pulsed lasers is the response for increasing nanoparticle production by laser ablation in liquids and could lead to unprecedented production rates. This fact would have a huge impact in the nanotechnology field as the advantages of laser generated nanoparticles as high purity and the possibility of generating colloids from a wide variety of materials and liquids could be also applied to industrial and large-scale processes where production is a limiting factor.
Acknowledgment
Acknowledgment. The authors are very grateful to the ‘Serveis Centrals d’Instrumentación Científica (SCIC) of the University Jaume I for the use of the femtosecond laser and microscopy facilities. Authors also thank Miguel Carbonell Leal for his contribution to the development of the software for temporal pulse characterization.
Carlos Doñate-Buendía, Mercedes Fernández-Alonso, Jesús Lancis, Gladys Mínguez-Vega, "Overcoming the barrier of nanoparticle production by femtosecond laser ablation in liquids using simultaneous spatial and temporal focusing," Photonics Res. 7, 1249 (2019)