• Photonics Research
  • Vol. 12, Issue 4, 730 (2024)
Jiarui Li1, Taoran Le1, Hongyuan Zhang2, Haoyun Wei1, and Yan Li1、*
Author Affiliations
  • 1State Key Laboratory of Precision Measurement Technology and Instruments, Department of Precision Instrument, Tsinghua University, Beijing 100084, China
  • 2Cole Eye Institute, Cleveland Clinic, Cleveland, Ohio 44195, USA
  • show less
    DOI: 10.1364/PRJ.509922 Cite this Article Set citation alerts
    Jiarui Li, Taoran Le, Hongyuan Zhang, Haoyun Wei, Yan Li. High-speed impulsive stimulated Brillouin microscopy[J]. Photonics Research, 2024, 12(4): 730 Copy Citation Text show less
    Schematic of ISBS with heterodyne detection. TG, transmission grating; L1 and L2, lenses; PA, phase adjustment plate.
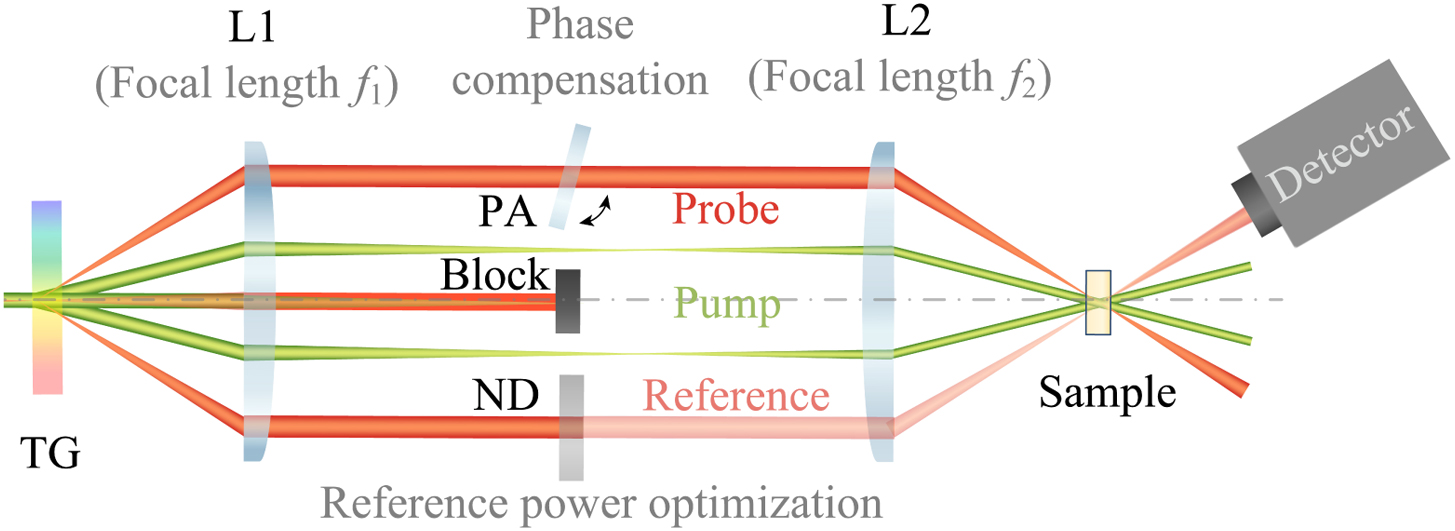
    Fig. 1. Schematic of ISBS with heterodyne detection. TG, transmission grating; L1 and L2, lenses; PA, phase adjustment plate.
    Key parameters affecting the SNR. (a) Experimental spectral peak for ethanol spectra at different PA angles. (b) Experimental SNR and theoretical fitting for methanol spectra acquired with varying power ratios Rref between the reference and the probe. (c) Simulated time-domain signal of PDMS and (d) corresponding spectra at three acquisition times. (e) Spectral SNRs of simulated signals at various acquisition times and the theoretical fitting results.
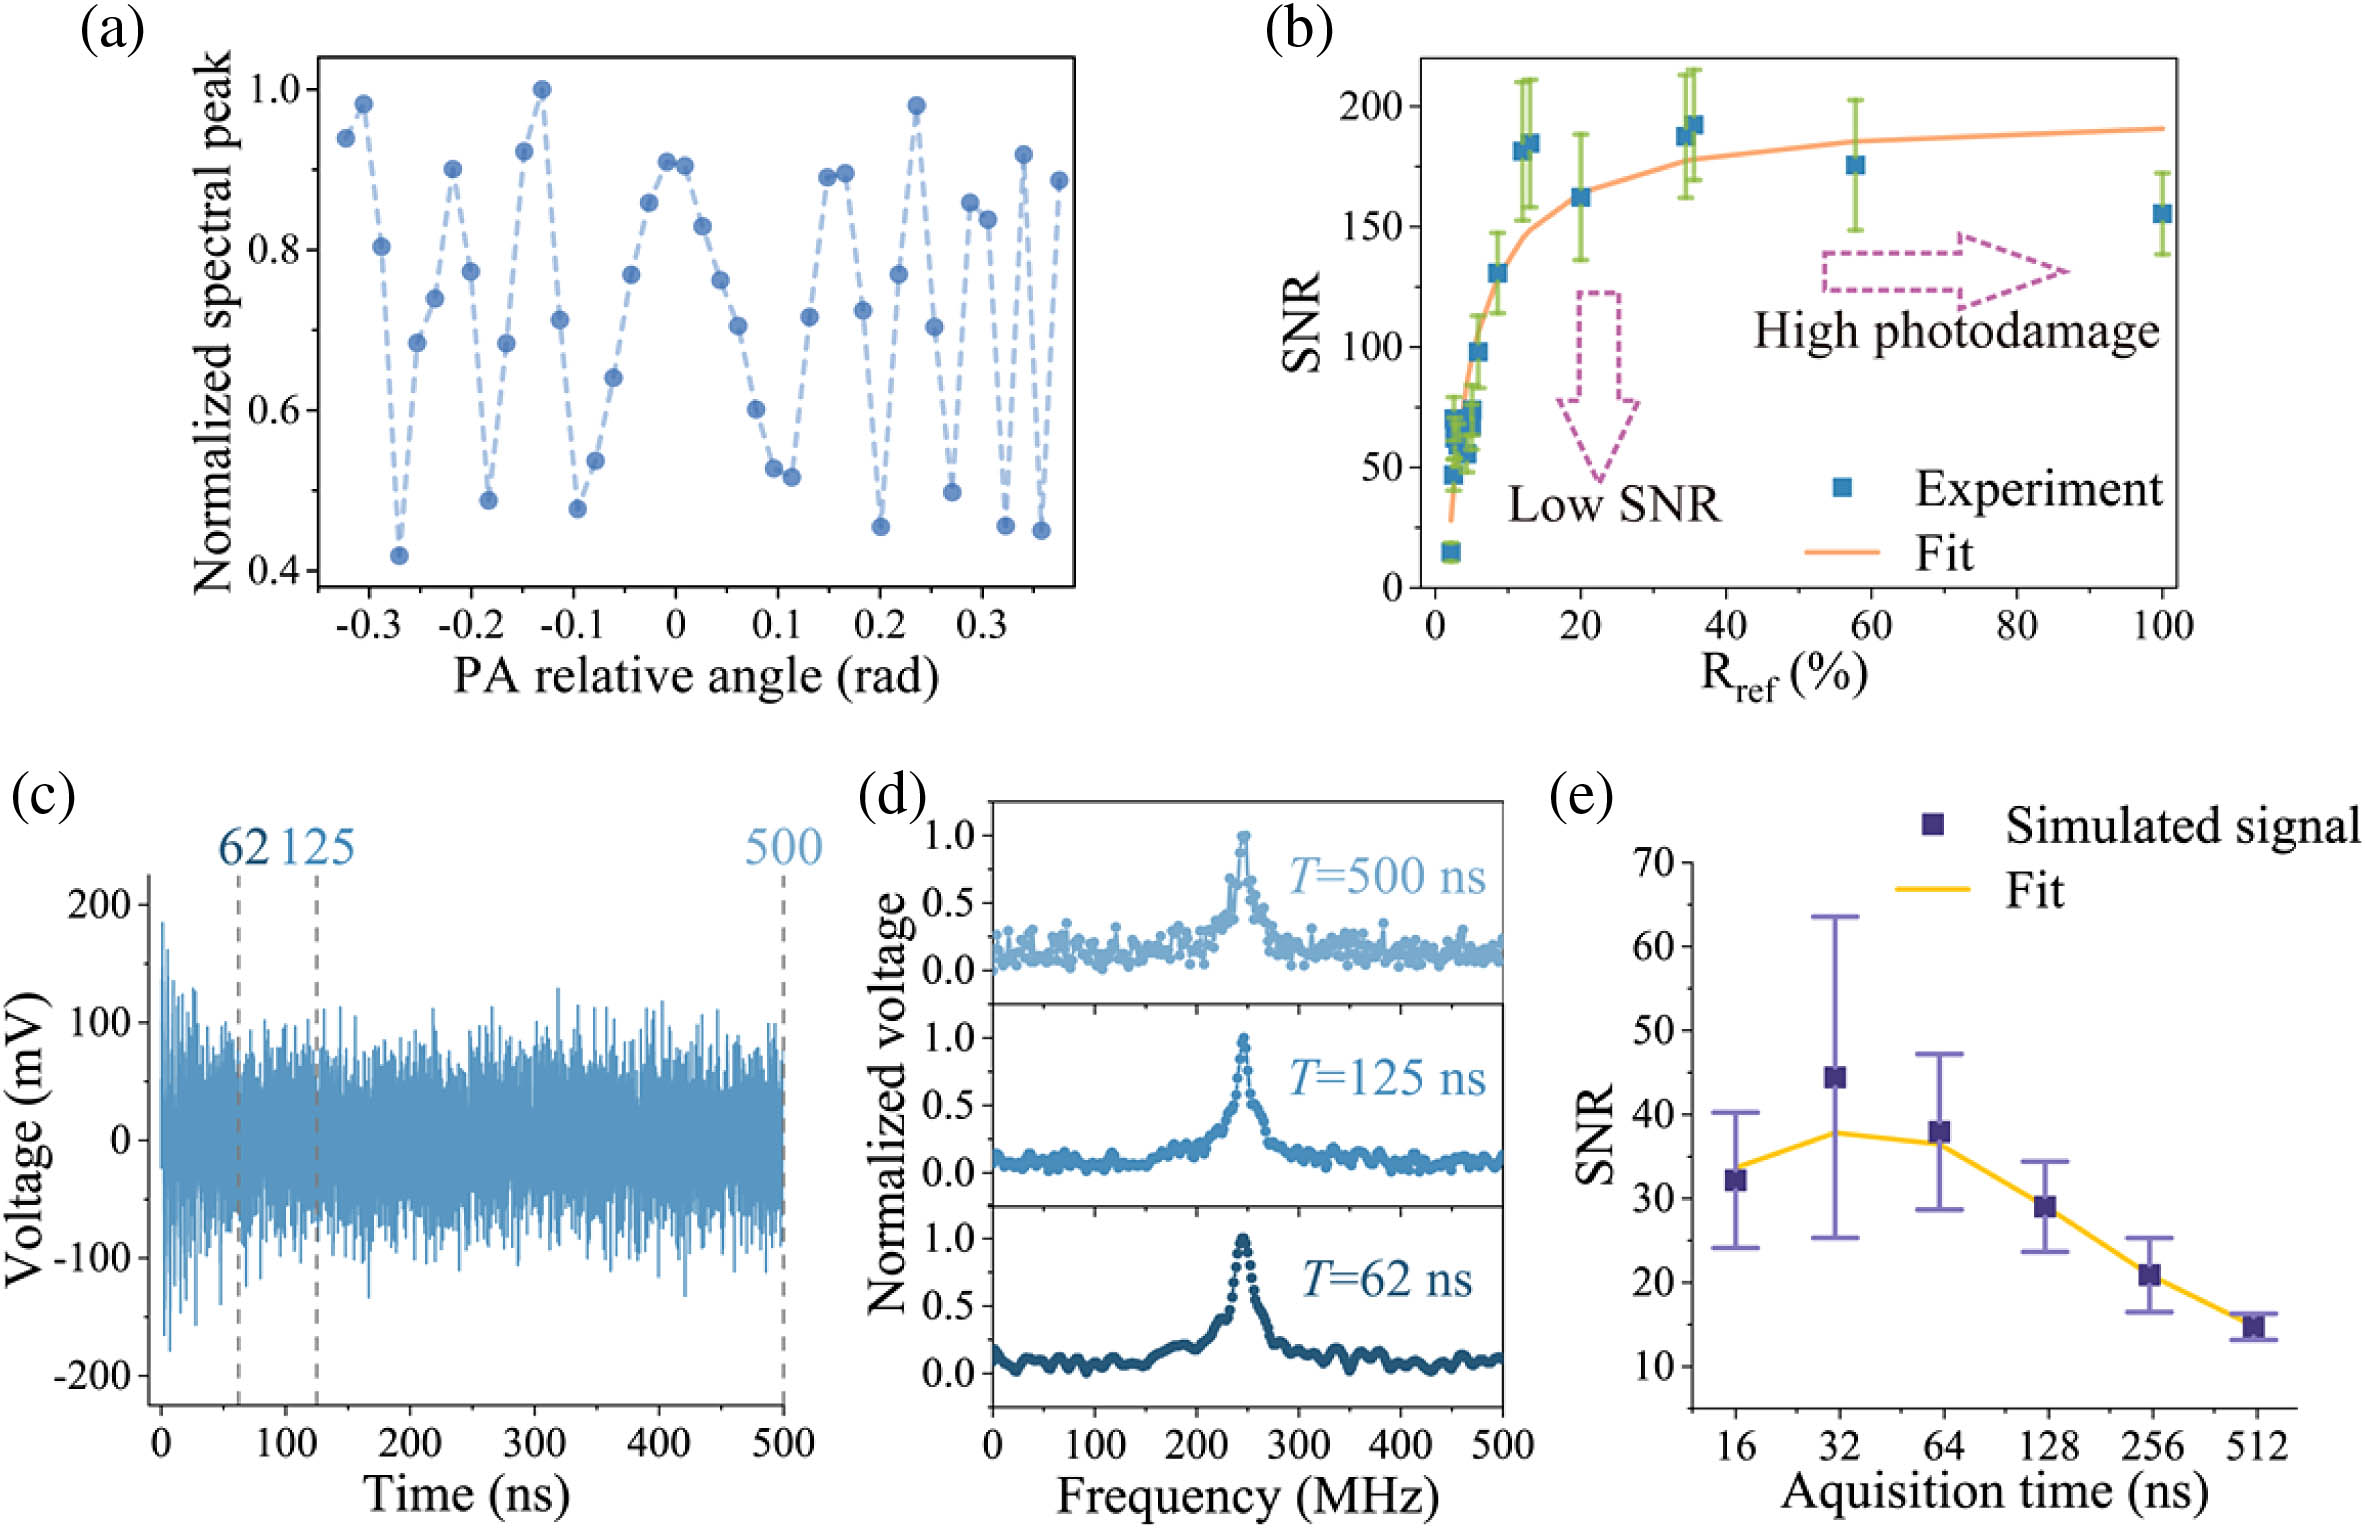
    Fig. 2. Key parameters affecting the SNR. (a) Experimental spectral peak for ethanol spectra at different PA angles. (b) Experimental SNR and theoretical fitting for methanol spectra acquired with varying power ratios Rref between the reference and the probe. (c) Simulated time-domain signal of PDMS and (d) corresponding spectra at three acquisition times. (e) Spectral SNRs of simulated signals at various acquisition times and the theoretical fitting results.
    (a) Setup of the heterodyne ISBS microscope. M1–M6, mirrors; HWP1 and HWP2, half-wave plates; PBS1 and PBS2, polarizing beam splitters; L1–L6, spherical lenses; CL, cylindrical lens; ND1 and ND2, neutral density filters; DM, dichroic mirror; TG, transmission grating; PA, phase adjustment plate; BP, 780 nm bandpass filter; PD1 and PD2: photodetectors. (b) Spot size of the pump and the probe on the focal plane. (c) Rref optimization at the set measurement parameters for imaging. (d) Sample schematic.
    Fig. 3. (a) Setup of the heterodyne ISBS microscope. M1–M6, mirrors; HWP1 and HWP2, half-wave plates; PBS1 and PBS2, polarizing beam splitters; L1–L6, spherical lenses; CL, cylindrical lens; ND1 and ND2, neutral density filters; DM, dichroic mirror; TG, transmission grating; PA, phase adjustment plate; BP, 780 nm bandpass filter; PD1 and PD2: photodetectors. (b) Spot size of the pump and the probe on the focal plane. (c) Rref optimization at the set measurement parameters for imaging. (d) Sample schematic.
    Immunity of the MP method to spectral broadening and sidebands caused by insufficient acquisition time. (a) Simulated time-domain signal of methanol and (b) corresponding FFT and MP spectra at three acquisition times and the comparison with the standard Brillouin peak. (c) Linewidths at different acquisition times deciphered using the FFT spectra and the MP method, and the comparison with standard values.
    Fig. 4. Immunity of the MP method to spectral broadening and sidebands caused by insufficient acquisition time. (a) Simulated time-domain signal of methanol and (b) corresponding FFT and MP spectra at three acquisition times and the comparison with the standard Brillouin peak. (c) Linewidths at different acquisition times deciphered using the FFT spectra and the MP method, and the comparison with standard values.
    High-speed ISBS spectroscopy. (a) Comparison of PDMS signals before and after phase compensation and (b) corresponding FFT spectra. (c) Time-domain signals of PDMS and methanol, and (d) corresponding spectra at an acquisition time of 241 ns and (e) 67 ns. The blue spectra represent the FFT results, and the orange and green spectra are MP-deciphered Brillouin peaks of PDMS and methanol, respectively.
    Fig. 5. High-speed ISBS spectroscopy. (a) Comparison of PDMS signals before and after phase compensation and (b) corresponding FFT spectra. (c) Time-domain signals of PDMS and methanol, and (d) corresponding spectra at an acquisition time of 241 ns and (e) 67 ns. The blue spectra represent the FFT results, and the orange and green spectra are MP-deciphered Brillouin peaks of PDMS and methanol, respectively.
    ISBS imaging at a spectral integration time of 0.3 ms per pixel for the PDMS sample immersed in methanol. (a) Mapping results of Brillouin shift, linewidth, spectral amplitude, and corresponding histograms, with and (b) without phase compensation, where the short white line is a 50 μm scale, and the orange and green curves represent the Gaussian fitting of PDMS and methanol, respectively.
    Fig. 6. ISBS imaging at a spectral integration time of 0.3 ms per pixel for the PDMS sample immersed in methanol. (a) Mapping results of Brillouin shift, linewidth, spectral amplitude, and corresponding histograms, with and (b) without phase compensation, where the short white line is a 50 μm scale, and the orange and green curves represent the Gaussian fitting of PDMS and methanol, respectively.
    Three-dimensional imaging results through the high-speed ISBS microscope. (a) Mapping results of Brillouin shift, linewidth, and normalized spectral amplitude. (b) BLT images and corresponding histograms. The orange and green curves represent the BLT distribution of PDMS and methanol, respectively.
    Fig. 7. Three-dimensional imaging results through the high-speed ISBS microscope. (a) Mapping results of Brillouin shift, linewidth, and normalized spectral amplitude. (b) BLT images and corresponding histograms. The orange and green curves represent the BLT distribution of PDMS and methanol, respectively.
    Jiarui Li, Taoran Le, Hongyuan Zhang, Haoyun Wei, Yan Li. High-speed impulsive stimulated Brillouin microscopy[J]. Photonics Research, 2024, 12(4): 730
    Download Citation