 AI Video Guide
  AI Picture Guide
 AI One Sentence

Jiarui Li, Taoran Le, Hongyuan Zhang, Haoyun Wei, Yan Li, "High-speed impulsive stimulated Brillouin microscopy," Photonics Res. 12, 730 (2024)
- Photonics Research
- Vol. 12, Issue 4, 730 (2024)
Note: This section is automatically generated by AI . The website and platform operators shall not be liable for any commercial or legal consequences arising from your use of AI generated content on this website. Please be aware of this.
Abstract
1. INTRODUCTION
Mechanical properties play a critical role in connecting the mechanics of the microenvironment to the behavior of cells and tissues, allowing for the translation of mechanical stimuli into biochemical signals [1–3]. While there is significant progress in our understanding of biochemical signaling, the study of biomechanical interactions has been hindered by limited methods with a high spatial resolution and without contact. Based on the interaction of light and acoustic phonons, Brillouin microscopy maps the spatial distribution of the elastic modulus by deriving the frequency information of scattered light, providing a non-contact and label-free approach to reveal what viscoelasticity is encountered in different regions at high resolution [4,5]. This emerging technique has made initial contributions to ocular biomechanics [6–8], tumor biology [9], and developmental biology [10,11]. The demand for faster Brillouin microscopy in biomechanics has become increasingly urgent, particularly in volumetric imaging and the analysis of rapid processes, making fast measurement a focal issue [9,11,12]. However, the measurement speed of existing instruments still needs improvement.
Despite significant advancements in the applications of biomechanical imaging [5,13–15] and in vivo diagnostics [8,16,17] over the past decade, confocal spontaneous Brillouin microscopy has almost reached the speed limit (20 ms/spectrum) due to the weak spontaneous interaction process. Many efforts have been made to overcome this speed limitation. In terms of optical architecture, the line-scanning Brillouin microscopy enables the interaction between light and spontaneous acoustic phonons in a line and the simultaneous detection of several hundred pixels in the vertical direction [9,11,12], achieving a measurement speed of 1 ms per Brillouin spectrum, but with limited spectral resolution. In terms of excitation principles, stimulated Brillouin microscopy with a pump-probe scheme efficiently excites resonant phonons [10,18,19], yet its potential for speed enhancement is limited by the insufficient utilization of nonlinear interaction by continuous wave (CW) sources (5 ms/spectrum). In this case, a pulsed nonlinear scattering scheme will address these issues.
Impulsive stimulated Brillouin scattering (ISBS) microscopy [20–22], assisted with pulsed excitation beams, has the potential to obtain a Brillouin spectrum in a single shot. A pair of pump pulses excites the acoustic wave, the CW probe is scattered in the focal volume, and the scattered light describes the acoustic oscillations in the time domain. Assisted with another CW reference beam, the heterodyne detection architecture allows for enhanced efficiency. After transforming this time-domain heterodyne signal through the fast Fourier transformation (FFT) and spectral fitting, the elasticity and viscosity of the material in the focal volume can be derived from the frequency shift and linewidth of the Brillouin peak, respectively. However, due to the low signal-to-noise ratio (SNR) of a single-shot excitation, the measurement speed of ISBS is hindered by the need for multiple averages, even with sufficient source power. To speed up the measurement, the Matrix Pencil (MP) method, a time-domain spectral analysis method, is introduced to ISBS spectrometers for a higher noise suppression ability and fewer averaging times [23], but the application of this system is still limited to liquid samples due to its high photodamage, and the restricted spatial resolution prevents it from achieving microscopic imaging. Higher spatial resolution often corresponds to a larger divergence angle because the spatial resolution of the ISBS system is related to the spot size of the probe beam on the focal plane, which requires a focusing lens with a large numerical aperture and short focal length. However, the maximum scattering efficiency can only be achieved when the incident angle of the probe is at the Bragg angle, where the probe, scattered light, and acoustic field satisfy the momentum-matching condition. Therefore, increasing spatial resolution comes with a decrease in ISBS efficiency. To achieve higher spatial resolution for three-dimensional microscopic ISBS imaging while maintaining spectral precision, further optimization of the SNR is necessary.
Sign up for Photonics Research TOC. Get the latest issue of Photonics Research delivered right to you!Sign up now
In this paper, we develop an SNR enhancement solution for time-domain Brillouin signals, with the assistance of an SNR model and corresponding multi-parameter optimization. An ISBS microscope is accordingly designed to deliver a two-order enhancement in speed, a tenfold increase in spatial resolution, and reduced photodamage compared to state-of-the-art ISBS microscopes. We perform optimized phase compensation, reference power ratio, and acquisition time, achieving a 15.6 dB SNR for the Brillouin spectrum of a hydrogel sample under an integration time of 0.3 ms and total optical energy of tens of microjoules, while maintaining a spectral precision of 1 MHz with the assistance of the MP method. Furthermore, this time-domain data processing method is immune to spectral broadening and sidebands caused by acquisition time optimization, thus preserving the high spectral resolution advantage of ISBS. On this basis, three-dimensional imaging, with a spatial resolution of
2. PRINCIPLE, THEORY, AND VERIFICATION
A. ISBS and Mechanical Properties
In the stimulated Brillouin scattering process with pump and probe beams, the phonons experience resonant amplification. The coupling of the optical and acoustic fields can generate scattering signals stronger than the spontaneous process and essentially unaffected by the elastic background. Based on this nonlinear process, ISBS employs a pair of ultra-short pulses to pump acoustic waves and a CW laser to probe. Due to the broadband feature of pump pulses, various frequency differences exist between the two interfering pump beams. According to the conservation of energy and momentum, this allows resonance with multiple phonon modes and excites a pair of counter-propagating acoustic waves. The combination of a transmission grating (TG) with a period of
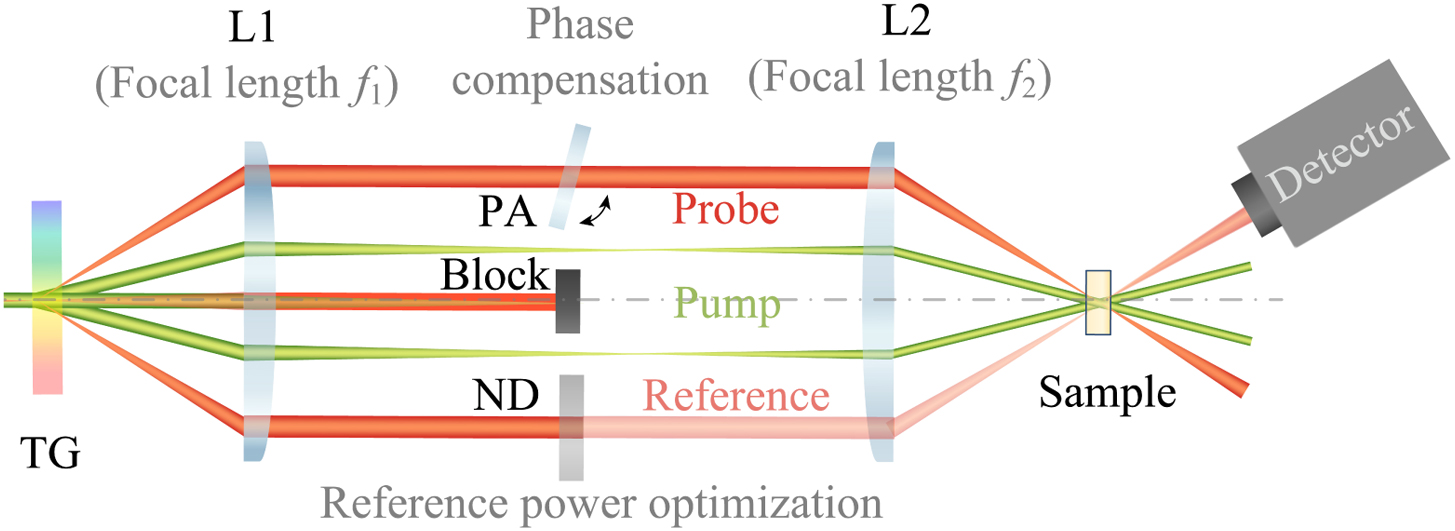
Figure 1.Schematic of ISBS with heterodyne detection. TG, transmission grating; L1 and L2, lenses; PA, phase adjustment plate.
According to the detection scheme for scattered light, current ISBS spectrometers can be classified into non-heterodyne and heterodyne configurations. In non-heterodyne mode, the scattered light of the probe is directly detected, resulting in a measured Brillouin frequency shift
The spectral characteristics of Brillouin-scattered light reflect the propagation properties of acoustic waves in the material, which in turn are related to the material’s viscoelasticity. Based on the spectral information, the real and imaginary parts of the complex longitudinal modulus of the material can be given by [25]
B. SNR Model of Heterodyne ISBS
In ISBS spectroscopy, increasing the SNR of the signal obtained from a single pulse excitation allows high spectral precision with fewer averages, thereby speeding up the measurement. By establishing a theoretical model for SNR, we can analyze the key parameters and accordingly design the ISBS system to achieve the optimal SNR. According to Eq. (1), the reference beam assists in amplifying weak signals and reducing common-mode noise, but its effect on improving SNR also depends on the noise characteristics of the system. The main sources of noise for a heterodyne ISBS spectrometer are dark current noise, shot noise, and thermoelectrical noise, all of which exhibit characteristics of white noise in the spectral domain. Among them, dark current noise and thermoelectrical noise are both independent of the incident light power and can be simplified as a constant background noise
On this basis, the spectral SNR can be optimized in terms of the following aspects.
1. Phase Mismatch and Compensation
In the heterodyne detection scheme, either the attenuation plate in the reference beam or the tilting of the sample may introduce an additional phase difference
To validate this theory, ISBS signals of ethanol are measured at 41 different PA angles with an interval of 1°. In Fig. 2(a), the spectral peak varies with angle, showing that the spectral peak reaches its local maximum value at multiple angles, consistent with the theoretical expectations. According to Eq. (5), since the noise is mainly influenced by the power of the reference beam and is hardly affected by the weak heterodyne signals of the probe and reference, the addition of phase compensation avoids the SNR loss due to phase mismatch.
![]()
Figure 2.Key parameters affecting the SNR. (a) Experimental spectral peak for ethanol spectra at different PA angles. (b) Experimental SNR and theoretical fitting for methanol spectra acquired with varying power ratios
2. Reference Power Consideration
As indicated by Eq. (5), increasing the power ratio
To verify this theory, methanol signals are measured at various
3. Impact of Acquisition Time
Since ISBS is a time-domain acquisition method, adjusting the acquisition parameters allows for a convenient optimization of the spectral quality. In the analysis above, an ideal sampling situation with infinite duration is assumed, while in the experimental situation, the acquisition time duration
However, this does not imply that a smaller acquisition time always leads to a better SNR. There exists an optimal range of acquisition time that maximizes the SNR. When
To validate this theory, the time-domain signal of PDMS is simulated 10 times, and the spectral SNRs at different acquisition times are calculated for each simulation. The average and standard deviations of the SNR at each acquisition time are shown as purple rectangles and error bars in Fig. 2(e). Based on Eq. (6), the mean SNR values corresponding to different
3. METHODS
A. Experimental Setup
For three-dimensional mechanical imaging, an ISBS microscope is constructed with improved spatial resolution, lower photodamage, and enhanced SNR [Fig. 3(a)], which is integrated into a microimaging structure. The pulsed pump laser (Huaray Laser, PINE-532-15) at 532 nm, with tunable repetition rate (set as 100 kHz) and 10 ps pulse duration, is focused on the TG (HOLO OR, DS-278-Q-Y-A, with a grating period of 20.7 μm) using a cylindrical lens CL (Thorlabs, LJ1144RM-A, with a focal length of 150 mm). After passing through L3 (Thorlabs, AC254-150-A, with a focal length of 150 mm) and L4 (Thorlabs, AC254-060-A, with a focal length of 60 mm), the pump laser is then focused on the sample with a volume of
![]()
Figure 3.(a) Setup of the heterodyne ISBS microscope. M1–M6, mirrors; HWP1 and HWP2, half-wave plates; PBS1 and PBS2, polarizing beam splitters; L1–L6, spherical lenses; CL, cylindrical lens; ND1 and ND2, neutral density filters; DM, dichroic mirror; TG, transmission grating; PA, phase adjustment plate; BP, 780 nm bandpass filter; PD1 and PD2: photodetectors. (b) Spot size of the pump and the probe on the focal plane. (c)
Before the imaging scan, the PA angle is adjusted to achieve the maximum amplitude of the time-domain signal through phase compensation. The heterodyne ISBS signal is detected by a photodetector PD2 (New Focus, 1601FS-AC, 30 kHz–1 GHz), and then passes through a high-pass filter (Mini Circuits, 133 MHz–1 GHz) and two-stage cascade amplifiers (Mini Circuits, ZFL-1000+, 1 GHz). Taking into account the influence of
For three-dimensional imaging, the microscope is equipped with a fast scanning stage (Thorlabs, MLS203-1) to hold and scan the sample in the x-y plane. The scanning in the z-direction is achieved by a motorized translation stage (Thorlabs, ZFM2020) to move the TG, L3, and L4 together, and the corresponding focusing of CL and L2 is accomplished using two additional translation stages. The high-speed translation stage and oscilloscope are synchronized and controlled using home-built LabVIEW scripts, enabling automated acquisition and storage of ISBS signals at each pixel point. The sample to be imaged is a solid PDMS with a millimeter-sized pattern of the Tsinghua University logo, fabricated by curing the hydrogel material, as shown in Fig. 3(d). The pattern has a size of
B. Data Processing
The MP method, which is commonly used for analyzing frequency components of exponentially decaying sinusoidal waves in noise, models the time response as a sum of complex exponential decaying sinusoids. Due to its noise suppression capability, the MP method can be applied in ISBS to speed up measurements by reducing the averaging times [23]. When processing ISBS imaging data, since each pixel only shows spectral information of one Brillouin peak, the
Considering the transition from single-pixel measurement to imaging, the selection of acquisition time can be a concern. For time-domain ISBS signals, an appropriate reduction of the acquisition time contributes to the enhancement of the SNR, as discussed in Section 2.B.3. However, unlike the situation with single-pixel spectral measurements, the acquisition time is constant for each pixel during imaging scans. Therefore, when there is a significant difference in attenuation between various materials in the scanning area, reducing the acquisition time to improve the SNR of the target material (such as the PDMS pattern) may introduce spectral broadening and sidebands to the FFT spectra of some other materials (such as the buffer solution methanol) due to the insufficient acquisition time, thus affecting the accuracy of the linewidth extraction. Unlike traditional FFT-based data processing methods for ISBS signals, the MP method directly estimates the information of each Brillouin peak in the time domain through singular value decomposition, which avoids the spectral distortion introduced by frequency domain transformation, making it immune to issues of spectral broadening and sidebands after FFT for truncated time-domain signals.
We compare the extraction accuracy for the Brillouin peak between FFT and the MP method at short acquisition times through simulation. Figure 4(a) shows the simulated noise-contaminated time-domain signal of methanol, with a frequency shift set at 265.8 MHz and a linewidth set at 5 MHz, serving as the standard for spectral extraction results. The spectra obtained through FFT at three different acquisition times are compared as blue dotted lines in Fig. 4(b), from which it can be seen that the spectral broadening and sidebands become more pronounced as the acquisition time decreases. However, when using the MP method to extract Brillouin peaks (orange lines), the values are nearly identical to the set standards (green areas), demonstrating its immunity to the spectral broadening and sidebands caused by the time-domain truncation.
![]()
Figure 4.Immunity of the MP method to spectral broadening and sidebands caused by insufficient acquisition time. (a) Simulated time-domain signal of methanol and (b) corresponding FFT and MP spectra at three acquisition times and the comparison with the standard Brillouin peak. (c) Linewidths at different acquisition times deciphered using the FFT spectra and the MP method, and the comparison with standard values.
Figure 4(c) further compares the Brillouin linewidth extracted from the methanol signals using FFT-based spectral analysis and the MP method for various acquisition times. For each acquisition time, the signal is generated 10 times to calculate the mean and standard deviations of the extracted linewidths. As the acquisition time decreases, the linewidth extracted from FFT spectra deviates significantly from the standard value, whereas the accuracy of the linewidth extracted by the MP method is hardly affected by the reduction in acquisition time. When the acquisition time decreases to 32 ns, the linewidth extracted from FFT spectra increases to 38 MHz, which is significantly larger than the standard value, while, under the same condition, the linewidth extracted using the MP method remains at 5 MHz. To ensure the accuracy of linewidth extraction while considering its precision, and to maximize the SNR of PDMS by reducing the acquisition time, we consider an acquisition time of about 64 ns to be optimal, where the MP method extracts a linewidth with an accuracy of 0.4 MHz and a precision of 1.7 MHz. To further simulate the experimental conditions, the sampling interval is set to 62.5 ps, and the number of sampling points is 1072. Under this condition, the corresponding spectral SNR for PDMS is
4. RESULTS AND DISCUSSION
A. High-Speed Brillouin Spectrum Measurement
To showcase the efficacy of multi-parameter optimization for SNR, we perform experiments with and without phase compensation and compare the results obtained at various acquisition times for both PDMS and methanol.
On one hand, we acquire time-domain signals of PDMS using setups with and without phase compensation to demonstrate its effectiveness, over 10 repeated measurements, as compared in Fig. 5(a), resulting in the corresponding FFT spectra [Fig. 5(b)]. Since the noise is dominant at an integration time of 0.3 ms without phase compensation, we temporarily extend the integration time to 2.56 ms to substantiate the enhancement in SNR through quantitative comparison. With consistent integration time, laser power, and target sample as described in Section 3.A, the time-domain signal shows a 19-fold increase in amplitude via phase compensation, improving the spectral SNR from
![]()
Figure 5.High-speed ISBS spectroscopy. (a) Comparison of PDMS signals before and after phase compensation and (b) corresponding FFT spectra. (c) Time-domain signals of PDMS and methanol, and (d) corresponding spectra at an acquisition time of 241 ns and (e) 67 ns. The blue spectra represent the FFT results, and the orange and green spectra are MP-deciphered Brillouin peaks of PDMS and methanol, respectively.
On the other hand, results under adequate and optimal truncated acquisition times are compared experimentally for both PDMS and methanol. Figure 5(c) performs the time-domain signals of PDMS and methanol under an integration time of 0.3 ms and an acquisition time of 241 ns, each with 10 repeated measurements, from which it can be seen that the PDMS signal attenuates much faster than that of methanol. The purple dashed line represents the optimal acquisition time, 67 ns, based on the simulation results in Sections 2.B.3 and 3.B. The tops of Figs. 5(d) and 5(e) illustrate the PDMS spectra at acquisition times of 241 ns and 67 ns, respectively. For PDMS, a too-long acquisition time reduces the spectral SNR, as noise dominates after optimal acquisition time. The optimization of the acquisition time improves the spectral SNR from
After optimizing the phase compensation,
B. Three-Dimensional Mechanical Imaging
High-speed ISBS imaging is demonstrated with the methanol-filled PDMS sample. We perform mechanical imaging in the x-y plane with a single pixel integration time of 0.3 ms. The distribution of Brillouin frequency shift, linewidth, and spectral amplitude for the sample is mapped in Fig. 6(a) with a total pixel number of
![]()
Figure 6.ISBS imaging at a spectral integration time of 0.3 ms per pixel for the PDMS sample immersed in methanol. (a) Mapping results of Brillouin shift, linewidth, spectral amplitude, and corresponding histograms, with and (b) without phase compensation, where the short white line is a 50 μm scale, and the orange and green curves represent the Gaussian fitting of PDMS and methanol, respectively.
To further highlight the advantages of phase compensation for ISBS imaging, in Fig. 6(b), we present the imaging results and histograms obtained from the ISBS microscope without phase compensation. After applying for phase compensation under the same settings, the image SNR of the Brillouin shift, which is calculated as the ratio of the standard deviation of the maximum pixel count for PDMS and that of the pixel count in the noise region in the histogram, increased from 11.6 dB to 26.2 dB, representing a significant approximately 30-fold improvement. This enhancement renders a more distinct variation in the spatial distributions of Brillouin shift, and thus the elasticity. In addition, the ambiguous distributions of linewidth and spectral amplitude for the two materials, which are associated with viscosity and elasto-optic coefficient [24], respectively, become distinguishable after phase compensation. Despite the small spatial differences of the Brillouin shift due to the similarity in sound speed between PDMS and methanol, the imaging results of linewidth and spectral amplitude exhibit significant spatial variations, primarily attributed to the substantial differences in viscosity and elasto-optic coefficient, enhancing the sensitivity for the characterization of spatial changes of mechanical properties. As a result, the optimization of SNR not only speeds up imaging but also enriches the mechanical information to provide more sensitive mechanical imaging.
On this basis, three-dimensional mapping results with three mechanical contrast mechanisms are shown in Fig. 7(a). The pixel interval in the x-y plane is 10 μm, while the scanning step in the z-axis is 50 μm. The integration time per pixel remains at 0.3 ms. Taking the lower surface of the PDMS pattern as the reference point for the z-axis, as the z-coordinate increases, the mechanical distribution gradually reveals the differences between PDMS and methanol. When the z-coordinate increases to 300 μm, the distribution is fully represented by methanol, which aligns with the known data of the PDMS pattern’s thickness. For PDMS and methanol, which exhibit minor differences in Brillouin shifts, the imaging results of linewidth and spectral amplitude contribute to a clearer distinction of mechanical changes, indicating that compared to solely mapping the Brillouin shift, the mapping of all three contrast mechanisms enhances the sensitivity to identifying spatial variations.
![]()
Figure 7.Three-dimensional imaging results through the high-speed ISBS microscope. (a) Mapping results of Brillouin shift, linewidth, and normalized spectral amplitude. (b) BLT images and corresponding histograms. The orange and green curves represent the BLT distribution of PDMS and methanol, respectively.
To further characterize the longitudinal modulus distribution of the sample, three-dimensional BLT images at six axial positions are mapped in Fig. 7(b), along with the corresponding histograms. According to Eq. (4), BLT is only related to the Brillouin shift and linewidth. Therefore, for materials with unknown density, this method provides a straightforward way to visualize viscoelastic differences without additional measurement. After applying Gaussian fitting to the histograms of BLT, normal distribution curves corresponding to PDMS (orange) and methanol (green) are obtained. The BLT values for methanol at different z-axis positions are mainly distributed around
5. CONCLUSIONS
For Brillouin microscopy, the limited imaging speed emerges as a pivotal challenge that impedes its wider application in mechanical imaging. Among these, ISBS holds promising capabilities for high-speed imaging but is constrained by factors such as low SNR for single-shot excitation, excessive averaging requirements, and insufficient spatial resolution. After optimizing the spatial resolution of the ISBS microscope to achieve lateral resolution at the level of 10 μm and axial resolution at the level of 100 μm, we focus on enhancing the SNR of single-shot excitation through phase compensation, reference power optimization, and acquisition time optimization, theoretically grounded in establishing an SNR model for the heterodyne ISBS system. The PDMS sample immersed in methanol is transparent, but its millimeter-scale pattern could still be distinguished by the three-dimensional ISBS imaging results in multiple contrast mechanisms without any contact or labeling. By incorporating the MP method for data processing, the spectral integration time for a single pixel can be reduced to 0.3 ms under an energy density of
A sub-millisecond single-pixel integration time offers the possibility to capture rapid biomechanical changes. The current spatial resolution essentially meets the requirements of biomedical imaging, but its further improvement is constrained by the acoustic wavelength scale. For both spontaneous and CW-stimulated schemes, the acoustic wave propagation is parallel to the optical axis, and the measurement of Brillouin spectra is typically based on the backscattered lights. In this situation, the interacting acoustic wavelengths are comparatively short, while in the ISBS scheme, acoustic wave propagation is perpendicular to the optical axis, and forward-scattered light is acquired, leading to a more significant limitation on spatial resolution due to longer acoustic wavelengths, which can be alleviated by increasing the angle between the two pump beams. However, the increase in acoustic frequency due to the decrease in acoustic wavelength would significantly raise the bandwidth requirements for the detection system. In subsequent research, after reducing the acoustic wavelength via a TG with a shorter period and a
References
[25] T. A. Litovitz, C. M. Davis. Physical Acoustics: Principles and Methods, 2(1965).


Set citation alerts for the article
Please enter your email address

© Copyright 2018-2021 | Chinese Laser Press. All Rights Reserved 沪ICP备15018463号-20