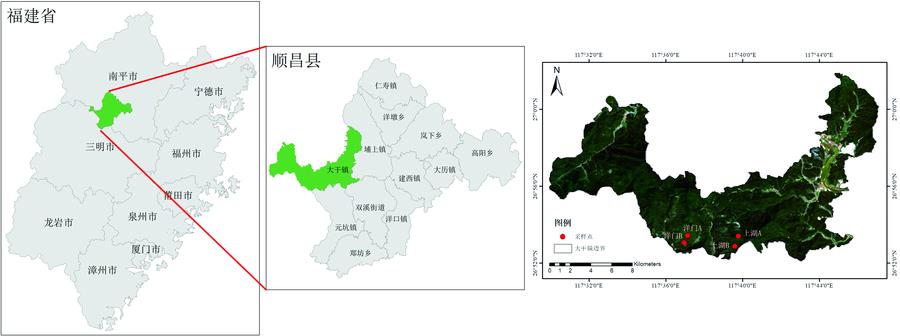
Fig. 1. Location map of test area
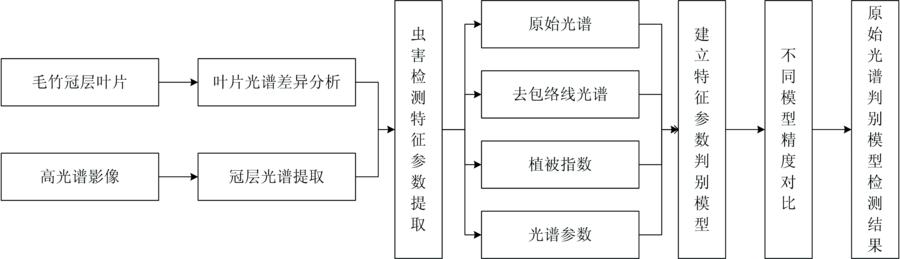
Fig. 2. Overall structure diagram
Fig. 3. Original spectra and the curves after removing the spectral envelopes of samples under different injury levels
Fig. 4. Hyperspectral remote sensing image of UAV
Fig. 5. Spatial distribution of pest injury levels in sampling area
| 植被指数 | 名称 | 计算公式 |
|---|
| SAVI | 土壤调节植被指数 | 1.5(ρ870-ρ680)/(ρ870+ρ680+0.5) | | PSNDa | 归一化色素差值指数a | (ρ800-ρ690)/(R800+ρ690) | | PSNDb | 归一化色素差值指数b | (ρ800-ρ635)/(ρ800+ρ635) | | mND705 | 修正归一化差值指数 | (ρ750-ρ705)/(ρ750+ρ705-2ρ445) | | VOGa | Vogelman指数a | ρ740/ρ750 | | mSR705 | 改进比值植被指数 | (ρ750-ρ445)/(ρ705+ρ445) | | DD | 双重差异指数 | (ρ750-ρ720)-(ρ700+ρ670) | | NDI | 归一化差异指数 | (ρ750-ρ705)/(ρ750+ρ705) | | GNDVI | 绿光归一化植被指数 | (ρ750-ρ550)/(ρ750+ρ550) |
|
Table 1. Vegetation index and its calculation formula
| 参数 | 名称 | 定义 |
|---|
| Depth560 | 绿峰吸收深度 | 在560 nm处的吸收深度 | | AreaG | 绿峰吸收面积 | 在500~610 nm之间包络线与光谱反射率之间的面积 | | AreaR | 红边吸收面积 | 在680~760 nm之间包络线与光谱反射率之间的面积 | | λR | 红边位置 | 在680~760 nm之间反射率的一阶导数红边最大值位置 | | dλR | 红边振幅 | 在680~760 nm之间反射率的一阶导数红边最大值 | | SDR | 红边面积 | 在680~760 nm之间反射率的一阶导数红边面积 | | SDR-SDB | 面积差值 | 红边面积与蓝边面积的差值 |
|
Table 2. Spectral characteristic parameters and its definitions
| 函数 | ρ400 | ρ406 | ρ586 | ρ593 | ρ689 | ρ876 | 常数 | 方差/% |
|---|
| y1 | 788.24 | 961.86 | -382.94 | 422.87 | -204.32 | 40.16 | -5.71 | 89.3 | | y2 | 3721.39 | -3461.94 | -101.38 | -109.92 | 74.46 | 5.53 | -0.20 | 9.7 | | y3 | -6028.94 | 6204.72 | 352.27 | -646.97 | 222.93 | 4.72 | -5.74 | 1.0 |
|
Table 3. Discriminant function based on the original spectrum
| 函数 | ρ403 | ρ406 | ρ409 | ρ412 | ρ505 | ρ515 | ρ735 | ρ749 | 常数 | 方差/% |
|---|
| y1 | -113.40 | -18.91 | 157.03 | -49.78 | -51.92 | 14.14 | 194.80 | -376.44 | 239.65 | 88.3 | | y2 | 59.12 | -262.44 | 82.09 | 99.94 | -74.53 | 42.71 | 26.86 | -5.17 | 18.74 | 9.1 | | y3 | 44.92 | -162.80 | -194.94 | 203.22 | 120.66 | -78.28 | -23.33 | 86.46 | 24.46 | 2.7 |
|
Table 4. Discriminant function based on the spectrum after removing the envelope
| 函数 | PSNDa | PSNDb | mND705 | mSR705 | NDI | SAVI | VOGa | DD | GNDVI | 常数 | 方差/% |
|---|
| y1 | -32.64 | -53.58 | -764.78 | -7.54 | 224.85 | 19.12 | 116.44 | 24.52 | -1.15 | -97.10 | 87.2 | | y2 | -64.11 | 13.36 | 136.33 | 20.61 | -162.59 | -5.76 | 132.71 | 35.06 | 21.21 | -127.46 | 11.0 | | y3 | 99.62 | -71.51 | 121.12 | 9.22 | -117.48 | -34.92 | 140.24 | -107.91 | 63.65 | -189.80 | 1.8 |
|
Table 5. Discriminant function based on canopy vegetation indexes
| 函数 | Depth560 | AreaR | AreaG | λR | dλR | SDR | SDR-SDB | 常数 | 方差/% |
|---|
| y1 | 41.84 | 0.62 | 0.23 | -68.53 | 0.03 | 228.59 | -242.23 | -82.95 | 84.0 | | y2 | 60.65 | -0.23 | 0.79 | 1829.17 | -0.15 | -264.07 | 174.68 | 53.37 | 14.2 | | y3 | 156.17 | 0.10 | 1.84 | -461.90 | -0.08 | 324.33 | -239.62 | -122.10 | 1.8 |
|
Table 6. Discriminant function based on canopy spectral parameters
| 特征 | 检验精度/% | Kappa
系数 | R2 |
|---|
| 健康 | 轻度 | 中度 | 重度 | 总体 |
|---|
| 原始光谱 | 92.0 | 73.3 | 82.4 | 84.8 | 84.4 | 0.79 | 0.89 | | 去包络线 | 96.0 | 60.0 | 70.6 | 84.8 | 81.1 | 0.74 | 0.88 | | 植被指数 | 96.0 | 73.3 | 70.6 | 78.8 | 79.7 | 0.74 | 0.88 | | 光谱参数 | 92.0 | 73.3 | 64.7 | 84.8 | 78.7 | 0.76 | 0.85 |
|
Table 7. Different feature discriminant function accuracies
采样
区域 | 健康 | 轻度虫害 | 中度虫害 | 重度虫害 | 总面积
/m2 |
|---|
| 面积/m2 | 比例/% | 面积/m2 | 比例/% | 面积/m2 | 比例/% | 面积/m2 | 比例/% |
|---|
| 洋门A | 222.16 | 2.32 | 1 395.09 | 14.56 | 2 530.45 | 26.41 | 5 432.30 | 56.70 | 9 580 | | 洋门B | 855.03 | 6.47 | 4 228.62 | 32.01 | 5 893.71 | 44.62 | 2 231.64 | 16.89 | 13 209 | | 上湖A | 4 815.13 | 43.89 | 2 004.44 | 18.27 | 3 410.13 | 31.09 | 740.30 | 6.75 | 10 970 | | 上湖B | 2 700.81 | 43.91 | 1 470.34 | 23.90 | 1 793.49 | 29.16 | 186.36 | 3.03 | 6 151 |
|
Table 8. Test results of Phyllostachys Edulis Pest