Yuhang Ruan, Xinyue Qian, Hai-Xiao Wang, Zheng-Da Hu, Yuting Yang, Jicheng Wang, Xiaopeng Shen, Yixiang Wang, "Applications for wavelength division multiplexers based on topological photonic crystals," Photonics Res. 11, 569 (2023)

Search by keywords or author
- Photonics Research
- Vol. 11, Issue 4, 569 (2023)

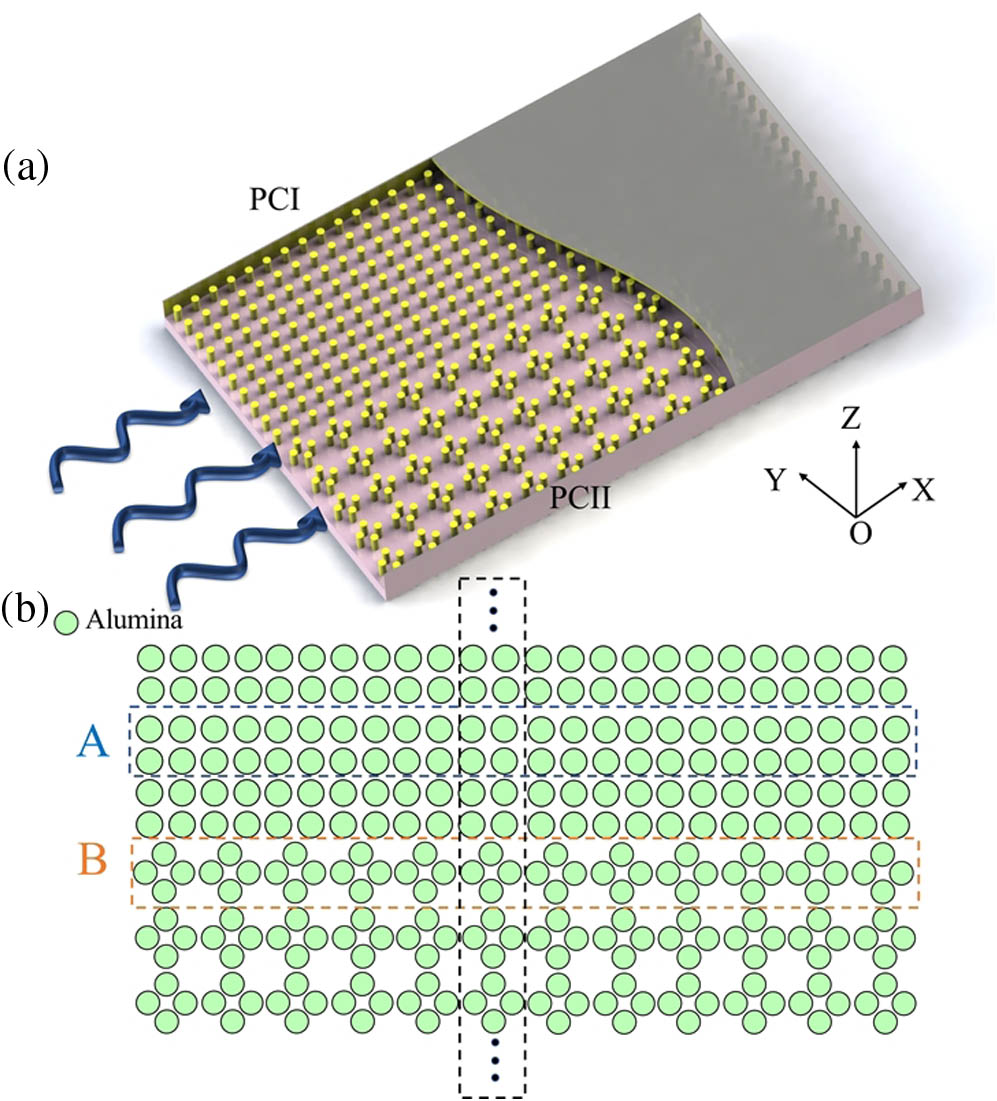
Fig. 1. (a) Schematic diagram of the designed PC structure. A light beam transmits at the junction of PCI and PCII. (b) 2D plane schematic of PCs with different degrees of rotation in the unit cell.

Fig. 2. (a) and (b) Schematic of a unit cell of PCI (δ = 0 ) with four alumina cylinders at four corners. The lattice constant is a = 25 mm , the radius of dielectric cylinders is R = 2.4 mm , and the relative dielectric permittivity is ε = 10 . (c) Band diagram of PCI. Inset: first Brillouin zone. Right panel: distributions of eigen-electric fields at highly symmetric points. The parities of the bulk band are marked by “+ ” and “−” signs. The photonic band gap (gray region) is topologically trivial. (d) and (e) Unit cell of PCII (δ = 0.5 ) with rotating dielectric cylinders. (f) A topological nontrivial band gap appears between the S1 and S2 bands highlighted in yellow. (g) Size of photonic band gap as a function of rotation parameter δ .

Fig. 3. (a) Projected band for PCI (δ = 0 ) and PCII (δ = 0.5 ) structures. Topological edge state dispersions are denoted by solid lines in the photonic band gap. The green regions indicate bulk bands. (b) Simulated results show a stable and strong electric field on the interface. (c) The E z eigenmode distribution of the edge state at frequency f = 10.321 GHz with k x = 0 . The electric field is mainly concentrated at the interface.

Fig. 4. (a) 3D schematic of multichannel WDM device constructed by PCs with δ = 0.1 , 0.2, 0.3, 0.4, and 0.5. (b) Simulated results of the strong electric field distributions in channels 0, 1, 2, and 3 at 9.34, 9.67, 10.12, and 10.94 GHz, respectively. (b) Transmittance of the multichannel WDM device. The four colored areas represent the four channels, in which the transmittance is close to 1.

Fig. 5. (a) Photograph of the experimental setup consisting of alumina cylinders with relative dielectric permittivity ε = 10 . (b) Simulated electric field of the topological edge state at f = 10.321 GHz . (c) Experimental measurement of the edge state at f = 10.5 GHz . The strong electric field localizes at the interface channel.

Fig. 6. Simulation results of square three-channel WDM. (a) Array board with a size of 500 mm × 500 mm . They individually and stably exhibit powerful control and transport of light, which correspond to (b) f 1 = 9.67 GHz , (c) f 2 = 10.25 GHz , and (d) f 3 = 10.98 GHz . (e), (f) and (g) Optical transmission with three channels based on experimental data. The frequencies are 9.41 GHz, 10.27 GHz, and 10.79 GHz, respectively.

Set citation alerts for the article
Please enter your email address