• Photonics Research
  • Vol. 11, Issue 1, 117 (2023)
Longheng Qi, Xu Zhang, Wing Cheung Chong, and Kei May Lau*
Author Affiliations
  • Department of Electronic and Computer Engineering, The Hong Kong University of Science and Technology, Hong Kong, China
  • show less
    DOI: 10.1364/PRJ.465489 Cite this Article Set citation alerts
    Longheng Qi, Xu Zhang, Wing Cheung Chong, Kei May Lau. Monolithically integrated high-resolution full-color GaN-on-Si micro-LED microdisplay[J]. Photonics Research, 2023, 11(1): 117 Copy Citation Text show less
    Process flow of the full-color GaN-on-Si micro-LED microdisplay. Schematic of the blue GaN-on-Si micro-LED module (a) after p- and n-electrode deposition, (b) after passivation, planarization, and Sn reflow, (c) flip-chip bonding. Schematic of the color conversion module, (d) after the color filter array (CFA) definition, (e) after QDs-PR patterning, and (f) after the second layer of black matrix (BM) isolation. (g) Schematic of the full-color GaN-on-Si micro-LED microdisplay.
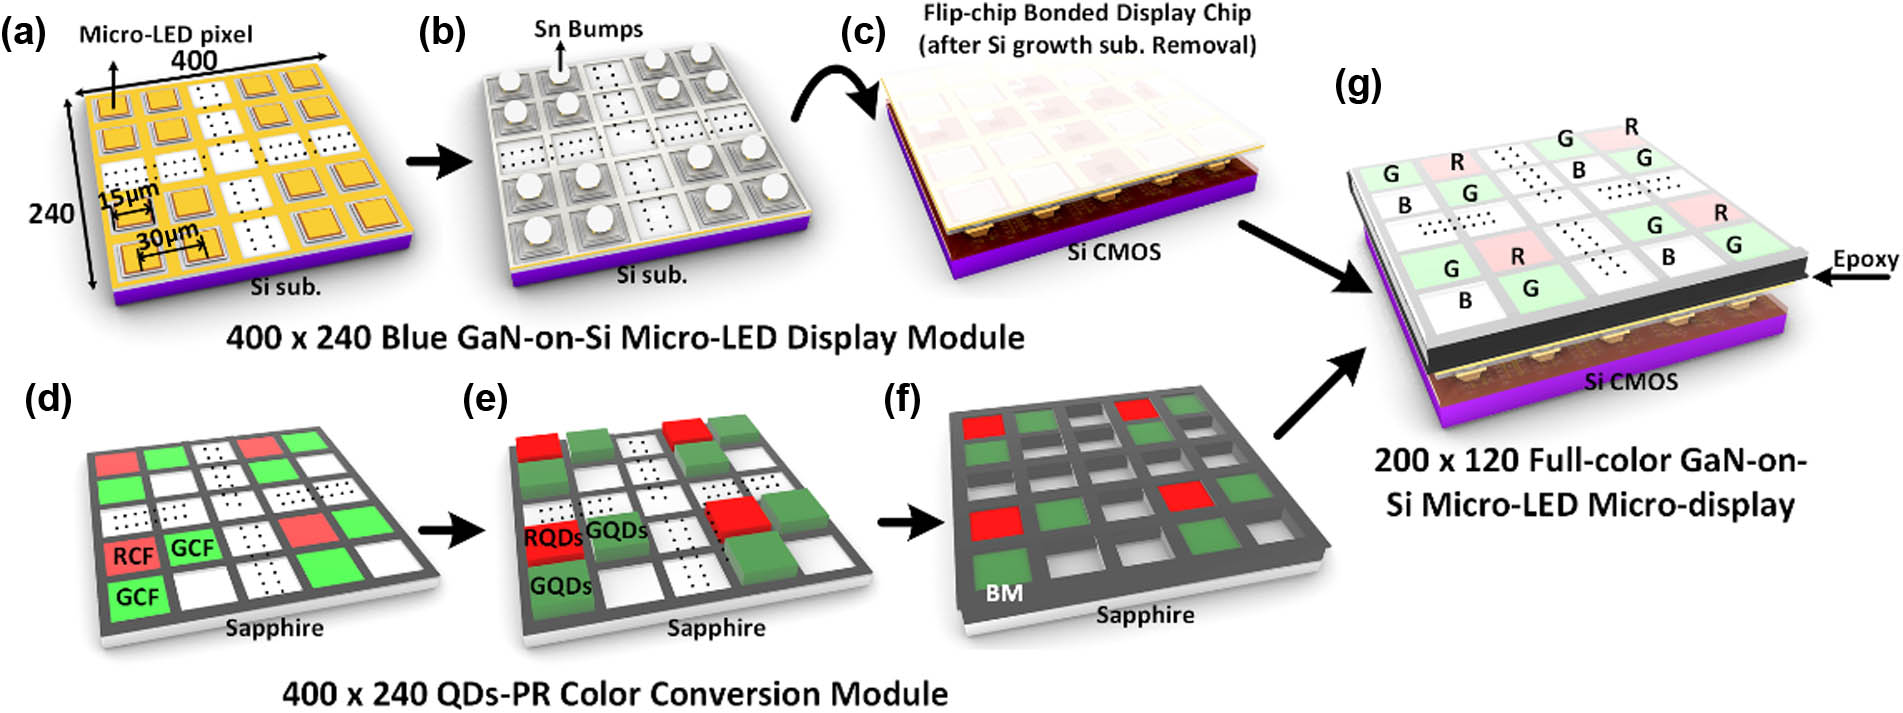
    Fig. 1. Process flow of the full-color GaN-on-Si micro-LED microdisplay. Schematic of the blue GaN-on-Si micro-LED module (a) after p- and n-electrode deposition, (b) after passivation, planarization, and Sn reflow, (c) flip-chip bonding. Schematic of the color conversion module, (d) after the color filter array (CFA) definition, (e) after QDs-PR patterning, and (f) after the second layer of black matrix (BM) isolation. (g) Schematic of the full-color GaN-on-Si micro-LED microdisplay.
    Fabrication of the monolithic blue GaN-on-Si micro-LED display module. (a) As-fabricated micro-LED array on the 4-in. GaN-on-Si epiwafer. Inspections of (b) the micro-LED array after Sn reflow, (c) flip-chip bonded blue display chip before and after the Si growth substrate removal. (d) Crack-free GaN surface after Si removal.
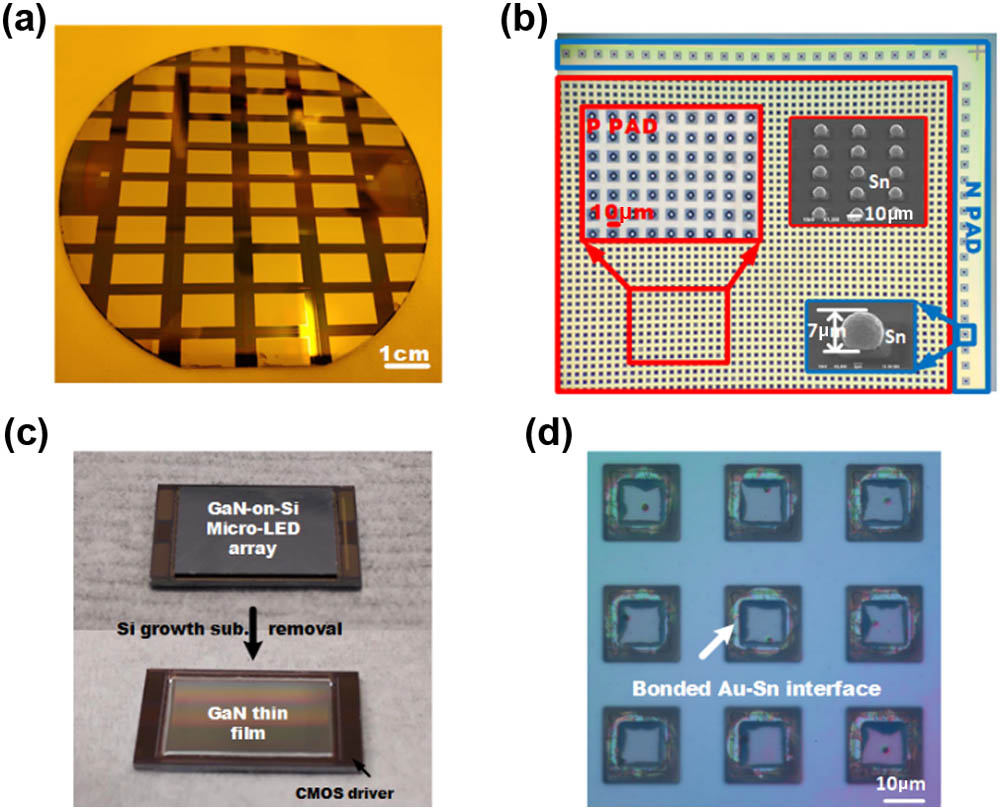
    Fig. 2. Fabrication of the monolithic blue GaN-on-Si micro-LED display module. (a) As-fabricated micro-LED array on the 4-in. GaN-on-Si epiwafer. Inspections of (b) the micro-LED array after Sn reflow, (c) flip-chip bonded blue display chip before and after the Si growth substrate removal. (d) Crack-free GaN surface after Si removal.
    Characterization and demonstration of the monolithic blue GaN-on-Si micro-LED display. (a) I−V curves of 80 pixels randomly picked from the single die of the micro-LED array. (b) Image of the micro-LED display chip fully powered on with injection current of 250 mA (the inset is the electroluminance spectrum with dominant wavelength at 440 nm) and corresponding zoomed-in view of pixels. (c) The 4-bit grayscale displayed images.
    Fig. 3. Characterization and demonstration of the monolithic blue GaN-on-Si micro-LED display. (a) IV curves of 80 pixels randomly picked from the single die of the micro-LED array. (b) Image of the micro-LED display chip fully powered on with injection current of 250 mA (the inset is the electroluminance spectrum with dominant wavelength at 440 nm) and corresponding zoomed-in view of pixels. (c) The 4-bit grayscale displayed images.
    Fabrication of the monolithic QDs-PR color conversion module. (a) The as-fabricated QDs-PR color conversion module on the 4-in. sapphire substrate. (b) The scanning electron microscopy (SEM) images of color conversion layer (b1) after R/G QDs-PR patterning, (b2) after the second layer of BM isolation, and (b3) the cross section of the QDs-PR color conversion layer. (c) Inspection of the QDs-PR color conversion module under UV excitation and zoomed-in view of RGGB subpixel arrangement. (d) Assembling of the blue GaN-on-Si micro-LED display module and color conversion module through adhesive bonding.
    Fig. 4. Fabrication of the monolithic QDs-PR color conversion module. (a) The as-fabricated QDs-PR color conversion module on the 4-in. sapphire substrate. (b) The scanning electron microscopy (SEM) images of color conversion layer (b1) after R/G QDs-PR patterning, (b2) after the second layer of BM isolation, and (b3) the cross section of the QDs-PR color conversion layer. (c) Inspection of the QDs-PR color conversion module under UV excitation and zoomed-in view of RGGB subpixel arrangement. (d) Assembling of the blue GaN-on-Si micro-LED display module and color conversion module through adhesive bonding.
    Characterizations of the QDs-PR thin film. (a) Spectra of the 300-μm standard blue LED powered at different current densities (the inset is the image of the blue reference LED powered at 20 mA). Spectra of the 7-μm-thick (b) GQDs-PR, (c) RQDs-PR illuminated by the blue LED under different current densities (the inset is the image of GQDs-PR/RQDs-PR illuminated by the blue LED powered at 20 mA). (d) Conversion ratio of 7-μm-thick R/G QDs-PR, (e) absorption ratio of 1.8-μm-thick RCF, 1.2-μm-thick GCF, and 7-μm-thick R/G QDs-PR, and (f) efficiency of 7-μm-thick R/G QDs-PR.
    Fig. 5. Characterizations of the QDs-PR thin film. (a) Spectra of the 300-μm standard blue LED powered at different current densities (the inset is the image of the blue reference LED powered at 20 mA). Spectra of the 7-μm-thick (b) GQDs-PR, (c) RQDs-PR illuminated by the blue LED under different current densities (the inset is the image of GQDs-PR/RQDs-PR illuminated by the blue LED powered at 20 mA). (d) Conversion ratio of 7-μm-thick R/G QDs-PR, (e) absorption ratio of 1.8-μm-thick RCF, 1.2-μm-thick GCF, and 7-μm-thick R/G QDs-PR, and (f) efficiency of 7-μm-thick R/G QDs-PR.
    Characterizations of CF, BM, and of the QDs-PR thin film after CF coating. (a) Transmittance and absorbance of 1.2-μm-thick GCF, 1.8-μm-thick RCF, and 1-μm-thick BM. Spectra of the 7-μm-thick, (b) GQDs-PR with GCF, and (c) RQDs-PR with RCF excited by the blue LED under different current densities. (The inset is the shift of green/red coordinate in CIE 1931 diagram.)
    Fig. 6. Characterizations of CF, BM, and of the QDs-PR thin film after CF coating. (a) Transmittance and absorbance of 1.2-μm-thick GCF, 1.8-μm-thick RCF, and 1-μm-thick BM. Spectra of the 7-μm-thick, (b) GQDs-PR with GCF, and (c) RQDs-PR with RCF excited by the blue LED under different current densities. (The inset is the shift of green/red coordinate in CIE 1931 diagram.)
    The 4-bit full-color images demonstrated on the monolithically integrated full-color GaN-on-Si micro-LED microdisplay (demo videos see Visualization 1 and Visualization 2).
    Fig. 7. The 4-bit full-color images demonstrated on the monolithically integrated full-color GaN-on-Si micro-LED microdisplay (demo videos see Visualization 1 and Visualization 2).
    Monochromatic blue, green, and red displayed images and corresponding view under a microscope.
    Fig. 8. Monochromatic blue, green, and red displayed images and corresponding view under a microscope.
    The display panel was divided into 28 blocks numbered from 0 to 27, each of which includes 60×57 subpixels. (a) The single pixel was addressed in the GaN-on-Si backlight display. (b) Display spectra of blocks 0–27 when blue, green, and red subpixels were turned on, respectively. (c) Schematic of the blue light leakage between RGB subpixels.
    Fig. 9. The display panel was divided into 28 blocks numbered from 0 to 27, each of which includes 60×57 subpixels. (a) The single pixel was addressed in the GaN-on-Si backlight display. (b) Display spectra of blocks 0–27 when blue, green, and red subpixels were turned on, respectively. (c) Schematic of the blue light leakage between RGB subpixels.
    Distribution of the blue pumping light and leakage light in RGB subpixels.
    Fig. 10. Distribution of the blue pumping light and leakage light in RGB subpixels.
    Display color performance characterization. (a) Angular dependence of and (b) color gamut of this full-color micro-LED microdisplay.
    Fig. 11. Display color performance characterization. (a) Angular dependence of and (b) color gamut of this full-color micro-LED microdisplay.
    Blue Subpixels on OnlyGreen Subpixels on OnlyRed Subpixels on Only
    Pbb/0.5%×2+3%0.5%+0.5%
    Pbg0.5%×2+2.1%/0.5%×2+6%
    Pbr0.5%+1.4%0.5%×2+6%/
    Table 1. Blue Light Leakage Distribution from the Backlight Display Module and Misalignment between Two Modules
    Longheng Qi, Xu Zhang, Wing Cheung Chong, Kei May Lau. Monolithically integrated high-resolution full-color GaN-on-Si micro-LED microdisplay[J]. Photonics Research, 2023, 11(1): 117
    Download Citation