• Infrared and Laser Engineering
  • Vol. 49, Issue 10, 20200218 (2020)
Lu Xu, Xu Yang, Long Wu*, Xiaoan Bao, and Yijia Zhang
Author Affiliations
  • School of Informatics, Zhejiang Sci-Tech University, Hangzhou 310018, China
  • show less
    DOI: 10.3788/IRLA.20200218 Cite this Article
    Lu Xu, Xu Yang, Long Wu, Xiaoan Bao, Yijia Zhang. Restrain range walk error of Gm-APD lidar to acquire high-precision 3D image[J]. Infrared and Laser Engineering, 2020, 49(10): 20200218 Copy Citation Text show less
    Gm-APD lidar system. (a) Schematic of the Gm-APD lidar (FDC: frequency doubling crystal, BS: beam splitter, PIN: high speed PIN detector, Gm-APD: Gm-APD detector module); (b) Photograph of the lidar system; (c) Photograph of the target
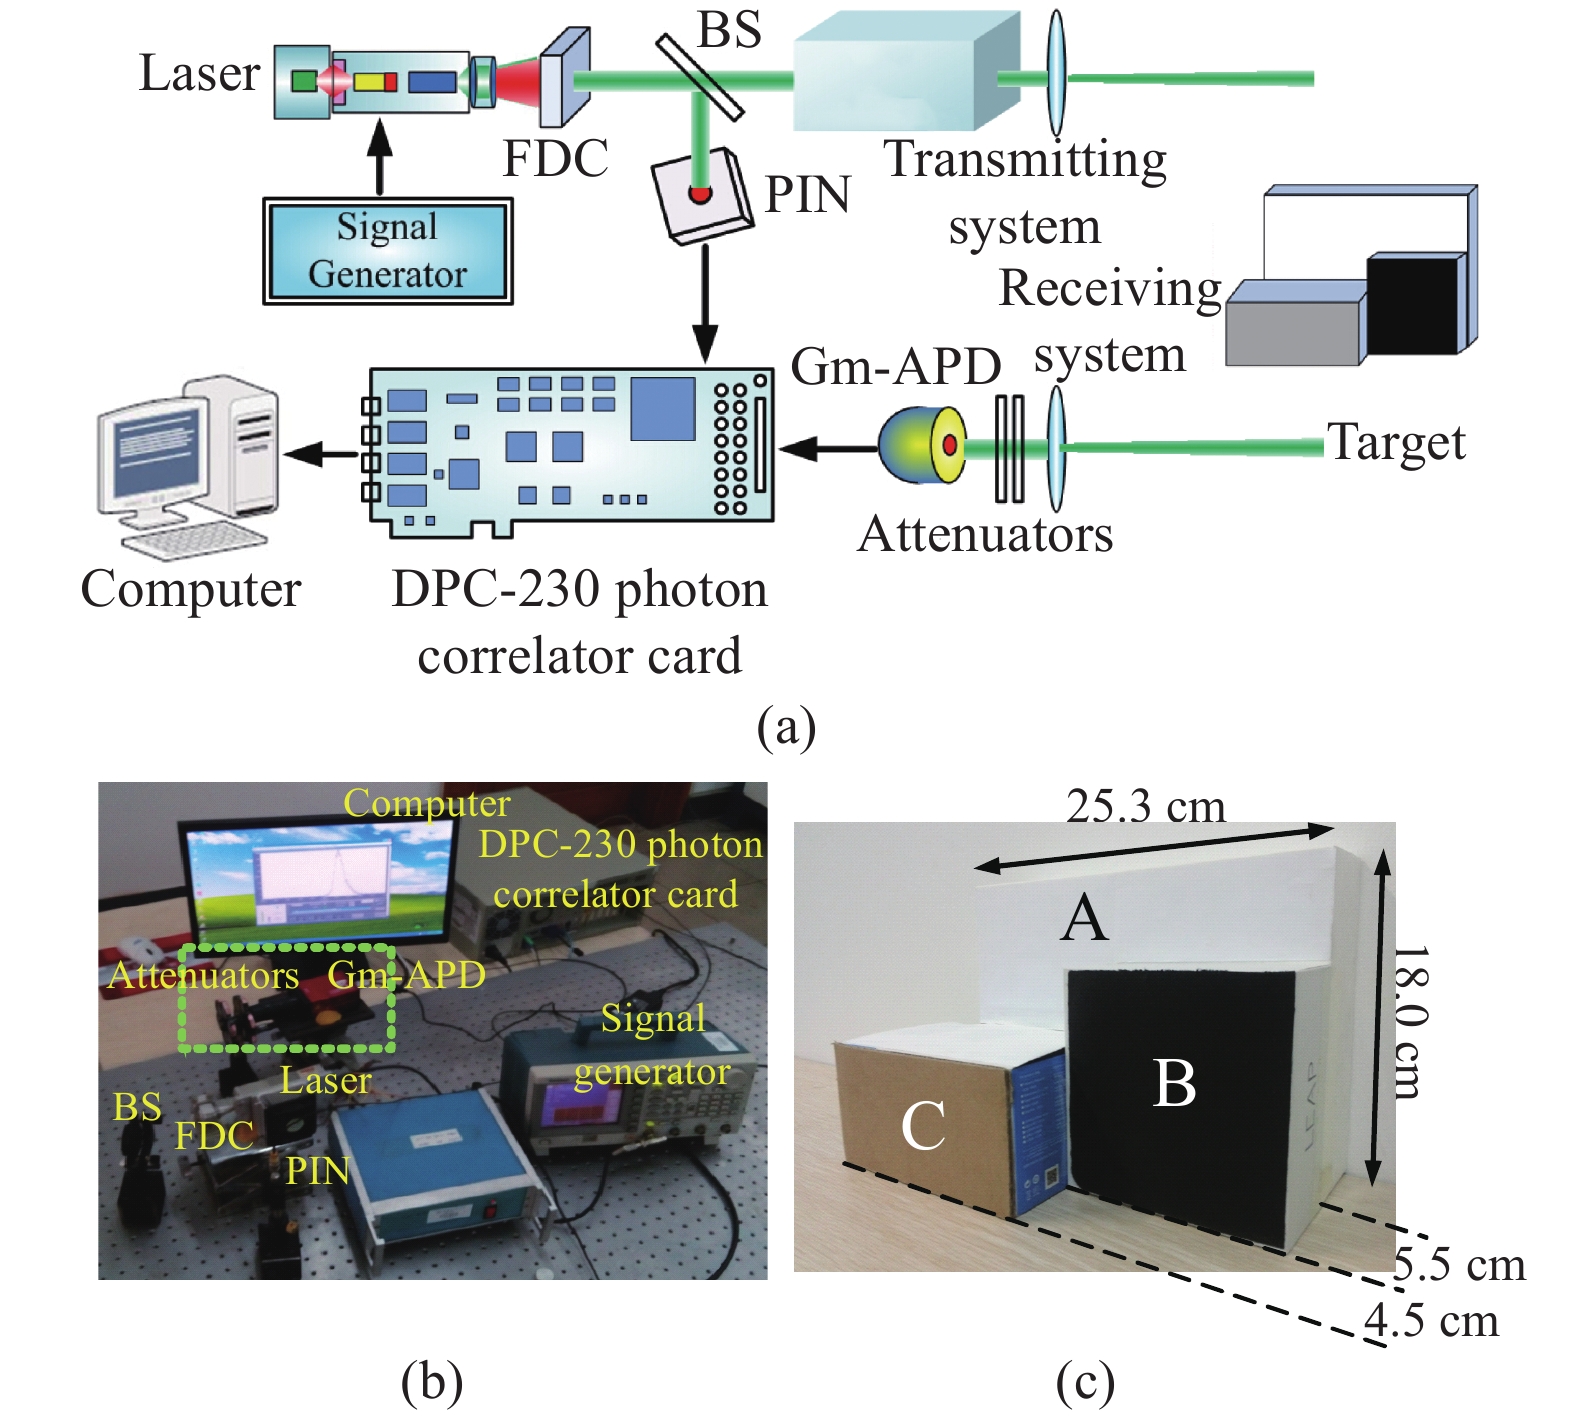
    Fig. 1. Gm-APD lidar system. (a) Schematic of the Gm-APD lidar (FDC: frequency doubling crystal, BS: beam splitter, PIN: high speed PIN detector, Gm-APD: Gm-APD detector module); (b) Photograph of the lidar system; (c) Photograph of the target
    PCDH of target A with different attenuators. (a) 0 dB attenuators; (b) 50 dB attenuators
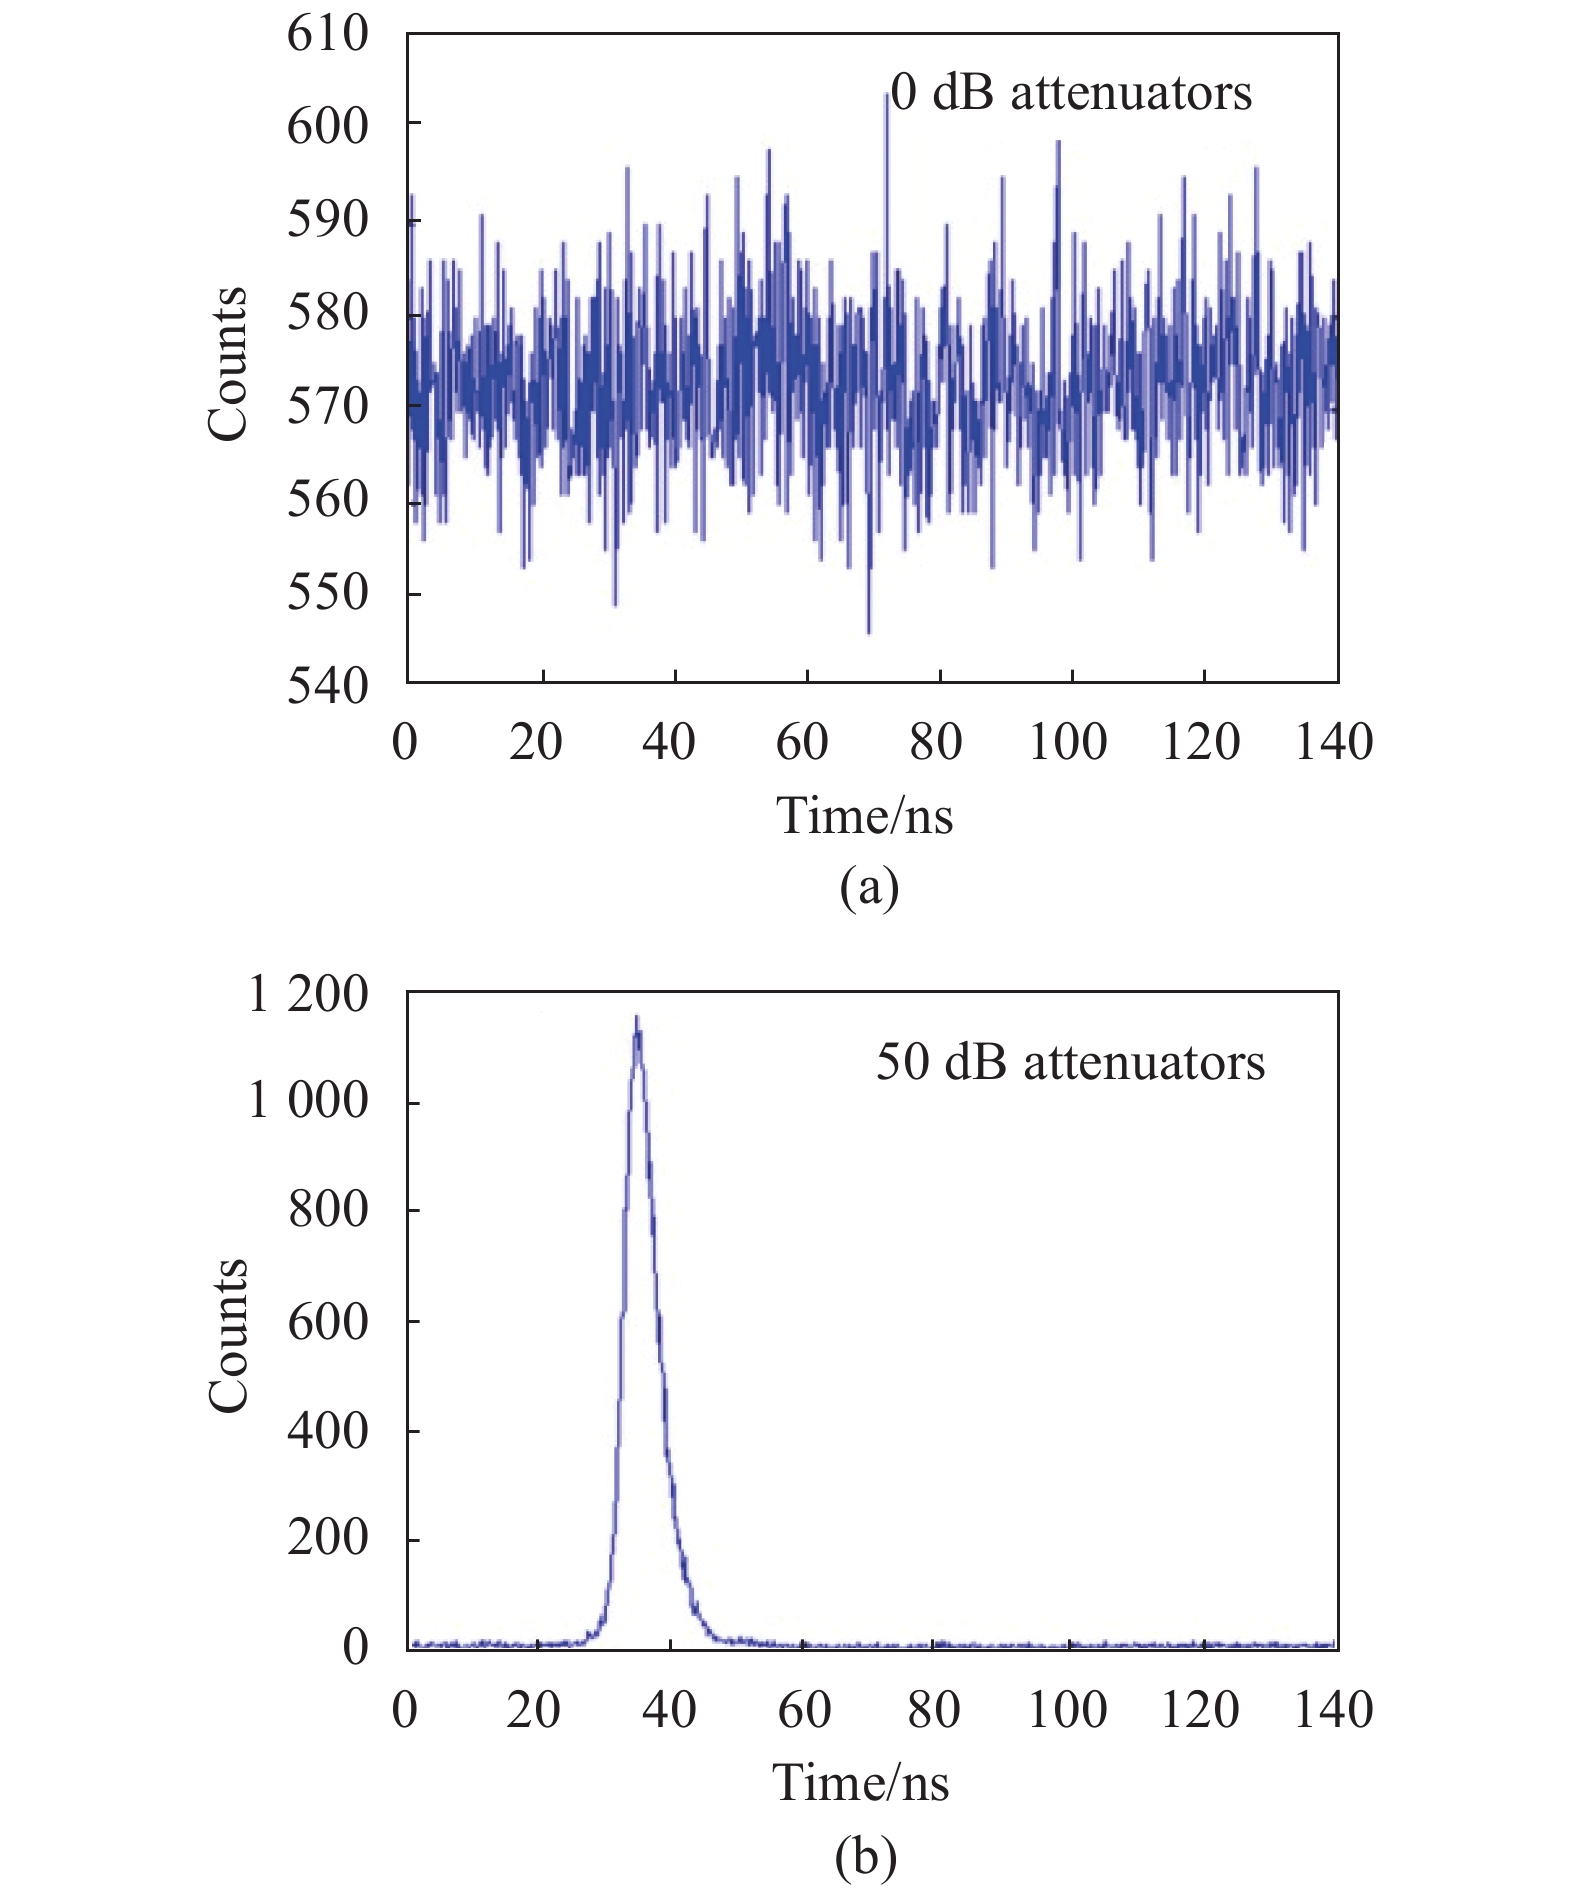
    Fig. 2. PCDH of target A with different attenuators. (a) 0 dB attenuators; (b) 50 dB attenuators
    Logical diagram of the two methods to restrain range walk error
    Fig. 3. Logical diagram of the two methods to restrain range walk error
    Experimental imaging results of Gaussian functions fitting method. (a) Depth image with a color map corresponding to the distance using the traditional pulse peak ranging method. (b) 3D plot of depth image with a color map corresponding to the intensity using the signal restoration & Gaussian functions fitting method. (c) Distance distribution histogram of Fig. 3(a). (d) Distance distribution histogram of Fig. 3(b)
    Fig. 4. Experimental imaging results of Gaussian functions fitting method. (a) Depth image with a color map corresponding to the distance using the traditional pulse peak ranging method. (b) 3D plot of depth image with a color map corresponding to the intensity using the signal restoration & Gaussian functions fitting method. (c) Distance distribution histogram of Fig. 3(a). (d) Distance distribution histogram of Fig. 3(b)
    Experimental imaging results of center-of-mass algorithm method. (a) Depth image with a color map corresponding to the distance using the traditional center-of-mass algorithm method. (b) 3D plot of depth image with a color map corresponding to the intensity using the signal restoration & center-of-mass algorithm method. (c) Distance distribution histogram of Fig. 4(a). (d) Distance distribution histogram of Fig. 4(b)
    Fig. 5. Experimental imaging results of center-of-mass algorithm method. (a) Depth image with a color map corresponding to the distance using the traditional center-of-mass algorithm method. (b) 3D plot of depth image with a color map corresponding to the intensity using the signal restoration & center-of-mass algorithm method. (c) Distance distribution histogram of Fig. 4(a). (d) Distance distribution histogram of Fig. 4(b)
    DevicesPerformance parameters
    Semiconductor laserPulse width 6 ns, wavelength 1 064 nm, repetition frequency 2 kHz Work wavelength of the lidar 532 nm
    Receiving telescopeAperture diameter 23 mm, field of view<100 mrad
    Gm-APD moduleCOUNT-100C, Laser Components GmbH. dead time 45 ns, photon detection efficiency 70%@532 nm, dark count rate 100 Hz, length of TTL output pulse 15 ns, high level 3 V, temporal jittering 1 000 ps, maximum count rate 20 MHz
    Photon correlator cardDPC-230, Becker & Hickl GmbH. Time duration of time-bin 164 ps, operating mode “Multicaler”, collection time 60 s, total detection number 1.2×10⁵
    Table 1. Performance parameters of the devices in the experiment
    Lu Xu, Xu Yang, Long Wu, Xiaoan Bao, Yijia Zhang. Restrain range walk error of Gm-APD lidar to acquire high-precision 3D image[J]. Infrared and Laser Engineering, 2020, 49(10): 20200218
    Download Citation