
Lu Xu, Xu Yang, Long Wu, Xiaoan Bao, Yijia Zhang. Restrain range walk error of Gm-APD lidar to acquire high-precision 3D image[J]. Infrared and Laser Engineering, 2020, 49(10): 20200218
- Infrared and Laser Engineering
- Vol. 49, Issue 10, 20200218 (2020)
Abstract
0 Introduction
Geiger-mode avalanche photodiode (Gm-APD) is widely used in the 3D imaging lidar system to detect weak signals because of their single-photon sensitivity and picosecond magnitude time precision [
Gm-APD has first photon bias effect [
The range walk error depends on the intensity and waveform of receiving signal. It will cause deterioration with signal enhancing and pulse width broadening [
Two methods were proposed to restrain the range walk error by Oh et al[
In this paper, two methods to restrain the range walk error are presented and verified by experiments. A high precision of 3D image of the target is obtained.
1 Theoretical analysis
According to the Poisson probability response model of a Gm-APD, the avalanche probability of the i-th time bin with discrete time bins is presented as [
where
In a time-of-arrival histogram built up over many laser pulses, the avalanche probability of a Gm-APD can be obtained by the following formula:
where K(i) is the number of photon counts of the Gm-APD in the i-th time bin, and M is the total number of detections.
Substitute Eq. (2) to Eq. (1), we can get
Let K(i) go through the all time bins, it is the SPDH of Gm-APD in the experiment.
In our previous research work [
Calculating the sum of all signal photoelectrons in the signal interval, from T1 to Tm, the intensity information of the target can be obtained by
In the traditional time-of-flight Gm-APD lidar, there exists range walk error between the distances of measured value and truth value, which is caused by the first photon bias effect of Gm-APD. It will cause deterioration with signal enhancing and pulse width broadening. There are two methods for traditional pulse peak ranging [
The first method is signal restoration & Gaussian functions fitting method. According to the SPDH corresponding to the measurements, it is found that the function with the sum of two Gaussian curves fits well. The fitting curve shows a central peak shape and meets the following equation,
where A1, T1, B1, A2, T2, and B2 are constants obtained by MATLAB. The peak position of the fitting curve, T, is the time-of-flight of the laser pulse. The distance information of the target can be obtained by
where
The second method is signal restoration & center-of-mass algorithm method. The center-of-mass algorithm method is used on the SPDH. The distance information of the target can be obtained by
Both the two methods can effectively suppress the range walk error to obtain high-precision intensity and distance information of the target.
2 Experimental analysis
2.1 Experimental system design
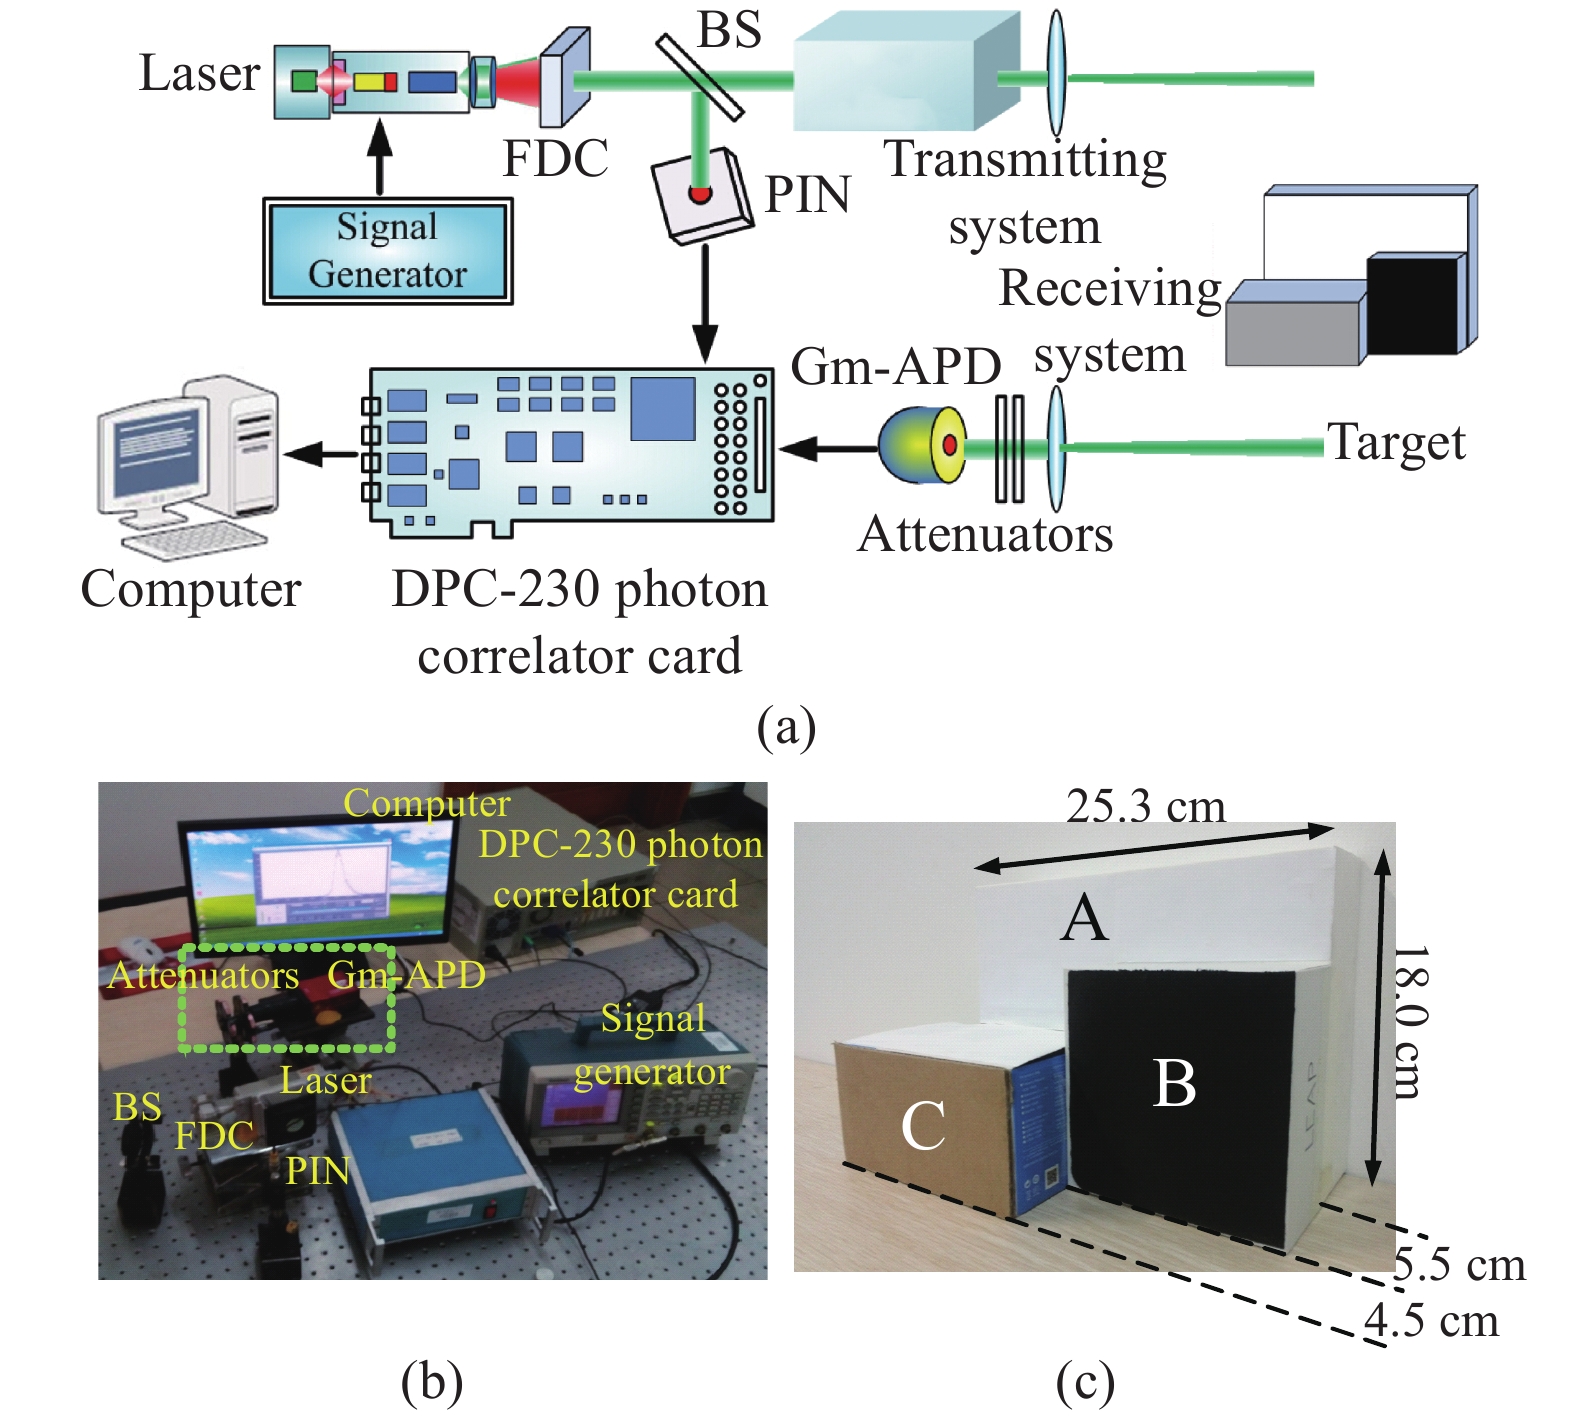
Figure 1 shows the Gm-APD lidar system. Figure 1(a) shows the schematic diagram of the designed Gm-APD lidar. The signal generator gives a trigger signal to the laser to emit a pulse at wavelength of 1 064 nm, which is transformed into 532 nm by a frequency doubling crystal (FDC). The laser is divided into two beams using a beam splitter (BS). One beam is collected by a high-speed PIN detector to trigger the DPC-230 photon correlator card to record the start time, and the other beam illuminates the target after an X-Yscanning system. The scattered light returned from the target is collected by the receiving system. Then it is decayed to photon level by the attenuators. Lastly, the photon signal is detected by a Gm-APD module. The Gm-APD module outputs a Transistor Transistor Logic (TTL) signal to stop the DPC-230 card. The PCDH is obtained after a number of detections.
![]()
Figure 1.Gm-APD lidar system. (a) Schematic of the Gm-APD lidar (FDC: frequency doubling crystal, BS: beam splitter, PIN: high speed PIN detector, Gm-APD: Gm-APD detector module); (b) Photograph of the lidar system; (c) Photograph of the target
The photograph of the indoor confirmatory lidar system is shown in Fig.1(b). In order to simulate a strong sunlight background, the narrowband filer is not used. Moreover, ten fluorescent lamps are utilized to achieve a strong background noise of
Figure 1(c) shows the targets (A, B, and C) covered with different reflectivity materials. The distances of the three targets are 525 cm, 519.5 cm, and 515 cm, respectively. The size of target A is 25.3 cm×18 cm. The diameter of the laser spot illuminated on the target is 5 mm, and the scanning points are 30×46. Table 1 shows the performance parameters of the devices in the experiment.
| Devices | Performance parameters |
| Semiconductor laser | Pulse width 6 ns, wavelength 1 064 nm, repetition frequency 2 kHz Work wavelength of the lidar 532 nm |
| Receiving telescope | Aperture diameter 23 mm, field of view<100 mrad |
| Gm-APD module | COUNT-100C, Laser Components GmbH. dead time 45 ns, photon detection efficiency 70%@532 nm, dark count rate 100 Hz,
|
| Photon correlator card | DPC-230, Becker & Hickl GmbH. Time duration of time-bin 164 ps, operating mode “Multicaler”, collection time 60 s,
|
Table 1. Performance parameters of the devices in the experiment
2.2 Experimental results and analysis
The PCDH of the Gm-APD is completely submerged in the noise and the signal cannot be identified under the strong background noise of 1.49×10⁷ Hz, as shown in Fig.2(a). We use 50 dB attenuators to enhance the signal-to-noise ratio. The signal completely submerged in the noise is perfectly captured, as shown in Fig.2(b). This is a phenomenon peculiar to the Gm-APD.
![]()
Figure 2.PCDH of target A with different attenuators. (a) 0 dB attenuators; (b) 50 dB attenuators
Figure 3 shows the logical diagram of the two methods to restrain the range walk error. We directly capture the PCDH, output of Gm-APD, acquired by DPC-230 photon correlator card. The PCDH is expressed as Eq.(3), which is a recursive formula. We need go through the signal time bins, from T1 to Tm. Then, signal restoration method is used to obtain SPDH from the PCDH. It is calculated by Eq.(4). There is an offset between SPDH and PCDH. They do not coincide, which is the range walk error. This is detailed explained in our previous work of Ref. [12]. We need find the distance information from the SPDH. The first method uses a sum of two Gaussian functions to fit the SPDH, and finds the peak position of the curve to calculate the distance. The intensity information is calculated by the area of the fitting curve, and the distance information is calculated by Eq.(7). The second method uses the center-of-mass algorithm method on the SPDH to calculate the distance. The intensity information is calculated by Eq.(5), and the distance information is calculated by Eq.(8).
![]()
Figure 3.Logical diagram of the two methods to restrain range walk error
The relative accuracy of intensity is calculated by
where N is the pixel number of a target, Ii is the measurement intensity of the i-th pixel, and
The range precision is calculated by
where Ri is the measurement distance of the i-th pixel, obtained by Eq.(7) or Eq. (8), and
Figure 4 shows the experimental imaging results of signal restoration & Gaussian functions fitting method. Fig.4(a) shows the depth image with a color map corresponding to the distance using traditional pulse peak ranging method. It lacks intensity information of the target. The measured mean distance of the target A, B, and C are 517.6 cm, 515.9 cm, and 509.8 cm, respectively. The corresponding range walk errors are −7.4 cm, −3.6 cm, and −5.2 cm, respectively. The range walk error effect is very serious. We can only find two distance values from the distance distribution histogram of Fig.4(a), as shown in Fig.4(c). Figure 4(b) shows the 3D plot of depth image with a color map corresponding to the intensity using the signal restoration & Gaussian functions fitting method. We get the depth-intensity 3D merged image. The measured mean distance of the target A, B, and C are 525.6 cm, 519.7 cm, and 514.9 cm, respectively. The corresponding range walk errors are +0.6 cm, +0.2 cm, and −0.1 cm, respectively. The restraint of range walk error is effective. The measured mean intensity of the target A, B, and C are 0.492, 0.231, and 0.314 photoelectrons. The relative accuracy of intensity measurement, obtained by Eq. (9), is less than 3%. We can observe three distance values from the distance distribution histogram of Fig. 4(b), as shown in Fig. 4(d). However, there are some overlap between them. The range precision, obtained by Eq. (10), is 1.2 cm.
![]()
Figure 4.Experimental imaging results of Gaussian functions fitting method. (a) Depth image with a color map corresponding to the distance using the traditional pulse peak ranging method. (b) 3D plot of depth image with a color map corresponding to the intensity using the signal restoration & Gaussian functions fitting method. (c) Distance distribution histogram of
Figure 5 shows the experimental imaging results of signal restoration & center-of-mass algorithm method. Figure 5(a) shows the depth image with a color map corresponding to the distance using traditional center-of-mass algorithm method. It lacks intensity information of the target as well. The measured mean distance of the target A, B, and C are 519.4 cm, 517.4 cm, and 511.0 cm, respectively. The corresponding range walk errors are −5.6 cm, −2.1 cm, and −4.0 cm, respectively. The range walk error effect is very serious. We can find three distance values from the distance distribution histogram of Fig. 5(a), as shown in Fig. 5(c). However, there are some overlap between them. Figure 5(b) shows the 3D plot of depth image with a color map corresponding to the intensity using the signal restoration & center-of-mass algorithm method. We get the depth-intensity 3D merged image. The measured mean distance of the target A, B, and C are 525.4 cm, 519.7 cm, and 514.8 cm, respectively. The corresponding range walk errors are +0.4 cm, +0.2 cm, and −0.2 cm, respectively. The restraint of range walk error is effective. The measured mean intensity of the target A, B, and C are 0.492, 0.231, and 0.314 photoelectrons. The relative accuracy of intensity measurement, obtained by Eq. (9), is less than 3%. We can clearly observe three distance values from the distance distribution histogram of Fig. 5(b), as shown in Fig. 5(d). There is no overlap between each other. The range precision, obtained by Eq. (10), is 0.6 cm, which is high enough.
![]()
Figure 5.Experimental imaging results of center-of-mass algorithm method. (a) Depth image with a color map corresponding to the distance using the traditional center-of-mass algorithm method. (b) 3D plot of depth image with a color map corresponding to the intensity using the signal restoration & center-of-mass algorithm method. (c) Distance distribution histogram of
The signal restoration & Gaussian functions fitting method, and the signal restoration & center-of-mass algorithm method both can effectively suppress the range walk error and obtain high-precision depth-intensity 3D merged image of the target. However, the signal restoration & Gaussian functions fitting method is inconvenient. The target distance is determined by the peak position of the fitting curve, which is the sum of two Gaussians. Nevertheless, the small region near the peak is smooth and nearly straight line in some cases. This condition excessively increases the uncertainly of the peak position. Therefore, the first method has lower range precision of 1.2 cm. Fortunately, the weighted method can solve this problem. The signal restoration & center-of-mass algorithm method is more convenient and more stable. The restraining effect on the range walk error is very good. The second method has higher range precision of 0.6 cm.
3 Conclusion
Due to the first photon bias effect of Gm-APD, there exists range walk error in the Gm-APD lidar. It will cause deterioration with signal enhancing and pulse width broadening. The fluctuation in the number of signal photoelectrons reflected from the target can cause different range walk errors, which will generate the distortion of depth image of the target. In this paper, two methods to restrain the range walk error are presented and verified by experiments. A high precision of 3D image of the target is obtained, respectively.
Firstly, we theoretically analyze the principle of range walk error in Gm-APD lidar. Secondly, we propose a signal restoration method to obtain SPDH from the PCDH, which can also obtain the intensity of the target. Gaussian functions fitting method and center-of-mass algorithm method are used to capture the distance from the SPDH, respectively. Finally, we verified the two methods by experiments. The relative accuracy of intensity measurement of the two methods are both less than 3%. The first method has lower range precision of 1.2 cm. The second method has higher range precision of 0.6 cm.
Both the two methods use data processing methods to improve the range precision. In order to further improve the range precision, devices with higher performance parameters can also be used. For example, using a Gm-APD module with lower time jitter, a photon counting board with higher time resolution, and a laser with a more stable pulse waveform. However, these will inevitably cause much more cost of system manufacturing. The main factor that limits the range precision is the time jitter of the Gm-APD module. It is about 1000 ps in these experiments. It can be replaced by a Gm-APD module with a time jitter of several hundred ps.
References
[1] Steinvall O, Sjöqvist L, Henriksson M. Photon counting ladar wk at FOI, Sweden[C] Proc SPIE, 2012, 8375: 83750C.
[2] L Luo, C Wu, J Lin, et al. Time-domain denoising based on photon-counting LiDAR. Optics and Precision Engineering, 26, 1175-1180(2018).
[3] L Xu, Y Zhang, Y Zhang, et al. Four Gm-APDs photon counting imaging lidar to improve detection performances. Infrared and Laser Engineering, 44, 2583-2587(2015).
[4] M A Albota, B F Aull, D G Fouche, et al. Three-dimensional imaging laser radars with Geiger-mode avalanche photodiode arrays. Lincoln Laboratory Journal, 13, 351-370(2002).
[5] P Cho, H Anderson, R Hatch, et al. Real-time 3D ladar imaging. Lincoln Laboratory Journal, 16, 147-164(2006).
[6] L Ma, W Lu, P Jiang, et al. Research on 3D range reconstruction algorithm of Gm-APD lidar based on matched filter. Infrared and Laser Engineering, 49, 020500(2020).
[7] Buller G S, Krichel N J, McCarthy A, et al. Kilometer range depth imaging using timecrelated singlephoton counting[C] Proc SPIE, 2011, 8155: 81551I.
[8] R Lussana, F Villa, Mora A Dalla, et al. Enhanced single-photon time-of-flight 3D ranging. Optics Express, 23, 24962-24973(2015).
[9] D Liu, J Sun, P Jiang, et al. GM-APD lidar range image reconstruction based on neighborhood KDE. Infrared and Laser Engineering, 48, 630001(2019).
[10] A Kirmani, D Venkatraman, D Shin, et al. First-photon imaging. Science, 343, 58-61(2014).
[11] R A Barton-Grimley, J P Thayer, M Hayman. Nonlinear target count rate estimation in single-photon lidar due to first photon bias. Optics Letters, 44, 1249-1252(2019).
[12] L Xu, Y Zhang, Y Zhang, et al. Restraint of range walk error in a Geiger-mode avalanche photodiode lidar to acquire high-precision depth and intensity information. Applied Optics, 55, 1683-1687(2016).
[13] M S Oh, H J Kong, T H Kim, et al. Reduction of range walk error in direct detection laser radar using a Geiger mode avalanche photodiode. Optics Communications, 283, 304-308(2010).
[14] W He, B Sima, Y Chen, et al. A correction method for range walk error in photon counting 3D imaging LIDAR. Optics Communications, 308, 211-217(2013).
[15] L Ye, G Gu, W He, et al. A real-time restraint method for range walk error in 3-D imaging lidar via dual detection. IEEE Photonics Journal, 10, 1-9(2018).
[16] L Xu, Y Zhang, Y Zhang, et al. Signal restoration method for restraining the range walk error of Geiger-mode avalanche photodiode lidar in acquiring a merged three-dimensional image. Applied Optics, 56, 3059-3063(2017).
[17] Johnson S, Gatt P, Nichols T. Analysis of Geigermode APD laser radars[C] Proc SPIE, 2003, 5086: 359368.
[18] Y Wu, M Zhou, Q Zhao, et al. Threshold-peak dual-channel time discrimination method for pulse laser ranging. Infrared and Laser Engineering, 48, 0606002(2019).
[19] J Busck, H Heiselberg. Gated viewing and high-accuracy three-dimensional laser radar. Applied Optics, 43, 4705-4710(2004).


Set citation alerts for the article
Please enter your email address

© Copyright 2018-2021 | Chinese Laser Press. All Rights Reserved 沪ICP备15018463号-20