
You-Zeng Hao, Fu-Li Wang, Min Tang, Hai-Zhong Weng, Yue-De Yang, Jin-Long Xiao, Yong-Zhen Huang, "Widely tunable single-mode lasers based on a hybrid square/rhombus-rectangular microcavity," Photonics Res. 7, 543 (2019)
- Photonics Research
- Vol. 7, Issue 5, 543 (2019)
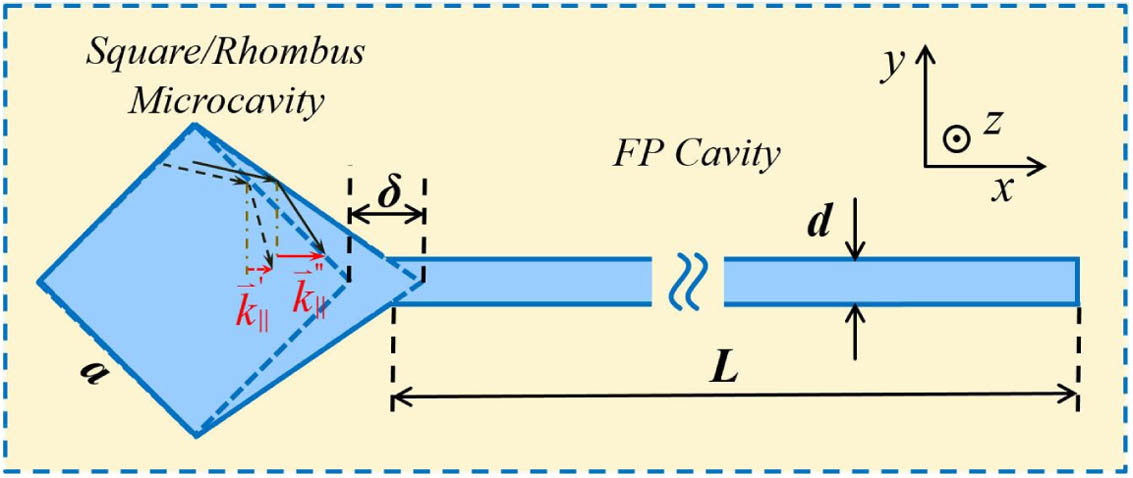
Fig. 1. Schematic diagram of the coupled-cavity laser composed of an FP cavity and a square/rhombus microcavity as a deformed square microcavity with a vertex extending a distance of δ
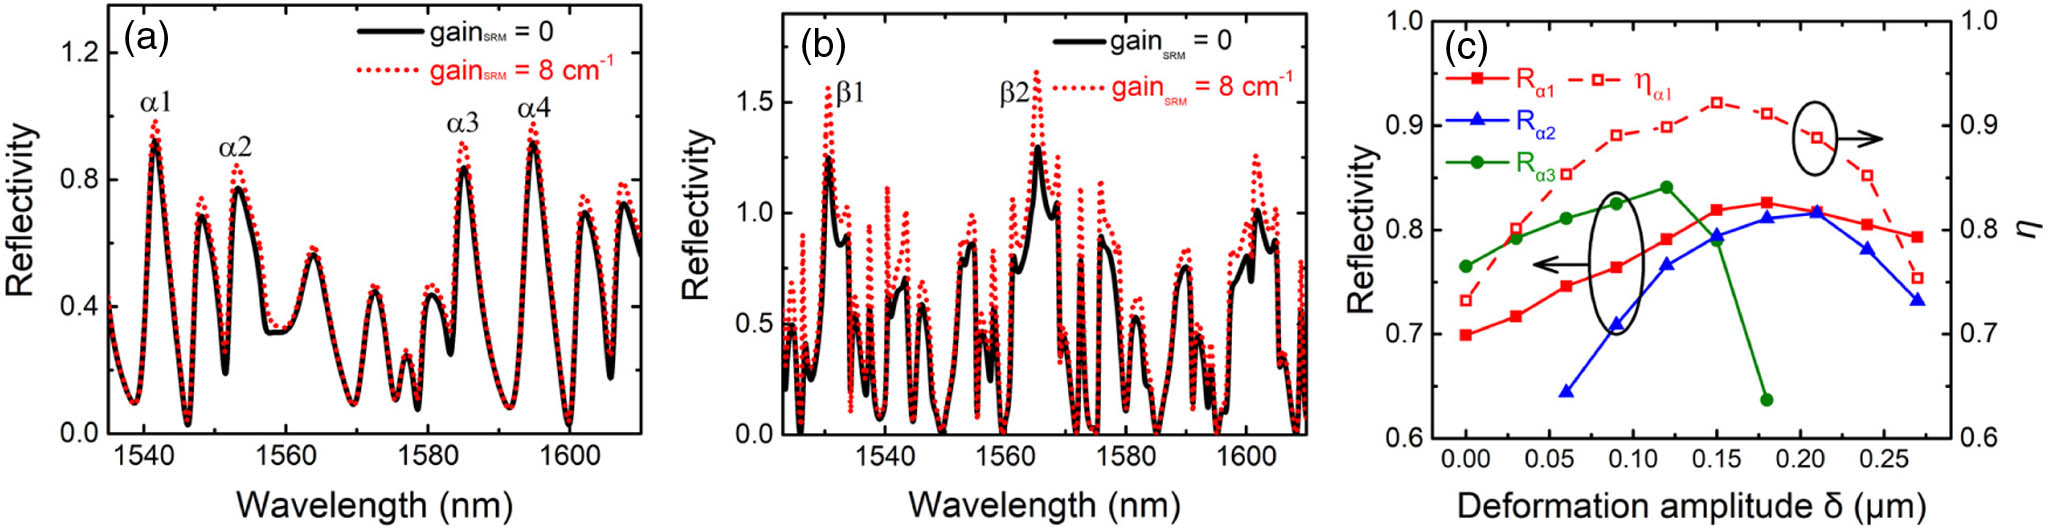
Fig. 2. Simulated reflectivity spectra at different gain levels obtained by FDTD simulation for an SRM connected to a vertex waveguide, with (a) the side length a = 10 μm δ = 0.15 μm d = 2 μm a = 15 μm δ = 0.25 μm d = 2 μm α 1 α 2 α 3 η α 1 δ a = 10 μm d = 2 μm L = 300 μm
Fig. 3. Mode intensity profiles of H z
Fig. 4. Simulated far-field intensity profiles and mode intensity profiles of H z Q a = 10 μm δ = 0.15 μm d = 2 μm L = ( a ) a = 10 μm d = 2 μm L = ( d ) η
Fig. 5. Microscopic image of an HSRRL with patterned p-electrodes for current injection into the SRM and FP cavities separately.
Fig. 6. Output powers coupled into an SMF versus I FP I SRM L = 300 μm d = 2 μm a = 10 μm δ = 0.15 μm a = 15 μm δ = 0.25 μm
Fig. 7. Lasing characteristics with the variations of I FP I SRM a = 15 μm δ = 0.25 μm d = 2 μm L = 300 μm I SRM I FP = 64 mA I FP I SRM = 20 mA I SRM I FP = 64 mA I FP I SRM = 20 mA
Fig. 8. Superimposed lasing spectra for HSRRLs at L = 300 μm d = 2 μm a = 15 μm δ = 0.25 μm a = 10 μm δ = 0.15 μm a = 15 μm a = 10 μm
Fig. 9. Small single modulation responses of an HSRRL with a = 15 μm δ = 0.25 μm L = 300 μm d = 2 μm I FP = 30 ( I FP − I th ) 1 / 2 I SRM = 5 mA
Fig. 10. (a) 25-Gb/s and (b) 35-Gb/s eye diagrams for HSRRL with a = 15 μm δ = 0.25 μm d = 2 μm L = 300 μm I SRM = 14 mA I FP = 68 mA


Set citation alerts for the article
Please enter your email address

© Copyright 2018-2021 | Chinese Laser Press. All Rights Reserved 沪ICP备15018463号-20