
Yang YU, Yan YOU, Xu-Dong CHEN, Ling-Bo QIAO, Zi-Ran ZHAO. Research on the MIMO short-range imaging mechanism of millimeter wave for fast and accurate reconstruction[J]. Journal of Infrared and Millimeter Waves, 2021, 40(5): 638
- Journal of Infrared and Millimeter Waves
- Vol. 40, Issue 5, 638 (2021)

Fig. 1. Schematic diagram of SISO imaging mechanism
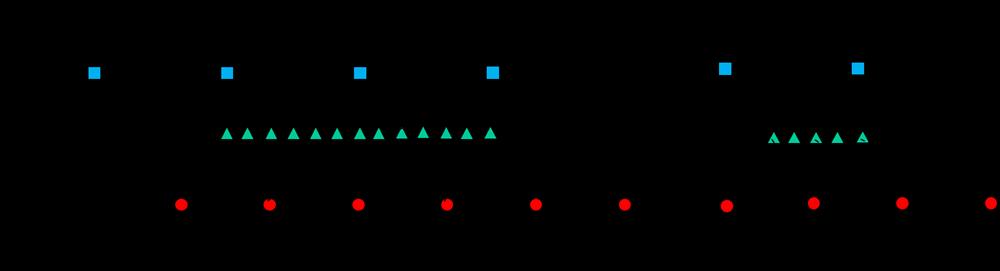
Fig. 2. Diagram of MIMO linear array configuration adopted by the proposed new MIMO mechanism
Fig. 3. Diagram of MIMO linear array configuration adopted by the traditional MIMO mechanism
Fig. 4. Drawing of resolution chart
Fig. 5. Illustration of mannequin
Fig. 6. Reconstructed images (maximum projection) of resolution chart via numerical simulattons (a) SISO array with RMA (b) traditional MIMO array with RMA (c) traditional MIMO array with BPA (d) 1:4:69 MIMO array with RMA (e) 2:3:47 MIMO array with RMA (f) 1:8:35 MIMO array with RMA (g) 1:10:28 MIMO array with RMA
Fig. 7. PSFs of different arrays or different mechanisms for numerical simulations. (a) different arrays. (b) different mechanisms
Fig. 8. Reconstructed images (maximum projection) of mannequin via electromagnetic simulations. (a) SISO array with RMA. (b)1:4:69 MIMO array with RMA
Fig. 9. PSFs of different mechanisms for electromagnetic simulation
Fig. 10. Photograph of vertical scanner
Fig. 11. Schematic diagram and photograph of SISO imaging system (a) Schematic diagram (b) Photograph.
Fig. 12. Measurement of the resolution test chart (a) Photograph (b) Reconstructed image of 1:4:69 MIMO array with RMA (c) Reconstructed image of SISO array with RMA
Fig. 13. Measurement of the child mannequin (a) Photograph (b) Reconstructed image of 1:4:69 MIMO array with RMA
|
Table 1. Comparation on Antenna utilization rate, computational time and PSLR of different Imaging mechanisms or arrays, in numerical simulations
|
Table 2. Comparation on Antenna utilization rate, computational time and PSLR of different mechanism in electromagnetic simulations.

Set citation alerts for the article
Please enter your email address
© Copyright 2018-2021 | Chinese Laser Press. All Rights Reserved 沪ICP备15018463号-20