• Opto-Electronic Advances
  • Vol. 3, Issue 1, 190017-1 (2020)
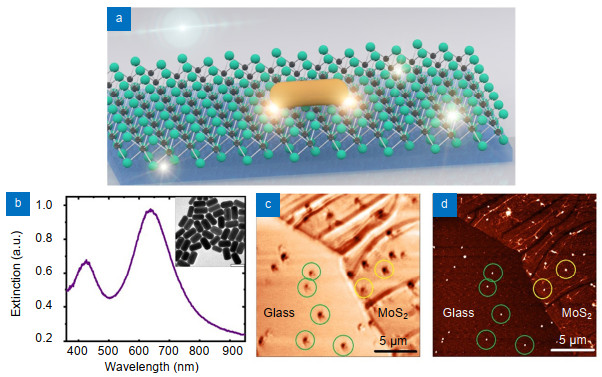
Aiqin Hu1、2, Shuai Liu1、3, Jingyi Zhao1, Te Wen1, Weidong Zhang1, Qihuang Gong1、2, Yongqiang Meng3, Yu Ye1, and Guowei Lu1、2、*
Author Affiliations
  • 1State Key Laboratory for Mesoscopic Physics, Collaborative Innovation Center of Quantum Matter, Nano-optoelectronics Frontier Center of the Ministry of Education, School of Physics, Peking University, Beijing 100871, China
  • 2Collaborative Innovation Center of Extreme Optics, Shanxi University, Taiyuan, Shanxi 030006, China
  • 3School of Materials Science and Engineering, Hebei University of Science and Tech-nology, Shijiazhuang 050018, China
  • show less
    DOI: 10.29026/oea.2020.190017 Cite this Article
    Aiqin Hu, Shuai Liu, Jingyi Zhao, Te Wen, Weidong Zhang, Qihuang Gong, Yongqiang Meng, Yu Ye, Guowei Lu. Controlling plasmon-exciton interactions through photothermal reshaping[J]. Opto-Electronic Advances, 2020, 3(1): 190017-1 Copy Citation Text show less
    (a) Schematic diagram of GNRs-MoS2 hybrid on the glass substrate. (b) Extinction spectra of GNRs in aqueous solution. Inset: transmission electron micrographs of the GNRs with a scale bar of 100 nm. (c), (d) Optical confocal scanning image and AFM image of the GNRs-MoS2, respectively. The green and yellow circles indicate the positions of single GNR on glass and MoS2 monolayer, respectively, with a scale bar of 5 μm.
    Fig. 1. (a) Schematic diagram of GNRs-MoS2 hybrid on the glass substrate. (b) Extinction spectra of GNRs in aqueous solution. Inset: transmission electron micrographs of the GNRs with a scale bar of 100 nm. (c), (d) Optical confocal scanning image and AFM image of the GNRs-MoS2, respectively. The green and yellow circles indicate the positions of single GNR on glass and MoS2 monolayer, respectively, with a scale bar of 5 μm.
    Photothermal reshaping of a single GNR on the glass substrate. (a) Scattering spectra of a GNR on the glass tuned by photothermal reshaping effect through controlling the illumination power. The blue-dashed line in (a) is the photoluminescence spectra of the MoS2 monolayer. (b) FWHM and intensity of scattering spectra during the photothermal reshaping. Inset shows the blue-shift of the plasmon resonance of GNR. The color in (b) corresponds to the color of the scattering spectra in (a). (c) Influence of laser power (~0.11 mW to ~4.16 mW) on monolayer MoS2 on the glass. (d) PL intensity and A exciton position changes during the photothermal reshaping. Excitation laser wavelength: 532 nm. Excitation power: 110 μW. Integration time: 0.5 s.
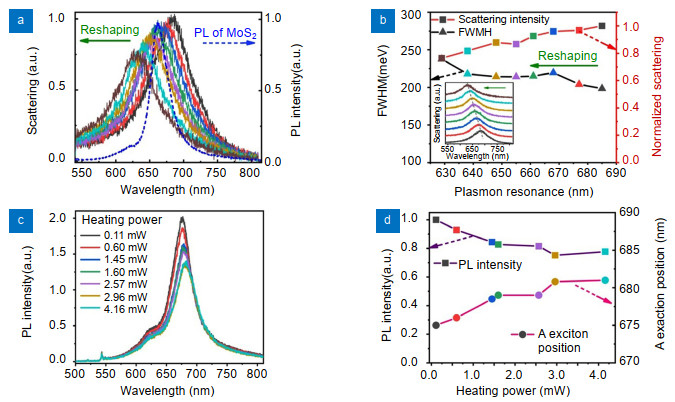
    Fig. 2. Photothermal reshaping of a single GNR on the glass substrate. (a) Scattering spectra of a GNR on the glass tuned by photothermal reshaping effect through controlling the illumination power. The blue-dashed line in (a) is the photoluminescence spectra of the MoS2 monolayer. (b) FWHM and intensity of scattering spectra during the photothermal reshaping. Inset shows the blue-shift of the plasmon resonance of GNR. The color in (b) corresponds to the color of the scattering spectra in (a). (c) Influence of laser power (~0.11 mW to ~4.16 mW) on monolayer MoS2 on the glass. (d) PL intensity and A exciton position changes during the photothermal reshaping. Excitation laser wavelength: 532 nm. Excitation power: 110 μW. Integration time: 0.5 s.
    (a) Normalized scattering spectra of a GNR on glass (black), the same GNR moved onto MoS2 (red), and the GNR on MoS2 after heating (blue). (b) Photoluminescence spectra of MoS2 monolayer without (red) and with (black) GNR. The black dashed line in (b) marks the A (right) and B (left) excitons absorption peak. Inset: Raman spectra of MoS2 monolayer with the A1g peak (408 cm−1) and E2g1 peak (388 cm−1). Excitation laser wavelength: 532 nm. Excitation power: 110 μW. Integration time: 0.5 s. (c) Calculated scattering spectra using the FDTD method corresponding to the experimental spectra shown in (a). Scattering spectra of a GNR (L/D~2.4) on glass (black), the same GNR (L/D~2.4) on MoS2 (red) and another GNR (L/D~2.2) on MoS2 (blue). (d) Near-field distributions: the calculated near-field distribution |E| in the x-z plane (y=0 nm) (upper) and in the x-y plane (z=0 nm) (lower), i.e., the interface between GNR and MoS2.
    Fig. 3. (a) Normalized scattering spectra of a GNR on glass (black), the same GNR moved onto MoS2 (red), and the GNR on MoS2 after heating (blue). (b) Photoluminescence spectra of MoS2 monolayer without (red) and with (black) GNR. The black dashed line in (b) marks the A (right) and B (left) excitons absorption peak. Inset: Raman spectra of MoS2 monolayer with the A1g peak (408 cm−1) and E2g1 peak (388 cm−1). Excitation laser wavelength: 532 nm. Excitation power: 110 μW. Integration time: 0.5 s. (c) Calculated scattering spectra using the FDTD method corresponding to the experimental spectra shown in (a). Scattering spectra of a GNR (L/D~2.4) on glass (black), the same GNR (L/D~2.4) on MoS2 (red) and another GNR (L/D~2.2) on MoS2 (blue). (d) Near-field distributions: the calculated near-field distribution |E| in the x-z plane (y=0 nm) (upper) and in the x-y plane (z=0 nm) (lower), i.e., the interface between GNR and MoS2.
    Plasmon exciton interaction in the GNR-MoS2 hybrid. (a) Scattering spectra of individual GNR coupled to the monolayer MoS2 flake. The vertical purple and grey dashed lines in (a) mark the A and B excitons absorption peaks. (b) Corresponding PL spectra (black line) of GNR-MoS2 hybrid during the photothermal reshaping. The vertical orange dashed line in (b) marks A exciton absorption peak of MoS2 with GNR, and the vertical gray dashed line in (b) marks A exciton absorption peak of pristine MoS2 without GNR. The dashed curve in (b) shows the scattering spectra. (c) Changes in the linewidth of scattering spectra of GNR-MoS2 hybrid with heating power. The color in (c) corresponds to the color of the scattering spectra in (a). (d) Hybrid plasmon-exciton branches as a function of detuning. The dots (red spheres correspond to upper energy branch, blue sphere to lower energy branch, green squares to plasmon resonance) correspond to extracted experimental values, and the curves are theoretical results. Black and green lines indicate the dispersion of the uncoupled exciton and plasmon, respectively.
    Fig. 4. Plasmon exciton interaction in the GNR-MoS2 hybrid. (a) Scattering spectra of individual GNR coupled to the monolayer MoS2 flake. The vertical purple and grey dashed lines in (a) mark the A and B excitons absorption peaks. (b) Corresponding PL spectra (black line) of GNR-MoS2 hybrid during the photothermal reshaping. The vertical orange dashed line in (b) marks A exciton absorption peak of MoS2 with GNR, and the vertical gray dashed line in (b) marks A exciton absorption peak of pristine MoS2 without GNR. The dashed curve in (b) shows the scattering spectra. (c) Changes in the linewidth of scattering spectra of GNR-MoS2 hybrid with heating power. The color in (c) corresponds to the color of the scattering spectra in (a). (d) Hybrid plasmon-exciton branches as a function of detuning. The dots (red spheres correspond to upper energy branch, blue sphere to lower energy branch, green squares to plasmon resonance) correspond to extracted experimental values, and the curves are theoretical results. Black and green lines indicate the dispersion of the uncoupled exciton and plasmon, respectively.
    Aiqin Hu, Shuai Liu, Jingyi Zhao, Te Wen, Weidong Zhang, Qihuang Gong, Yongqiang Meng, Yu Ye, Guowei Lu. Controlling plasmon-exciton interactions through photothermal reshaping[J]. Opto-Electronic Advances, 2020, 3(1): 190017-1
    Download Citation