
Jia Sun, Dabo Guo, Tiantian Yang, Shitu Ma. Real-Time Object Detection Based on Improved YOLOv3 Network[J]. Laser & Optoelectronics Progress, 2020, 57(22): 221505
- Laser & Optoelectronics Progress
- Vol. 57, Issue 22, 221505 (2020)
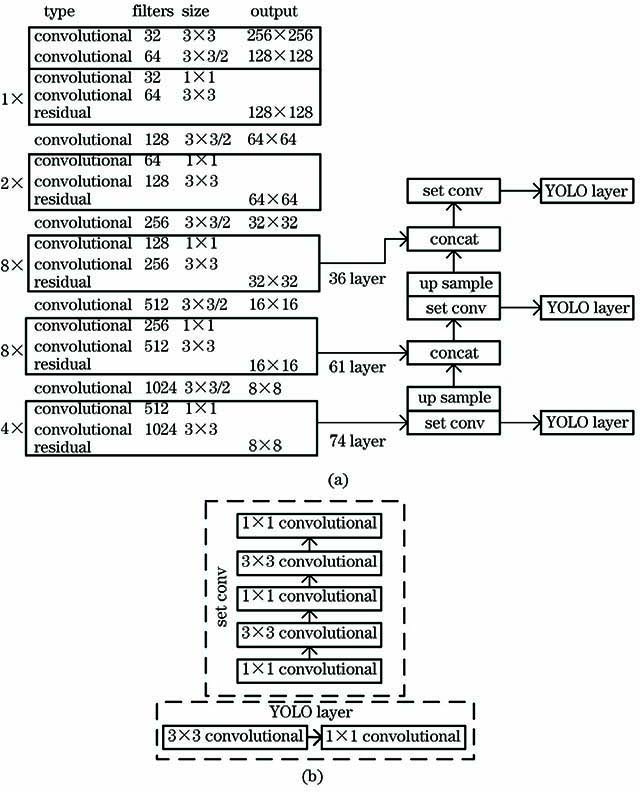
Fig. 1. YOLOv3 network structure diagram. (a) Overall structure diagram of YOLOv3 network; (b) structure diagram of set conv layer and YOLO layer
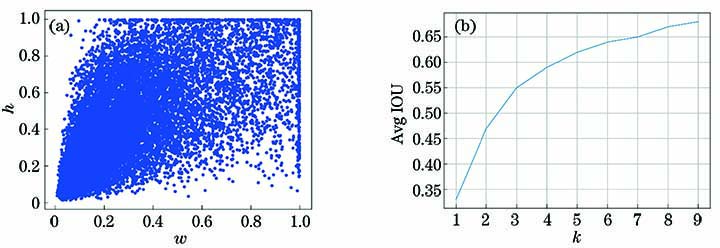
Fig. 2. Dataset analysis results. (a) Target width and height distribution of the dataset; (b) k-means clustering analysis result
Fig. 3. Average IOU. (a) Relationship between Avg IOU and Mean IOU; (b) Avg IOU of k-means and k-thresh
Fig. 4. Image of object detection
Fig. 5. Video-YOLOv3 network structure. (a) Overall structure diagram of video-YOLOv3 network; (b) structure diagram of splice-conv module
Fig. 6. Comparison of network structure. (a) YOLOv3 network structure; (b) video-YOLOv3 network structure
Fig. 7. Flow chart of predicting new image
Fig. 8. Loss function and Avg IOU curve of video-YOLOv3. (a) Loss function curve; (b) Avg IOU curve
Fig. 9. Comparison of test results. (a) YOLOv3 test results; (b) video-YOLOv3 test results
Fig. 10. Comparison of real-time detection. (a) Detection every 5 frames; (b) detection every 6 frames; (c) detection every 7 frames
|
Table 1. Number of images with each type of object in the dataset
| ||||||||||||||||||||||||||||
Table 2. mAP values of different models on the dataset unit: %
| |||||||||||||||||||
Table 3. Comparison of CPU and GPU real-time detection time

Set citation alerts for the article
Please enter your email address
© Copyright 2018-2021 | Chinese Laser Press. All Rights Reserved 沪ICP备15018463号-20