• Photonics Research
  • Vol. 5, Issue 3, 201 (2017)
Jing Liu1 and Zhi-Yuan Li1、2、*
Author Affiliations
  • 1Key Laboratory of Optical Physics, Institute of Physics, Chinese Academy of Sciences, Beijing 100190, China
  • 2School of Physics and Optoelectronics, South China University of Technology, Guangzhou 510640, China
  • show less
    DOI: 10.1364/PRJ.5.000201 Cite this Article Set citation alerts
    Jing Liu, Zhi-Yuan Li. Light-driven crystallization of polystyrene micro-spheres[J]. Photonics Research, 2017, 5(3): 201 Copy Citation Text show less
    Experimental schematic diagram of the LOT setup. L1, lens 1; L2, lens 2; L3, lens 3; M1, reflection mirror 1; D1, dichroic mirror; M2, reflection mirror 2; L4, lens 4.
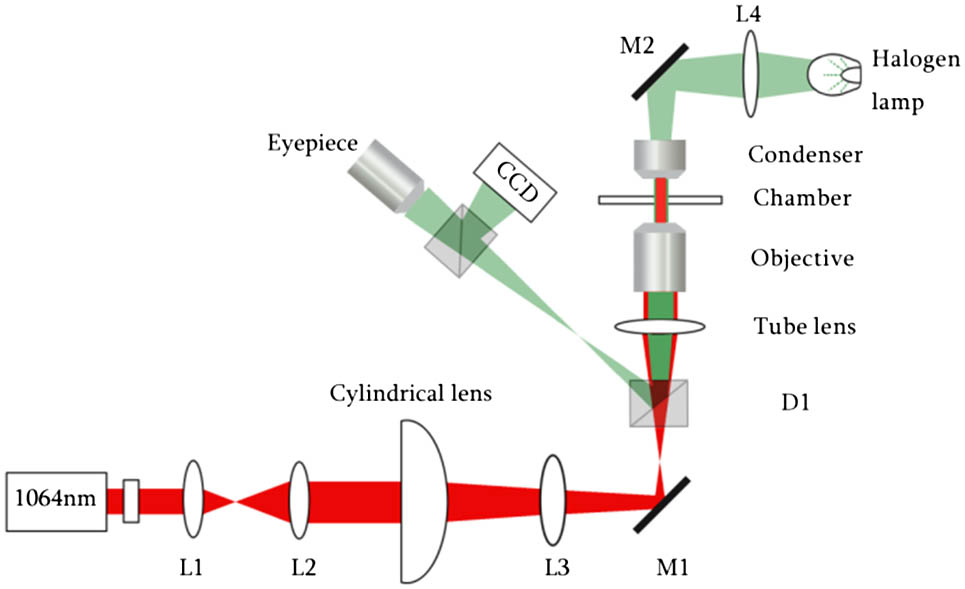
    Fig. 1. Experimental schematic diagram of the LOT setup. L1, lens 1; L2, lens 2; L3, lens 3; M1, reflection mirror 1; D1, dichroic mirror; M2, reflection mirror 2; L4, lens 4.
    Electric field amplitude distributions in (a1) xoy plane, (a2) xoz plane, and (a3) yoz plane, respectively. (b) The trapping potential energy surface calculated for the line optical trap in xoy plane. The optical trapping efficiencies (c1) Qx∼Sx, (c2) Qy∼Sy, and (c3) Qz∼Sz on a PS particle imposed by the LOT.
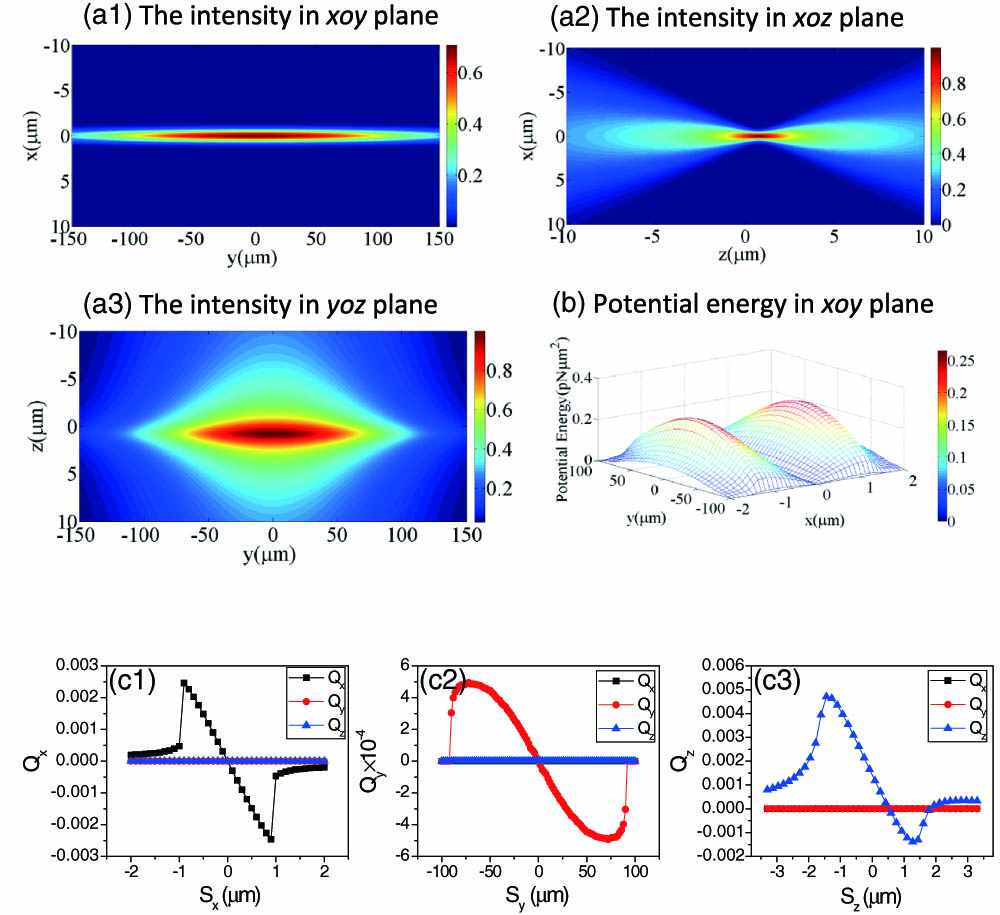
    Fig. 2. Electric field amplitude distributions in (a1) xoy plane, (a2) xoz plane, and (a3) yoz plane, respectively. (b) The trapping potential energy surface calculated for the line optical trap in xoy plane. The optical trapping efficiencies (c1) QxSx, (c2) QySy, and (c3) QzSz on a PS particle imposed by the LOT.
    1D crystallization of 3 μm diameter PS spheres in an LOT. (a) Epitaxial growth pattern. (b) Inserted growth pattern. The recorded microscopy snapshot images clearly show the dynamic process of crystallization of PS beads, where the red circle with red arrow indicates the new arriving PS bead. In the epitaxial growth pattern, the new arriving PS bead would allocate at the two ends of the existing 1D crystal line, while, in the inserted growth pattern, the new arriving PS bead would insert into and finally allocate somewhere inside the existing 1D crystal line. The schematic illustration of each growth pattern in 1D crystallization process is included at the top of each figure.
    Fig. 3. 1D crystallization of 3 μm diameter PS spheres in an LOT. (a) Epitaxial growth pattern. (b) Inserted growth pattern. The recorded microscopy snapshot images clearly show the dynamic process of crystallization of PS beads, where the red circle with red arrow indicates the new arriving PS bead. In the epitaxial growth pattern, the new arriving PS bead would allocate at the two ends of the existing 1D crystal line, while, in the inserted growth pattern, the new arriving PS bead would insert into and finally allocate somewhere inside the existing 1D crystal line. The schematic illustration of each growth pattern in 1D crystallization process is included at the top of each figure.
    Series of snapshots of microscopically recorded images illustrating the dynamic process of transformation from 1D crystallization to 2D crystallization. The schematic illustration of transformation is included at the top of the figure. Red circle emphasizes an additional particle entering the optical field. Green circle denotes the minimal energy position. The particles with residual momentum are marked with the blue rectangle. Black rectangle indicates the crystalline region undergoing a drastic structural change and transition.
    Fig. 4. Series of snapshots of microscopically recorded images illustrating the dynamic process of transformation from 1D crystallization to 2D crystallization. The schematic illustration of transformation is included at the top of the figure. Red circle emphasizes an additional particle entering the optical field. Green circle denotes the minimal energy position. The particles with residual momentum are marked with the blue rectangle. Black rectangle indicates the crystalline region undergoing a drastic structural change and transition.
    Two series of snapshots showing two growth patterns of a PS colloidal crystal in 2D crystallization process. (a) Epitaxial growth pattern. (b) Inserted growth pattern. Red rectangle indicates the ever-changing crystalline region. Red circle emphasizes an additional particle entering the optical field. In the epitaxial growth pattern, the new arriving PS beads would allocate at the two ends of the existing 2D crystal, while in the inserted growth pattern, those beads would insert into and finally allocate somewhere inside the existing 2D crystal. The schematic illustration of each growth pattern in 2D crystallization process is included at the top of each figure.
    Fig. 5. Two series of snapshots showing two growth patterns of a PS colloidal crystal in 2D crystallization process. (a) Epitaxial growth pattern. (b) Inserted growth pattern. Red rectangle indicates the ever-changing crystalline region. Red circle emphasizes an additional particle entering the optical field. In the epitaxial growth pattern, the new arriving PS beads would allocate at the two ends of the existing 2D crystal, while in the inserted growth pattern, those beads would insert into and finally allocate somewhere inside the existing 2D crystal. The schematic illustration of each growth pattern in 2D crystallization process is included at the top of each figure.
    Jing Liu, Zhi-Yuan Li. Light-driven crystallization of polystyrene micro-spheres[J]. Photonics Research, 2017, 5(3): 201
    Download Citation