Abstract
We investigate the dynamic crystallization processes of colloidal photonic crystals, which are potentially invaluable for solving a number of existing and emerging technical problems in regards to controlled fabrication of crystals, such as size normalization, stability improvement, and acceleration of synthesis. In this paper, we report systematic high-resolution optical observation of the spontaneous crystallization of monodisperse polystyrene (PS) micro-spheres in aqueous solution into close-packed arrays in a static line optical tweezers. The experiments demonstrate that the crystal structure is mainly affected by the minimum potential energy of the system; however, the crystallization dynamics could be affected by various mechanical, physical, and geometric factors. The complicated dynamic transformation process from 1D crystallization to 2D crystallization and the creation and annihilation of dislocations and defects via crystal relaxation are clearly illustrated. Two major crystal growth modes, the epitaxy growth pattern and the inserted growth pattern, have been identified to play a key role in shaping the dynamics of the 1D and 2D crystallization process. These observations offer invaluable insights for in-depth research about colloidal crystal crystallization.1. INTRODUCTION
Colloidal crystals have attracted renewed attention as they provide a natural and simple scheme to prepare 3D periodical dielectric structures, i.e., photonic crystals, modulated on the scale of optical wavelength and test various physical concepts of photonic crystals. Under specific conditions, a colloidal crystal can exhibit a forbidden band of frequencies, which gives rise to many potential and practical properties, such as photonic bandgaps [1–5], photon localization [6], negative refraction effect [7], and so on. Furthermore, colloidal crystal and one of its family members, known as opals, can provide an ideal scaffold for the creation of polymeric and inorganic samples with complex porous structures such as inverse opals [8–10]. As the self-assembly crystallization [11] of colloidal crystal brings several advantages such as simplicity of preparation, low cost, copious amounts, and a broad range of the lattice pitch size of bulk samples, this technique has been extensively employed as an effective tool for nano- and micro-fabrication of 3D photonic crystals. However, it remains a major challenge to improve the quality of colloidal crystal to a nearly perfect state from various aspects, such as reducing the dislocation and enlarging the single-crystalline domain size. This task would request significant efforts to further understand the subtle mechanical dynamics of the growth of colloidal crystal, namely, how the micro-particles are brought together one by one and assembled into a small cluster, how this cluster becomes a regular periodic array domain, and how the domain enlarges its size by attracting more and more micro-particles. Besides, other key issues such as the creation and annihilation of various defects and dislocations during the growth of colloidal crystal require special attention. However, due to the intrinsic difficulty and complexity of these issues, these issues remain mysterious to a large extent. It is then obvious that the capability to visualize this dynamic growth process, if developed, would significantly facilitate the efforts to address the challenging task. Surely optical imaging is a natural technology suitable for solving this problem.
The self-assembly of colloidal crystal can be affected by a variety of forces such as electrostatic repulsion, van der Waals attraction, and hydrogen bonding [12–14]. In most situations, these forces do not readily provide the specific control of particle assembly processes with a fast speed because of their extremely complicated competing and collective action effects. In previous works, considerable progress has been achieved in colloidal crystallization governed by microgravity [15], electrophoretic deposition [16], and magnetic fields [17]. Optical tweezers [18–20], invented by Ashkin et al. in the 1980s, provide a brand new and efficient way to manipulate colloidal particles in suspension. In consideration of the overall balanced power of optical trapping force, large area and volume of trap, and direct and fast optical visualization capability, a line optical tweezer (LOT) [21] presents an excellent technique to create the space for colloidal photonic crystal (CPC) growth in the microcosm and observe the dynamics and physics of crystallization in great details.
Optical confinement is tight in the transverse 2D space (the plane) and much weaker in the third (longitudinal) direction (the axis) of an LOT. This feature creates a sufficiently large 3D region for micro-particle crystallization, where the micro-particles are relatively free along the -axis direction and can find sufficient auxiliary space to assist their spontaneous arrangement into a regular crystalline array. The crystallization processes driven by the line optical fields can be rapid but precisely controlled. It should be noted that such a light-driven crystallization does not require a nucleation core to serve as the seeds for subsequent crystal growth. This light-driven self-assembly crystallization brings simplicity and efficiency of samples preparation and has great potential for extending to prepare multi-shape samples. Moreover, this crystallization process is not affected by the gravity of samples, the natural evaporation of surrounding medium, and the thermal effect.
Sign up for Photonics Research TOC. Get the latest issue of Photonics Research delivered right to you!Sign up now
Our experimental research aims to explore the dynamic self-assembly crystallization processes of monodisperse polystyrene (PS) micro-particles in an LOT. In the experiments, we observe that the formation of a colloidal crystal follows two major growth patterns, the epitaxial growth pattern and the inserted growth pattern, respectively, and these two growth patterns appear in both 1D and 2D array crystals. In addition, we also observe the complicated but interesting transformation from 1D crystallization pattern to 2D crystallization pattern. All these processes are the consequence of the minimum potential energy of a system reached via the interaction between multiple micro-sphere particles and the line optical field as well as the subtle spatial and momentum conditions of each micro-sphere particle going into the crystalline array within the LOT.
2. EXPERIMENTAL SETUP AND SAMPLE PREPARATION
The experimental setup for manipulating monodispersed PS micro-sphere particles in aqueous solution with the LOT is shown in Fig. 1. A collimated laser beam (Nd:YAG Coherent Compass, 1064 nm) is expanded by lenses L1 and L2 and then introduced into a cylindrical lens, which converts a circular-shaped Gaussian beam into a line-shape beam. After that, the line-shape beam is reflected by a mirror into a water-immersion objective (Leica, , ) in an inverted microscopy (Leica DMIRB). As a result, the LOT is generated. The LOT is basically an asymmetric focused optical beam with loose confinement along the axis and tight confinement in the plane, and the intensity is higher at the center and lower at both ends of the line. Despite this asymmetry, the LOT is still a form of 3D optical trap and allows microscopic particles to be confined in the transverse 2D direction and relatively be free in the longitudinal direction.
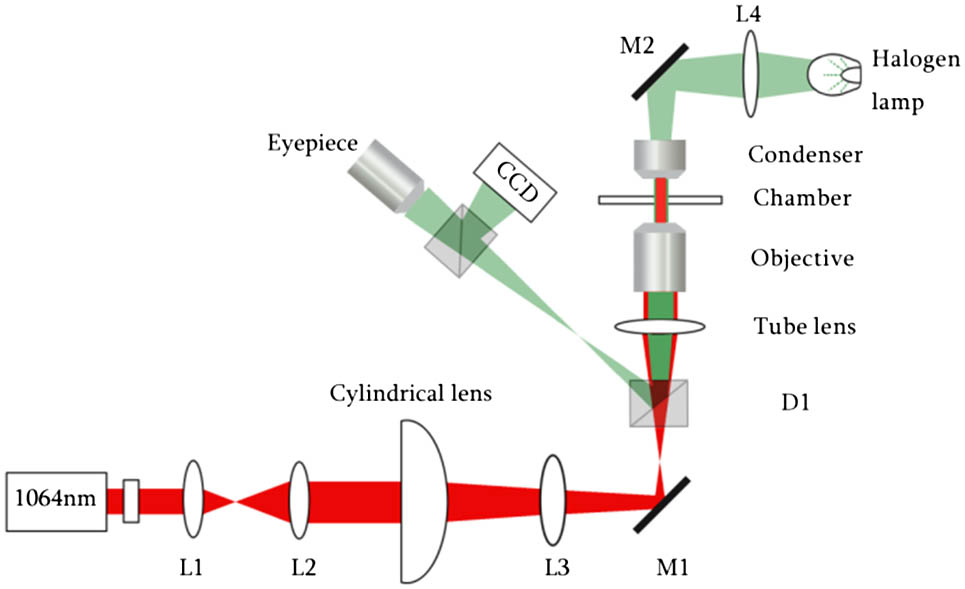
Figure 1.Experimental schematic diagram of the LOT setup. L1, lens 1; L2, lens 2; L3, lens 3; M1, reflection mirror 1; D1, dichroic mirror; M2, reflection mirror 2; L4, lens 4.
The spherical 3 μm diameter PS micro-particles used in the experiment are from Spherotech. Before the experiment, the particles are sonicated for 2 min. In order to reduce the risk of trapping several particles simultaneously, the particles are further diluted in de-ionized water to a low concentration but sufficiently dense to allow the experiment to complete a cycle within a limited time of several minutes. The solution of PS particles is encapsulated between two glass coverslips to avoid external environmental pollution.
3. INTENSITY DISTRIBUTION OF THE LINEAR GAUSSIAN BEAM
The collimated linear Gaussian beam at a wavelength propagates along the axis and is focused by a high water-immersion objective. According to Ref. [22], the linear Gaussian beam can be regarded as two independent beams, namely, the beam and beam, respectively. The complex electric field of a generalized linear Gaussian beam can be expressed by where and stand for the radii of the beam and beam, respectively. The phase delay is given by . In Eq. (1), for the beam, , , and . Here, is the refractive index of the surrounding medium. Similarly, in the plane, these parameters are , , and . In experiments, the waist radius of the beam is . After modulation of the cylindrical lens, the waist radius of the beam is about 100 μm. The focus position of the beam is , while the focus position of the beam is . The electric field amplitude distributions in the , , and planes are plotted in Figs. 2(a1)–2(a3). All the electric field amplitude distributions are normalized with respect to the amplitude of the incident electric field .
In order to describe the trapping force , which is linearly proportional to the total incident optical power , we define the trapping efficiency as follows, . We apply the procedures and methods developed in Ref. [23] to calculate the trapping efficiency of a PS bead in an LOT when the particle with radius moves around the focus point along the , , and axes, respectively. It can be seen in Figs. 2(c1)–2(c3) that the equilibrium position of the PS bead is . In contrast with the equilibrium position of the PS bead trapped in a single point optical tweezers [24], the PS bead has a larger longitudinal offset along the axis due to the weaker binding force. The most significant difference lies in the axis. The optical trapping coefficient of a PS bead in the LOT is much smaller than that in the single-point optical tweezers. In order to obtain the intuitive visual image of the binding energy of this optical system, the trapping potential energy surface is defined and calculated by the following formula: where , , and . The potential energy is plotted in Fig. 2(b).

Figure 2.Electric field amplitude distributions in (a1) plane, (a2) plane, and (a3) plane, respectively. (b) The trapping potential energy surface calculated for the line optical trap in plane. The optical trapping efficiencies (c1) , (c2) , and (c3) on a PS particle imposed by the LOT.
The full crystalline process of the PS beads can be continuously monitored by the optical imaging devices adjunct to the LOT system. For a better illustration and quantitative analysis of the crystallization processes, a series of snapshots is imaged and recorded while the self-assembly of PS particles occurs. In an LOT, the gradient of the nonuniform electric field intensity generates a gradient optical force, which dragged a PS particle toward the focal line center. It is this weak gradient force pointing toward the focal line center that drives the PS particle to move along the focal line and ultimately stop at the line center. The second PS particle follows a similar path, and these two particles are arranged symmetrically relative to the line center after competing with each other to occupy the most stable positions of the LOT. Then, one by one, a mushrooming number of PS microspheres are attracted and self-organized into an array at the position where the line optical trap is located. With the increasing amount of particles, a long array of particles is automatically rearranged and transformed into two arrays or even more arrays. In this crystallization process, PS microspheres are spontaneously crystallized into 2D close-packed arrays under the driving action of the optical force.
4. PROCESS AND MODEL OF PS BEAD CRYSTALLIZATION
A. 1D Crystallization
On the basis of experimental data, we classify the crystallization process into two growth patterns. One growth model is the epitaxial growth pattern, and the notable feature is that the crystal extends its size by adding PS beads from both ends, as shown in Fig. 3(a) and as visualized from Visualization 1 in the supporting information (SI). At the beginning, an optical force pushes a particle from the border of the LOT into the crystallization region. Then, the particle experiences a lateral weak gradient force and moves toward the focal line center. Meanwhile, it decelerates under the influence of the viscous force. Finally, the particle would find itself arranged to the crystal edge when it stops. As the lateral momentum of a particle is dissipated by the surrounding solution, this growth pattern has little effect of collision to the formed structure of the crystal. Our experiment shows that this kind of growth pattern exists throughout the crystallization process.
Figure 3.1D crystallization of 3 μm diameter PS spheres in an LOT. (a) Epitaxial growth pattern. (b) Inserted growth pattern. The recorded microscopy snapshot images clearly show the dynamic process of crystallization of PS beads, where the red circle with red arrow indicates the new arriving PS bead. In the epitaxial growth pattern, the new arriving PS bead would allocate at the two ends of the existing 1D crystal line, while, in the inserted growth pattern, the new arriving PS bead would insert into and finally allocate somewhere inside the existing 1D crystal line. The schematic illustration of each growth pattern in 1D crystallization process is included at the top of each figure.
The other growth model is the inserted growth pattern. In this pattern, the particles insert into the inner region of the crystal and push aside the neighboring PS beads to extend its length, as presented in Fig. 3(b) (also as shown in Visualization 1 in SI). The particles underneath the crystal are dragged into the crystal by the optical force. Then they squeeze and push away the surrounding particles and consume most of their lateral momentum. The inserted particles finally become part of the crystal after several seconds for the whole crystal to relax and stabilize eventually. The kinetic energy consumption through collision among particles is faster than that through friction between particles and surrounding medium. Thus, the inserted growth takes less time to reach the steady state than that of the epitaxial growth.
In fact, our experiments indicate that no matter how the PS microspheres are assembled into a crystal, they are always well arranged in a close-packed line array. The linear array structure of the crystal depends on the optical field intensity distribution. This feature informs us that the crystalline shapes can be controlled by different optical fields, such as a circular, triangular, and rectangle optical field.
B. Transformation from 1D Crystallization to 2D Crystallization
With the increasing number of PS particles entering the trap, the above linear growth does not benefit the maintenance of minimum potential energy. Thus, the lateral growth of a crystal is an inevitable trend, which leads to the transformation from 1D crystallization to 2D crystallization. According to the accumulated experience from a number of experiments, there exists three crucial factors influencing the crystallization transformation: the minimum energy position, an external particle entering into the LOT, and particles with lateral momentum.
The whole transformation can be seen in Visualization 2 in SI. In order to illustrate the transformation, a series of snapshots are captured, as shown in Fig. 4. In the first and second snapshots, the blur position, which is marked by a green circle, indicates that there is a particle beneath the 1D crystal. In addition, where the blur position lies is the minimum potential energy position. Thus, when an additional particle enters the trap, it tends to be trapped and auto-arranged to this blur position. This additional particle squeezing into the 1D crystal array will generate a defect in the 1D crystal and make the crystal unstable. At this time, when more and more particles are trapped into the edge region of the 1D crystal (when the time ), these particles with residual momentum will collide with the unstable 1D crystal array from the two remote ends and significantly increase the possibility to create a crystal dislocation right at the position of the additional particle. This dislocation will lead to the transformation from 1D crystallization to 2D crystallization. During this period, the kinetic energy of the system is rapidly consuming via collision and friction. In the next few seconds, the particles are adjusted automatically and form a 2D hexagonal close-packed pattern.
Figure 4.Series of snapshots of microscopically recorded images illustrating the dynamic process of transformation from 1D crystallization to 2D crystallization. The schematic illustration of transformation is included at the top of the figure. Red circle emphasizes an additional particle entering the optical field. Green circle denotes the minimal energy position. The particles with residual momentum are marked with the blue rectangle. Black rectangle indicates the crystalline region undergoing a drastic structural change and transition.
C. Two-Dimensional Crystallization
The 2D crystallization scheme also can be classified into two growth patterns as described above. Similar to the 1D crystallization scheme, a particle from the border of the optical field is automatically arranged along the longitudinal direction, as shown in Fig. 5(a) (see Visualization 3 in SI). In this process, most parts of the kinetic energy of particles is consumed by the viscous resistance of a surrounding medium, and only a small part of the kinetic energy is used to collide with the existing 2D crystal array of particles. This collision is mild, and the main structure of the crystal will not be affected. In regards to the inserted growth pattern, the energy exchange among these particles is more complicated. The new arriving particles will interact intensely with the crystal and the optical field. Figure 5(b) and Visualization 3 in SI show a complete process of how a new arriving particle enters the center of the crystal and becomes a part of the crystal. The fierce change of the crystal structure happens in the duration of 0.51–3.53 s. Both growth patterns generate a 2D close-packed crystal, which is a simple and regular lattice that achieves higher average density and lower free energy.
Figure 5.Two series of snapshots showing two growth patterns of a PS colloidal crystal in 2D crystallization process. (a) Epitaxial growth pattern. (b) Inserted growth pattern. Red rectangle indicates the ever-changing crystalline region. Red circle emphasizes an additional particle entering the optical field. In the epitaxial growth pattern, the new arriving PS beads would allocate at the two ends of the existing 2D crystal, while in the inserted growth pattern, those beads would insert into and finally allocate somewhere inside the existing 2D crystal. The schematic illustration of each growth pattern in 2D crystallization process is included at the top of each figure.
The position of the new arriving particle entering the focal optical line region will decide the crystallization growth pattern. When an external particle enters by the border of optical field, its kinetic energy will be gradually decreased and then arranged to the edge of the crystal, leading to the epitaxial growth of crystal. On the other hand, when an external particle enters by the bottom of the crystallization area, its kinetic energy will fiercely exchange with the crystal as the particle is squeezed into the crystal, leading to the inserted growth of crystal.
Notice that all the above crystal formed in the LOT are purely induced by the existence of an optical potential well originating from the optical field of LOT. The particles within the crystalline array structure will disassemble when the optical field is turned off. It is also worthy to note that the crystallization process can recur when the optical field is turned on again. Therefore, the LOT offers a stable means for forming colloidal photonic crystal of PS beads.
5. CONCLUSION
In summary, we have investigated the light-driven 1D and 2D crystallization process of monodisperse PS particles in a static LOT. We classify the crystallization process into two growth patterns: the epitaxial growth pattern and inserted growth pattern. In the epitaxial growth pattern, the crystal enlarges its scale by attracting particles one by one at the two edges. Thus, this is a mild growth scheme of crystal. In contrast, in the inserted growth pattern, the external particle is squeezed into the middle region of an existing crystal, which inevitably disturbs the neighboring crystalline structure strongly, e.g., creating significant dislocation into the crystalline structure. In this inserted growth pattern, the structure of a crystal will suffer a huge change in a few seconds and cause transformation from 1D to 2D crystallization. Thus, this inserted growth pattern needs more time to achieve a balance into a new crystalline structure.
The direct observation of the crystallization process of PS particles is the first step in exploring the crystallization characteristics of multiple-type particles in an LOT. The LOT, an intuitive and convenient technique, opens up a new path for fabricating the neatly arranged colloidal crystals under the driving of external forces and interactions. Besides, as this methodology places the whole and subtle details of the colloidal crystallization process under the direct observation and surveillance of a high-resolution optical imaging system, it is an invaluable methodology to understand how PS and other microscopic particles are self-assembled into a colloidal crystal. The light-driven crystallization of particles in an LOT can be fascinating for studying the complicated interaction between multiparticles and external fields, analyzing the diversification of the crystal structure, and exploring many other basic scientific problems. Furthermore, the light-driven self-assembly crystallization of micro-particles can provide various invaluable detailed parameters, such as the formation of dislocation, the momentum of particles in suspension, the energy dissipation between particles and crystals, the relaxation time of crystals achieving balance state, and so on. These parameters would offer excellent guidance toward understanding the dynamic process of colloidal crystal formation and are useful references to fabricate high-quality long-range ordered colloidal crystals in the chemistry, magnetism, electricity, and other crystallization methods.
References
[1] E. Yablonovitch. Inhibited spontaneous emission in solid-state physics and electronics. Phys. Rev. Lett., 58, 2059-2062(1987).
[2] Z.-Y. Li, Z.-Q. Zhang. Fragility of photonic band gaps in inverse-opal photonic crystals. Phys. Rev. B, 62, 1516-1519(2000).
[3] A. H. Safavi-Naeini, J. T. Hill, S. Meenehan, J. Chan, S. Gröblacher, O. Painter. Two-dimensional phononic-photonic band gap optomechanical crystal cavity. Phys. Rev. Lett., 112, 153603(2014).
[4] R. Biswas, M. M. Sigalas, G. Subramania, K.-M. Ho. Photonic band gaps in colloidal systems. Phys. Rev. B, 57, 3701-3705(1998).
[5] Í. Tarhan, G. H. Watson. Photonic band structure of fcc colloidal crystals. Phys. Rev. Lett., 76, 315-318(1996).
[6] S. John. Strong localization of photons in certain disordered dielectric superlattices. Phys. Rev. Lett., 58, 2486-2489(1987).
[7] R. A. Shelby, D. R. Smith, S. Schultz. Experimental verification of a negative index of refraction. Science, 292, 77-79(2001).
[8] O. D. Velev, T. A. Jede, R. F. Lobo, A. M. Lenhoff. Porous silica via colloidal crystallization. Nature, 389, 447-448(1997).
[9] A. A. Zakhidov, R. H. Baughman, Z. lqbal, C. Cui, I. Khayrullin, S. O. Dantas, J. Marti, V. G. Ralchenko. Carbon structures with three-dimensional periodicity at optical wavelengths. Science, 282, 897-901(1998).
[10] B. T. Holland, C. F. Blanford, A. Stein. Synthesis of macroporous minerals with highly ordered three dimensional arrays of spheroidal voids. Science, 281, 538-540(1998).
[11] Y. Xia, B. Gates, Z.-Y. Li. Self-assembly approaches to three-dimensional photonic crystals. Adv. Mater., 13, 409-413(2001).
[12] G. M. Whitesides, B. Grzybowski. Self-assembly at all scales. Science, 295, 2418-2421(2002).
[13] B. A. Parviz, D. Ryan, G. M. Whitesides. Using self-assembly for the fabrication of nano-scale electronic and photonic devices. IEEE Trans. Adv. Packag., 26, 233-241(2003).
[14] H.-J. Butt. Measuring electrostatic, van der Waals, and hydration forces in electrolyte solutions with an atomic force microscope. Biophys. J., 60, 1438-1444(1991).
[15] J. Zhu, M. Li, R. Rogers, W. Meyer, R. H. Ottewill, W. B. Russel, P. M. Chaikin. Crystallization of hard-sphere colloids in microgravity. Nature, 387, 883-885(1997).
[16] M. Holgado, F. García-Santamaría, A. Blanco, M. Ibisate, A. Cintas, H. Míguez, C. J. Serna, C. Molpecerces, J. Requena, A. Mifsud, F. Meseguer, C. López. Electrophretic deposition to control artificial opal growth. Langmuir, 15, 4701-4704(1999).
[17] T. Ding, K. Song, K. Clays, C.-H. Tung. Fabrication of 3D photonic crystals of ellipsoids: convective self-assembly in magnetic field. Adv. Mater., 21, 1936-1940(2009).
[18] H. L. Guo, Z. Y. Li. Optical tweezers technique and its applications. Sci. China Phys. Astro. Mech., 56, 2351-2360(2013).
[19] L. Lin, H. L. Guo, X. L. Zhong, L. Huang, J. F. Li, L. Gan, Z. Y. Li. Manipulation of gold nanorods with dual-optical tweezers for surface plasmon resonance control. Nanotechnology, 23, 215302(2012).
[20] Y. Zong, J. Liu, R. Liu, H. Guo, M. Yang, Z.-Y. Li, K. Chen. An optically driven bi-stable Janus rotor with patterned metal coatings. ACS Nano, 9, 10844-10851(2015).
[21] J. Liu, H.-L. Guo, Z.-Y. Li. Self-propelled round-trip motion of Janus particles in static line optical tweezers. Nanoscale, 8, 19894-19900(2016).
[22] A. Yariv, P. Yeh. Photonics: Optical Electronics in Modern Communications(2007).
[23] A. Ashkin. Forces of a single-beam gradient laser trap on a dielectric sphere in the ray optics regime. Biophys. J., 61, 569-582(1992).
[24] J. Liu, C. Zhang, Y. W. Zong, H. L. Guo, Z. Y. Li. Ray-optics method for optical force and torque on a spherical metal-coated Janus microparticle. Photon. Res., 3, 265-274(2015).


