• Laser & Optoelectronics Progress
  • Vol. 61, Issue 1, 0114001 (2024)
Lü Xinjie1、2、4、*, Bin Yang5, Hongquan Yao1、3, Xiaohan Wang3, Hui Wu3, Lingbing Bu5, and Shining Zhu1、2、3、4、**
Author Affiliations
  • 1National Laboratory of Solid State Microstructures, Nanjing University, Nanjing 210093, Jiangsu , China
  • 2College of Engineering and Applied Sciences, Nanjing University, Nanjing 210023, Jiangsu , China
  • 3School of Physics, Nanjing University, Nanjing 210093, Jiangsu , China
  • 4Collaborative Innovation Center of Advanced Microstructures, Nanjing University, Nanjing 210093, Jiangsu , China
  • 5School of Atmospheric Physics, Nanjing University of Information Science & Technology, Nanjing 210044, Jiangsu , China
  • show less
    DOI: 10.3788/LOP232609 Cite this Article Set citation alerts
    Lü Xinjie, Bin Yang, Hongquan Yao, Xiaohan Wang, Hui Wu, Lingbing Bu, Shining Zhu. Dual-Wavelength Mid-Infrared Laser for Long-Range Gas Detection (Invited)[J]. Laser & Optoelectronics Progress, 2024, 61(1): 0114001 Copy Citation Text show less
    Absorption lines of NO, NO2, and SO2 in the 2.6‒4.0 μm range
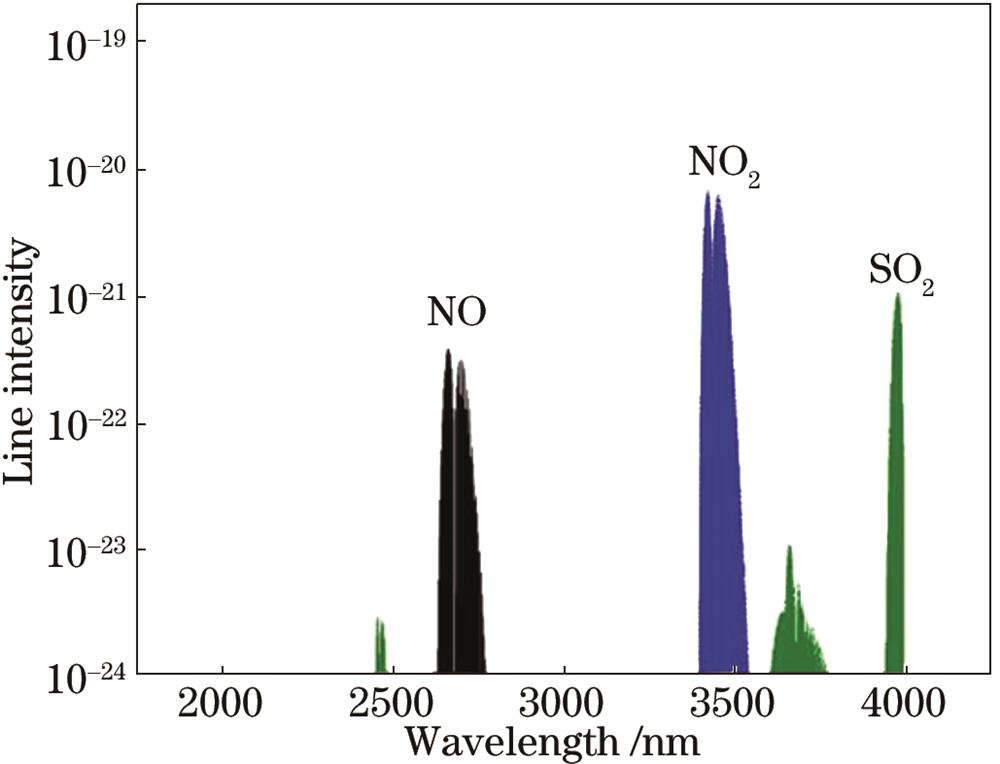
    Fig. 1. Absorption lines of NO, NO2, and SO2 in the 2.6‒4.0 μm range
    Wavelength tunning of PPLN-OPO
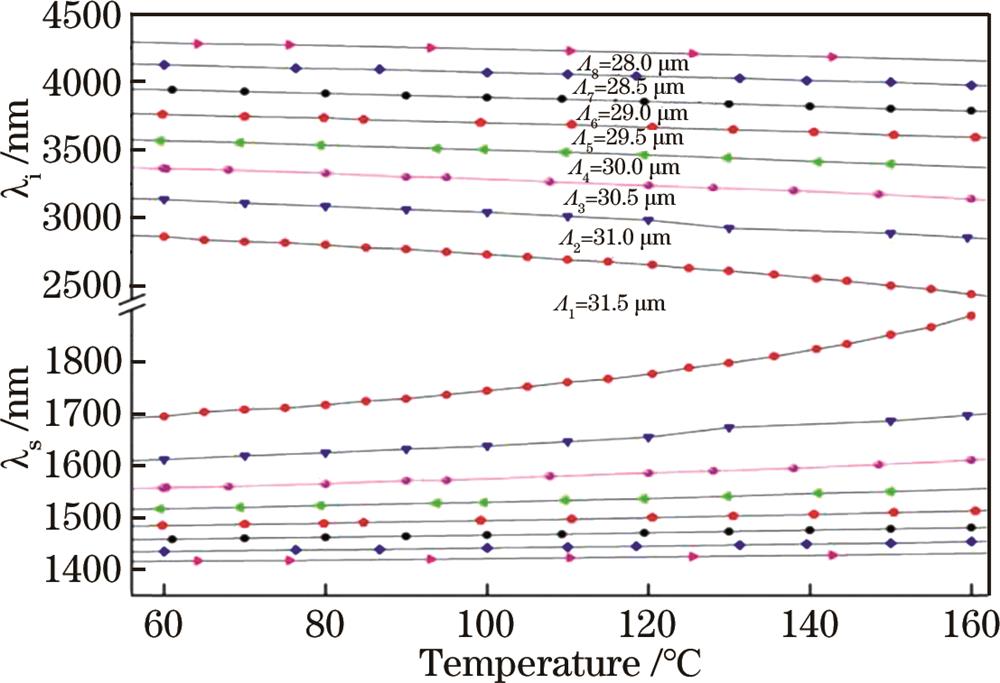
    Fig. 2. Wavelength tunning of PPLN-OPO
    System schematic diagram
    Fig. 3. System schematic diagram
    Engineering of pump lasers
    Fig. 4. Engineering of pump lasers
    Single-pulse waveform of pump laser
    Fig. 5. Single-pulse waveform of pump laser
    Optical path and engineering design of dual-wavelength OPO
    Fig. 6. Optical path and engineering design of dual-wavelength OPO
    OPO structure design. (a) ON-OPO design drawing; (b) ON-OPO physical drawing; (c) OFF-OPO design drawing; (d) OFF-OPO physical drawing
    Fig. 7. OPO structure design. (a) ON-OPO design drawing; (b) ON-OPO physical drawing; (c) OFF-OPO design drawing; (d) OFF-OPO physical drawing
    Signal optical spectra of OPO. (a) Signal optical spectrum diagram of free-running OPO; (b) signal optical spectrum of OPO after seed injection
    Fig. 8. Signal optical spectra of OPO. (a) Signal optical spectrum diagram of free-running OPO; (b) signal optical spectrum of OPO after seed injection
    Energy curves of ON-OPO
    Fig. 9. Energy curves of ON-OPO
    Comparison between actual mass concentration and detected mass concentration[17]
    Fig. 10. Comparison between actual mass concentration and detected mass concentration[17]
    Measurement results of dynamic emissions[17]
    Fig. 11. Measurement results of dynamic emissions17
    ON /nmOFF /nmPeriod /μm
    NO2654.76260031.5
    NO23424.40339030.5
    SO23996.51392529.0
    Table 1. ON-OFF wavelength and corresponding PPLN period
    ReflectanceSpectral qualityExperimental effect of gas absorption cell
    50%Spectrum is broad, and there are multiple peaks, and intensity of each peak is not different, and effect is poorTransmittance is large, and absorption is poor
    85%Spectral width is narrow, and there are multiple peaks, and intensity of each peak varies greatly, and a main peak with large intensity appearsTransmittance becomes smaller, and there is still a gap with theoretical simulation
    75%Spectral width is narrow, with only one main peak with greater intensityIt is basically consistent with theoretical simulation data
    Table 2. Spectra and absorption effects of different OPO mirrors' reflectance
    Lü Xinjie, Bin Yang, Hongquan Yao, Xiaohan Wang, Hui Wu, Lingbing Bu, Shining Zhu. Dual-Wavelength Mid-Infrared Laser for Long-Range Gas Detection (Invited)[J]. Laser & Optoelectronics Progress, 2024, 61(1): 0114001
    Download Citation