
Rui Bai, Youchun Xu, Yongle Li, Jiong Li, Feng Xie. Digital Character Recognition Technique for Intelligent Vehicles in Road Scenes[J]. Laser & Optoelectronics Progress, 2019, 56(19): 191506
- Laser & Optoelectronics Progress
- Vol. 56, Issue 19, 191506 (2019)
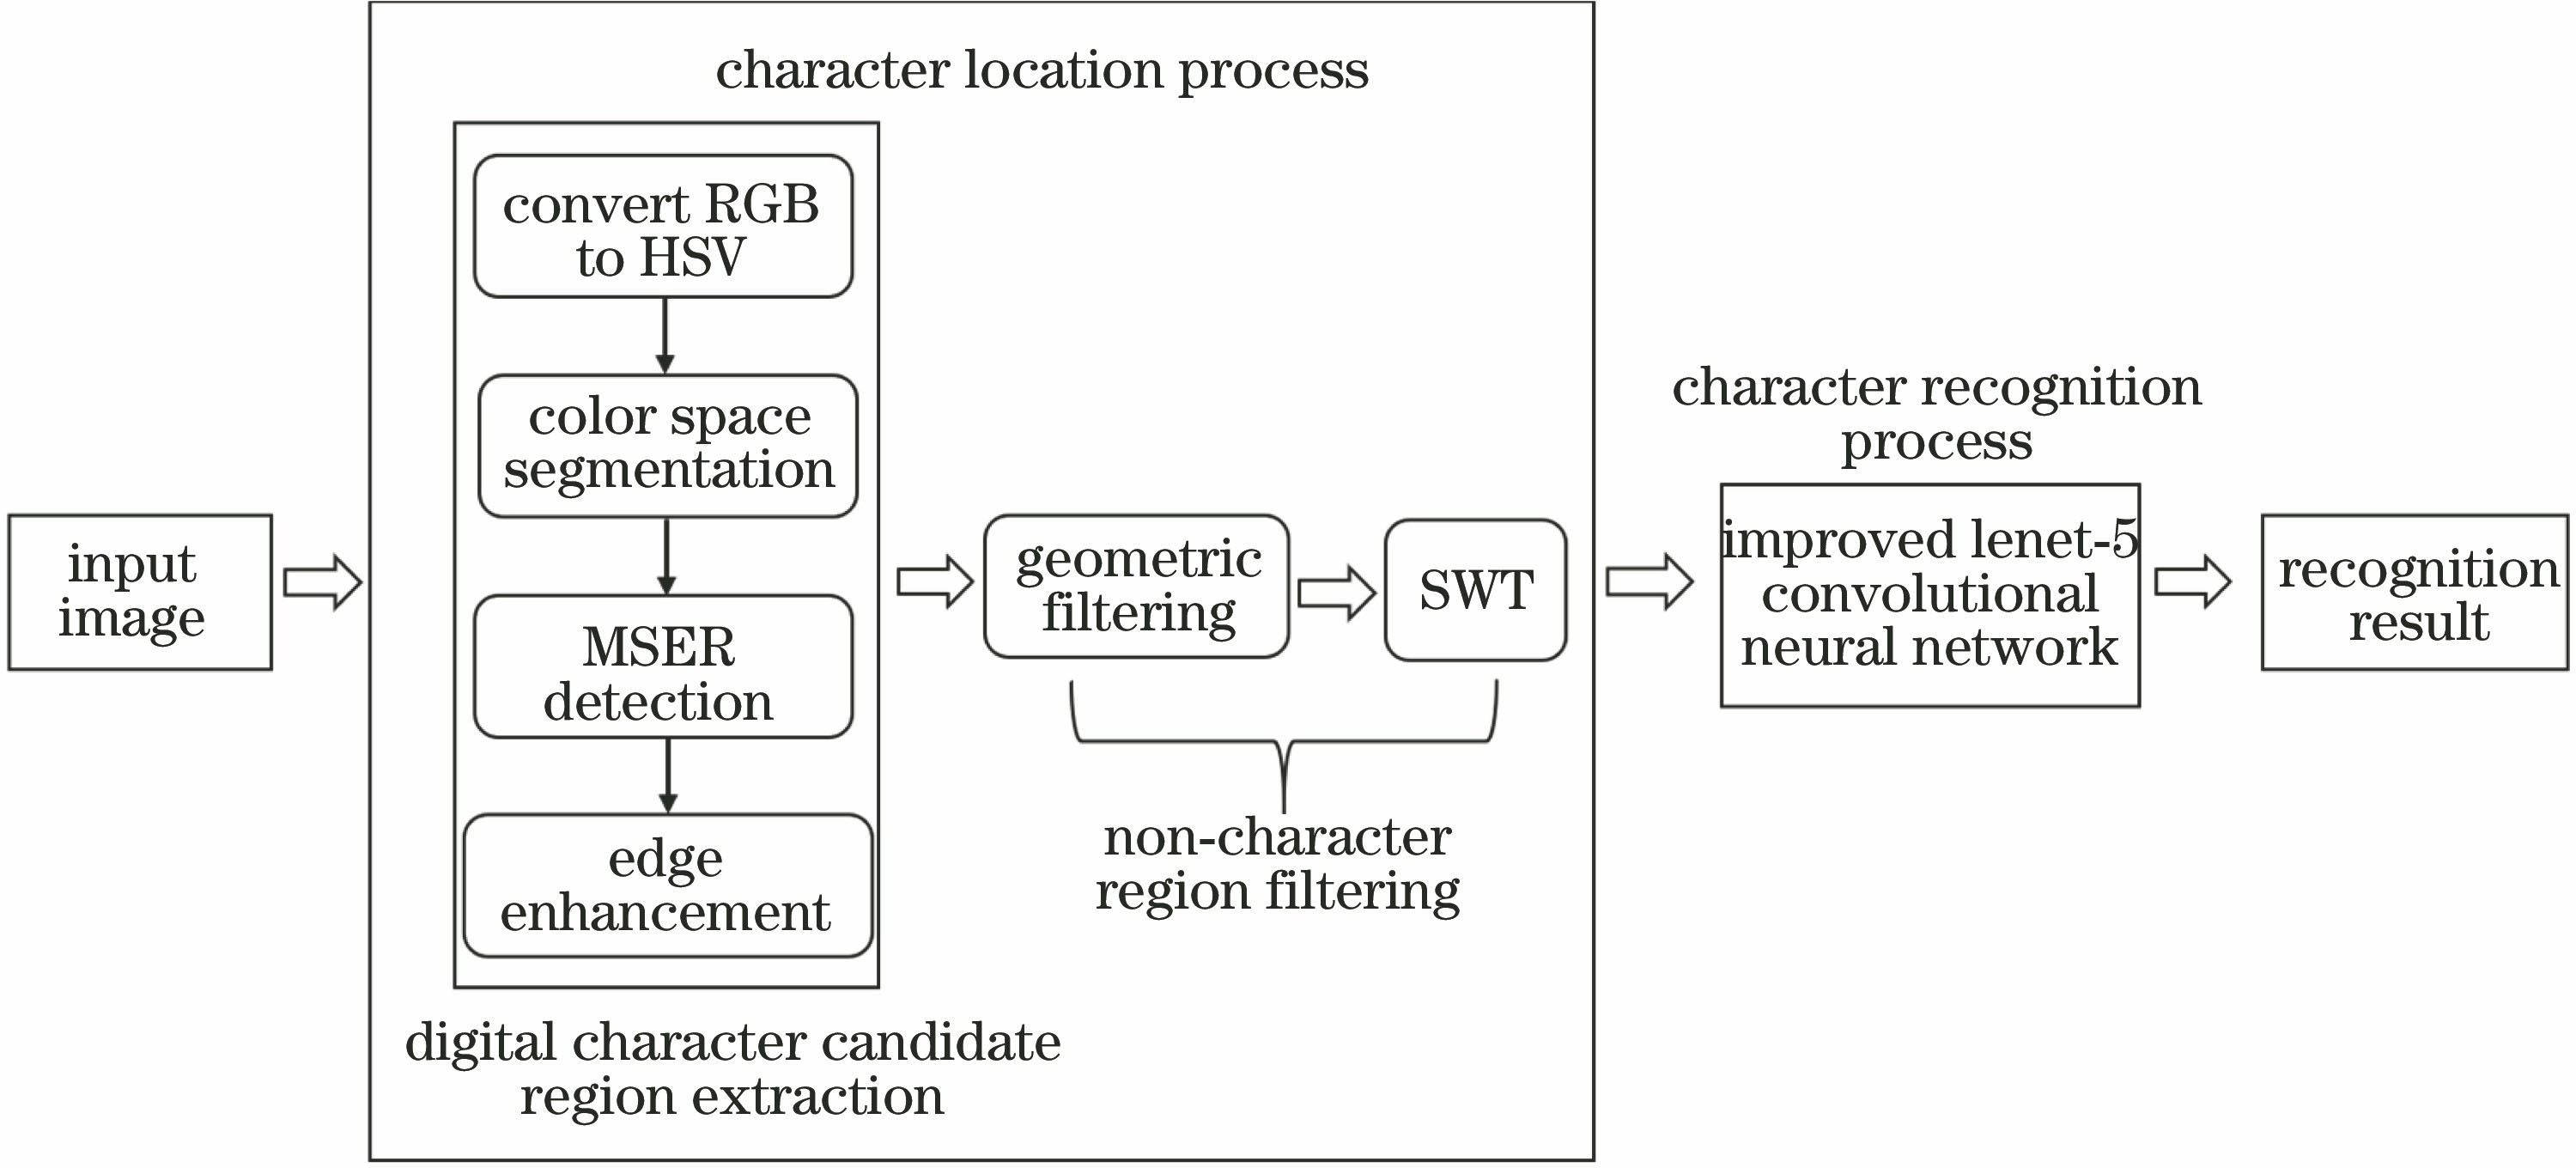
Fig. 1. Flowchart of proposed algorithm
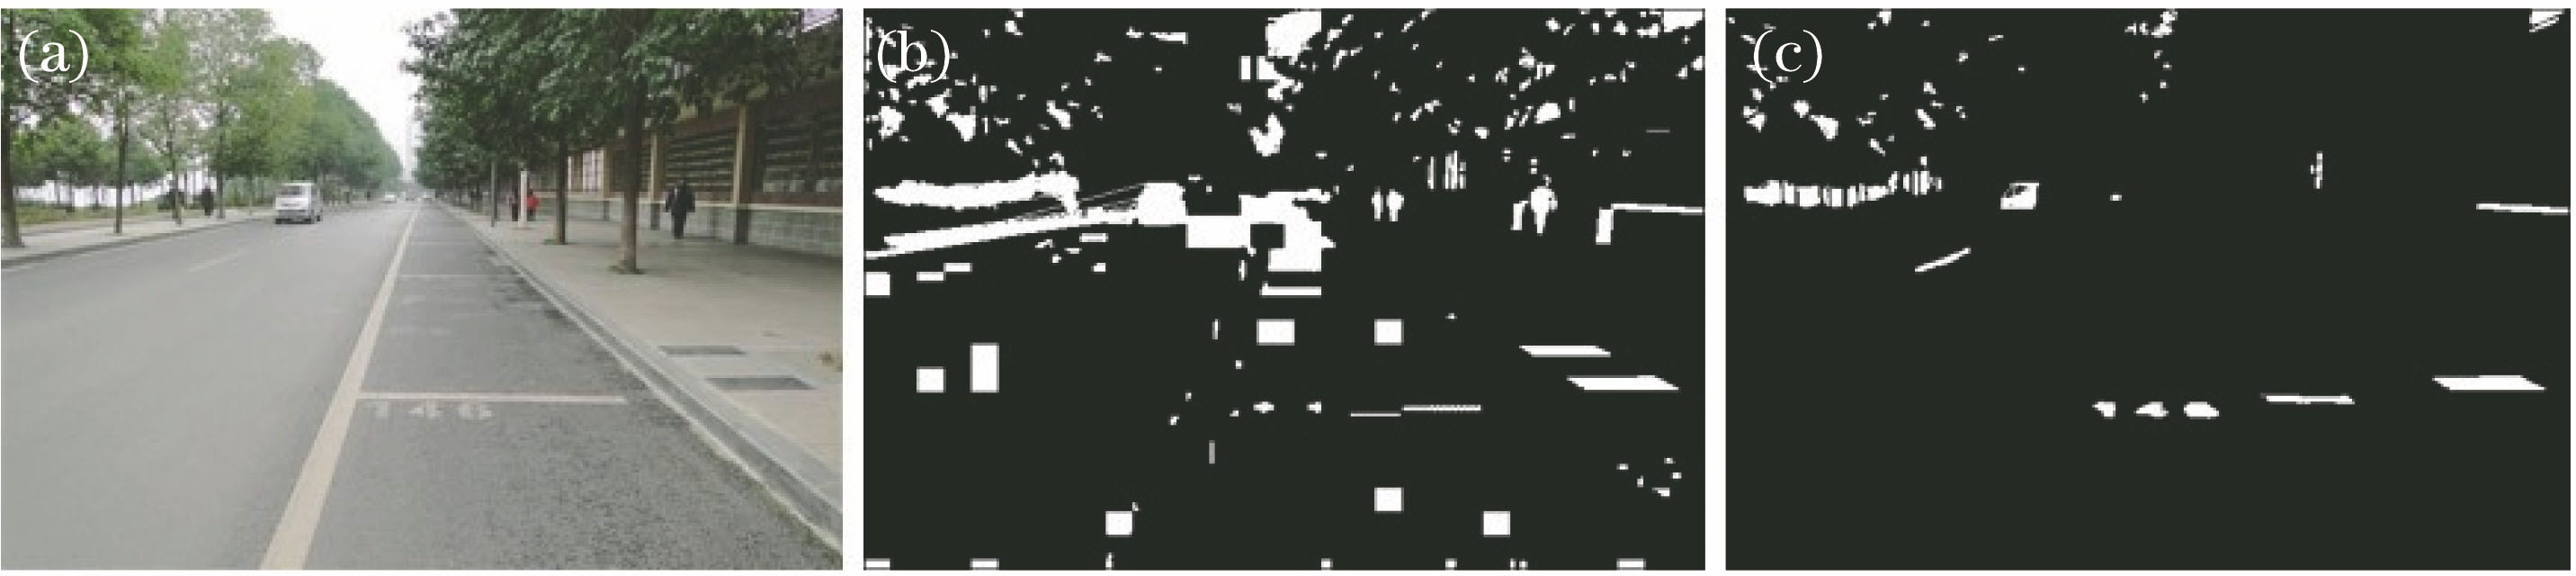
Fig. 2. Comparison between proposed extraction method and traditional MSER extraction method. (a) Original diagram of a parking space number; (b) traditional MSER extraction effect; (c) MSER extraction effect for S channel
Fig. 3. Character edge enhancement process. (a) Character candidate regions; (b) edge extraction graph of character candidate regions; (c) edge enhancement graph of characters
Fig. 4. Edge extraction and stroke width maps of character “6”. (a) Edge extraction of character “6”; (b) stroke width of character “6”
Fig. 5. Diagram of the Lenet-5 network
Fig. 6. Diagrams of characters in the dataset. (a) Diagram before dataset segmentation; (b) diagram after rough dataset segmentation
Fig. 7. Train loss and test accuracy vary with number of iterations
Fig. 8. Experimental platform
Fig. 9. Diagrams of character positioning results. (a) Character connected regions; (b) character location results in road scenes; (c) character connected regions; (d) character location results in road scenes
Fig. 10. Character recognition results. (a) Recognition result of character ‘1’; (b) recognition result of character ‘4’; (c) recognition result of character ‘6’
|
Table 1. Geometric constraint filter parameters
|
Table 2. Experimental results of recognition rate drop-out values under different input scales
|
Table 3. Number of characters in the dataset
|
Table 4. Character location performance comparison of different algorithms
|
Table 5. Comparison of character recognition effects of different algorithms

Set citation alerts for the article
Please enter your email address
© Copyright 2018-2021 | Chinese Laser Press. All Rights Reserved 沪ICP备15018463号-20