
Xue Wen, Honghui Wang, Dehua Fan, Zhenglong Lei, Siyuan Bi, Hengtong Guo. Prediction of Weld Forming Size for Laser Welded Titanium Alloy T-joint Based on Regression Analysis[J]. Laser & Optoelectronics Progress, 2022, 59(19): 1914007
- Laser & Optoelectronics Progress
- Vol. 59, Issue 19, 1914007 (2022)
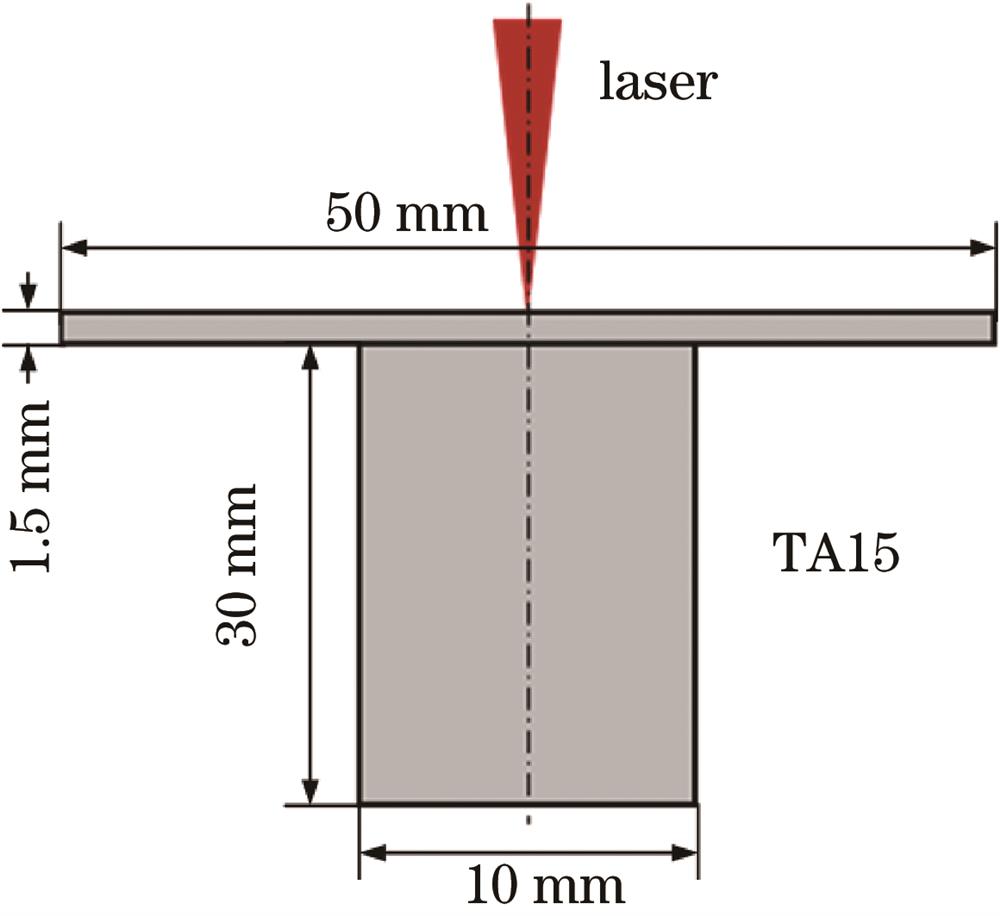
Fig. 1. Schematic diagram of T-joint with titanium alloy skin grid structure
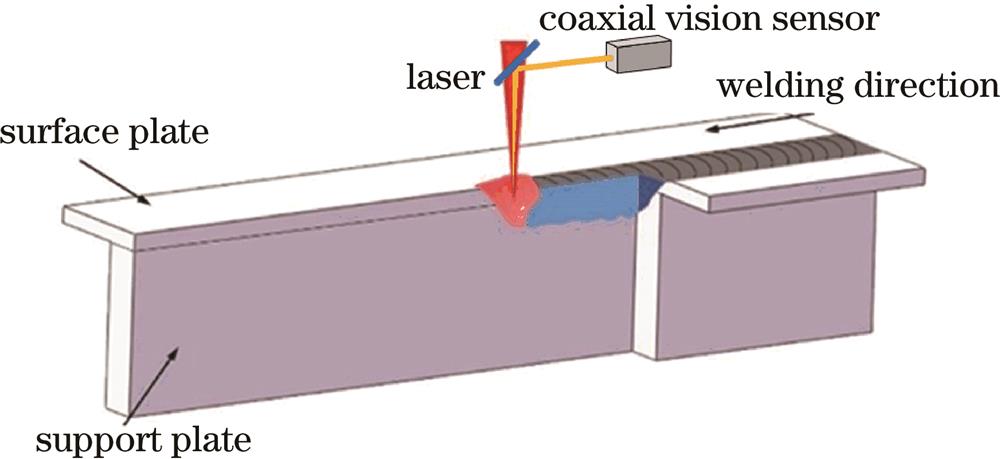
Fig. 2. Schematic diagram of T-joint laser welding process
Fig. 3. Main weld morphology characteristics of T-joint and characteristic quantity of welds under different test conditions. (a) Main morphology characteristics of welds; (b) P=2000 W, V=1.0 m/min; (c) P=2200 W, V=1.0 m/min; (d) P=2200 W, V=0.8 m/min
Fig. 4. Schematic diagram of measurement of geometric characteristic quantity of molten pool and keyhole
Fig. 5. Molten pool morphologies under different welding process parameters. (a) P=1000 W, V=1.0 m/min; (b) P=2000 W, V=1.0 m/min; (c) P=2000 W, V=2.0 m/min; (d) P=3000 W, V=2.0 m/min
Fig. 6. Outline of molten pool and keyhole
Fig. 7. Significance level of characteristic quantity of molten pool to the weld. (a) Significance level of weld penetration; (b) significance level of weld joint width
Fig. 8. Correlation between characteristic quantity of molten pool and welds. (a) Correlation of weld penetration; (b) correlation of weld joint width
Fig. 9. Regression model of weld joint width. (a) Regression model; (b) regression model residuals
Fig. 10. Regression model of weld penetration. (a) Regression model; (b) regression model residuals
Fig. 11. Size errors of weld topography predicted by regression model
|
Table 1. Chemical composition of base metal of TA15 titanium alloy
|
Table 2. Technological parameters of laser welding test for titanium alloy T-joint
| |||||||||||||||||||||||||||||||||||||||||||||||||||||||||||||||||||||||||||||||||||||||||||||||||||||||||||||
Table 3. Part of the molten pool morphology characteristic data
|
Table 4. Regression model coefficients of weld joint width
|
Table 5. Regression model coefficients of weld penetration
|
Table 6. Analysis of regression model of T-joint weld joint width
|
Table 7. Analysis of regression model of T-joint weld penetration

Set citation alerts for the article
Please enter your email address
© Copyright 2018-2021 | Chinese Laser Press. All Rights Reserved 沪ICP备15018463号-20