• Opto-Electronic Advances
  • Vol. 5, Issue 4, 210055 (2022)
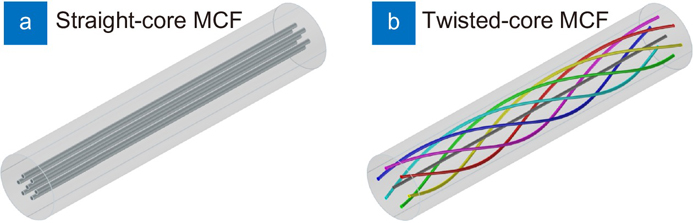
Alexey Wolf1、2、*, Alexander Dostovalov1、2, Kirill Bronnikov1、2, Mikhail Skvortsov1、2, Stefan Wabnitz1、3, and Sergey Babin1、2、*
Author Affiliations
  • 1Novosibirsk State University, Novosibirsk 630090, Russia
  • 2Institute of Automation and Electrometry of the SB RAS, Novosibirsk 630090, Russia
  • 3Department of Information, Electronics and Telecommunications Engineering, Sapienza University of Rome, Rome 00184, Italy
  • show less
    DOI: 10.29026/oea.2022.210055 Cite this Article
    Alexey Wolf, Alexander Dostovalov, Kirill Bronnikov, Mikhail Skvortsov, Stefan Wabnitz, Sergey Babin. Advances in femtosecond laser direct writing of fiber Bragg gratings in multicore fibers: technology, sensor and laser applications[J]. Opto-Electronic Advances, 2022, 5(4): 210055 Copy Citation Text show less
    7-core MCFs with straight (a) and twisted (b) side cores.
    Fig. 1. 7-core MCFs with straight (a) and twisted (b) side cores.
    Microphotographs of different type MCFs manufactured by E.M. Dianov Fiber Optics Research Center. The scale bar corresponds to 20 µm.
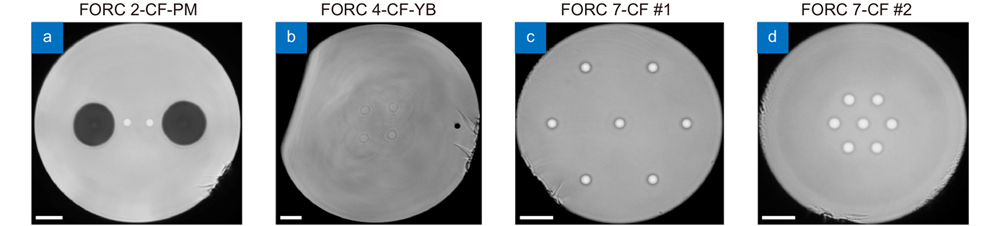
    Fig. 2. Microphotographs of different type MCFs manufactured by E.M. Dianov Fiber Optics Research Center. The scale bar corresponds to 20 µm.
    Schematic view of an FBG structure induced in the fiber core with different direct fs writing methods. (a) Point-by-point method (Gaussian beam). (b) Line-by-line method (Gaussian beam with transverse scanning). (c) Plane-by-plane method (astigmatic Gaussian beam).
    Fig. 3. Schematic view of an FBG structure induced in the fiber core with different direct fs writing methods. (a) Point-by-point method (Gaussian beam). (b) Line-by-line method (Gaussian beam with transverse scanning). (c) Plane-by-plane method (astigmatic Gaussian beam).
    Refractive index change induced by fs laser pulses in the cross section of a single-mode fiber in the case of a Gaussian beam (a) and an astigmatic Gaussian beam (b) for different pulse energies.
    Fig. 4. Refractive index change induced by fs laser pulses in the cross section of a single-mode fiber in the case of a Gaussian beam (a) and an astigmatic Gaussian beam (b) for different pulse energies.
    Focusing the fs laser beam into a selected core of the MCF during FBG writing. (a) 3D view. (b) 2D view in XY plane.
    Fig. 5. Focusing the fs laser beam into a selected core of the MCF during FBG writing. (a) 3D view. (b) 2D view in XY plane.
    Microphotographs of point-by-point FBGs written individually in the MCF cores. (a) Single FBG in one of the side cores of FORC 7-CF #1. (b) 6 FBGs in the side cores of FORC 7-CF #2.
    Fig. 6. Microphotographs of point-by-point FBGs written individually in the MCF cores. (a) Single FBG in one of the side cores of FORC 7-CF #1. (b) 6 FBGs in the side cores of FORC 7-CF #2.
    (а) MCF cross-section sketch, and relevant parameters for curvature calculation. (b) Schematic representation of the 3D FBG array written in a 7-core MCF through polyimide protective coating.
    Fig. 7. (а) MCF cross-section sketch, and relevant parameters for curvature calculation. (b) Schematic representation of the 3D FBG array written in a 7-core MCF through polyimide protective coating.
    Result of test shapes reconstruction. (a) 3D shapes − spiral curves with different diameter and pitch (solid − reconstructed curves, dashed − reference curves)25. (b) 2D shape − S-curve, reference curve (solid line) together with reconstructed curves for algorithms based on the Frenet-Serret equations and homogeneous transformation matrices for m = 100 (dashed lines)86. Figure reproduced with permission from: (a) ref.25, (b) ref.86, under a Creative Commons Attribution 4.0 International License
    Fig. 8. Result of test shapes reconstruction. (a) 3D shapes − spiral curves with different diameter and pitch (solid − reconstructed curves, dashed − reference curves)25. (b) 2D shape − S-curve, reference curve (solid line) together with reconstructed curves for algorithms based on the Frenet-Serret equations and homogeneous transformation matrices for m = 100 (dashed lines)86. Figure reproduced with permission from: (a) ref.25, (b) ref.86, under a Creative Commons Attribution 4.0 International License
    (a) Controlling the bending of the papillotome , and (b) result of the papillotome shape reconstruction with an integrated FBG array written in a 7-core fiber .
    Fig. 9. (a) Controlling the bending of the papillotome , and (b) result of the papillotome shape reconstruction with an integrated FBG array written in a 7-core fiber .
    Schematic of an experimental setup for detecting AE in a PCM plate using FBG-FPIs (A, B, and C) written in different cores of the MCF.
    Fig. 10. Schematic of an experimental setup for detecting AE in a PCM plate using FBG-FPIs (A, B, and C) written in different cores of the MCF.
    (а) Signals from FBG-FPI sensors (A, B and C) and one PD (P-C), as well as their variants processed with a low-pass filter, when hitting point T2. (b) The derivatives of the signals processed by a low-pass filter when hitting point T2 for measuring the speed of sound. The yellow area shows the corridor, the crossing of the boundaries of which indicates the arrival of the wavefront in the sensor area; intersection points are shown with vertical dashed lines.
    Fig. 11. (а) Signals from FBG-FPI sensors (A, B and C) and one PD (P-C), as well as their variants processed with a low-pass filter, when hitting point T2. (b) The derivatives of the signals processed by a low-pass filter when hitting point T2 for measuring the speed of sound. The yellow area shows the corridor, the crossing of the boundaries of which indicates the arrival of the wavefront in the sensor area; intersection points are shown with vertical dashed lines.
    (a) 7-core fiber Raman laser scheme. (b) Reflection spectra measured for FBGs written in the side cores of the MCF. The inset shows the cleaved end of the MCF fiber used in the experiments.
    Fig. 12. (a) 7-core fiber Raman laser scheme. (b) Reflection spectra measured for FBGs written in the side cores of the MCF. The inset shows the cleaved end of the MCF fiber used in the experiments.
    7-core Raman fiber laser power characteristics: output power of the backward Stokes (■), forward Stokes (●) and transmitted pump power (♦) as a function of input pump power. Red line is the result of numerical simulations for Stokes generation, blue line − numerical simulations for transmitted pump power.
    Fig. 13. 7-core Raman fiber laser power characteristics: output power of the backward Stokes (■), forward Stokes (●) and transmitted pump power (♦) as a function of input pump power. Red line is the result of numerical simulations for Stokes generation, blue line − numerical simulations for transmitted pump power.
    (а) Backward Stokes wave spectra of the central core. (b) Forward Stokes wave spectra of the central and two side cores at the maximum input pump power.
    Fig. 14. (а) Backward Stokes wave spectra of the central core. (b) Forward Stokes wave spectra of the central and two side cores at the maximum input pump power.
    The output beams from different cores measured by the beam profiler at a maximum pump power. (a) Unabsorbed pump. (b) Forward Stokes wave.
    Fig. 15. The output beams from different cores measured by the beam profiler at a maximum pump power. (a) Unabsorbed pump. (b) Forward Stokes wave.
    Alexey Wolf, Alexander Dostovalov, Kirill Bronnikov, Mikhail Skvortsov, Stefan Wabnitz, Sergey Babin. Advances in femtosecond laser direct writing of fiber Bragg gratings in multicore fibers: technology, sensor and laser applications[J]. Opto-Electronic Advances, 2022, 5(4): 210055
    Download Citation