Wenqiao Shi, Jianqiang Gu, Xingyuan Zhang, Quan Xu, Jiaguang Han, Quanlong Yang, Longqing Cong, Weili Zhang, "Terahertz bound states in the continuum with incident angle robustness induced by a dual period metagrating," Photonics Res. 10, 810 (2022)

Search by keywords or author
- Photonics Research
- Vol. 10, Issue 3, 810 (2022)

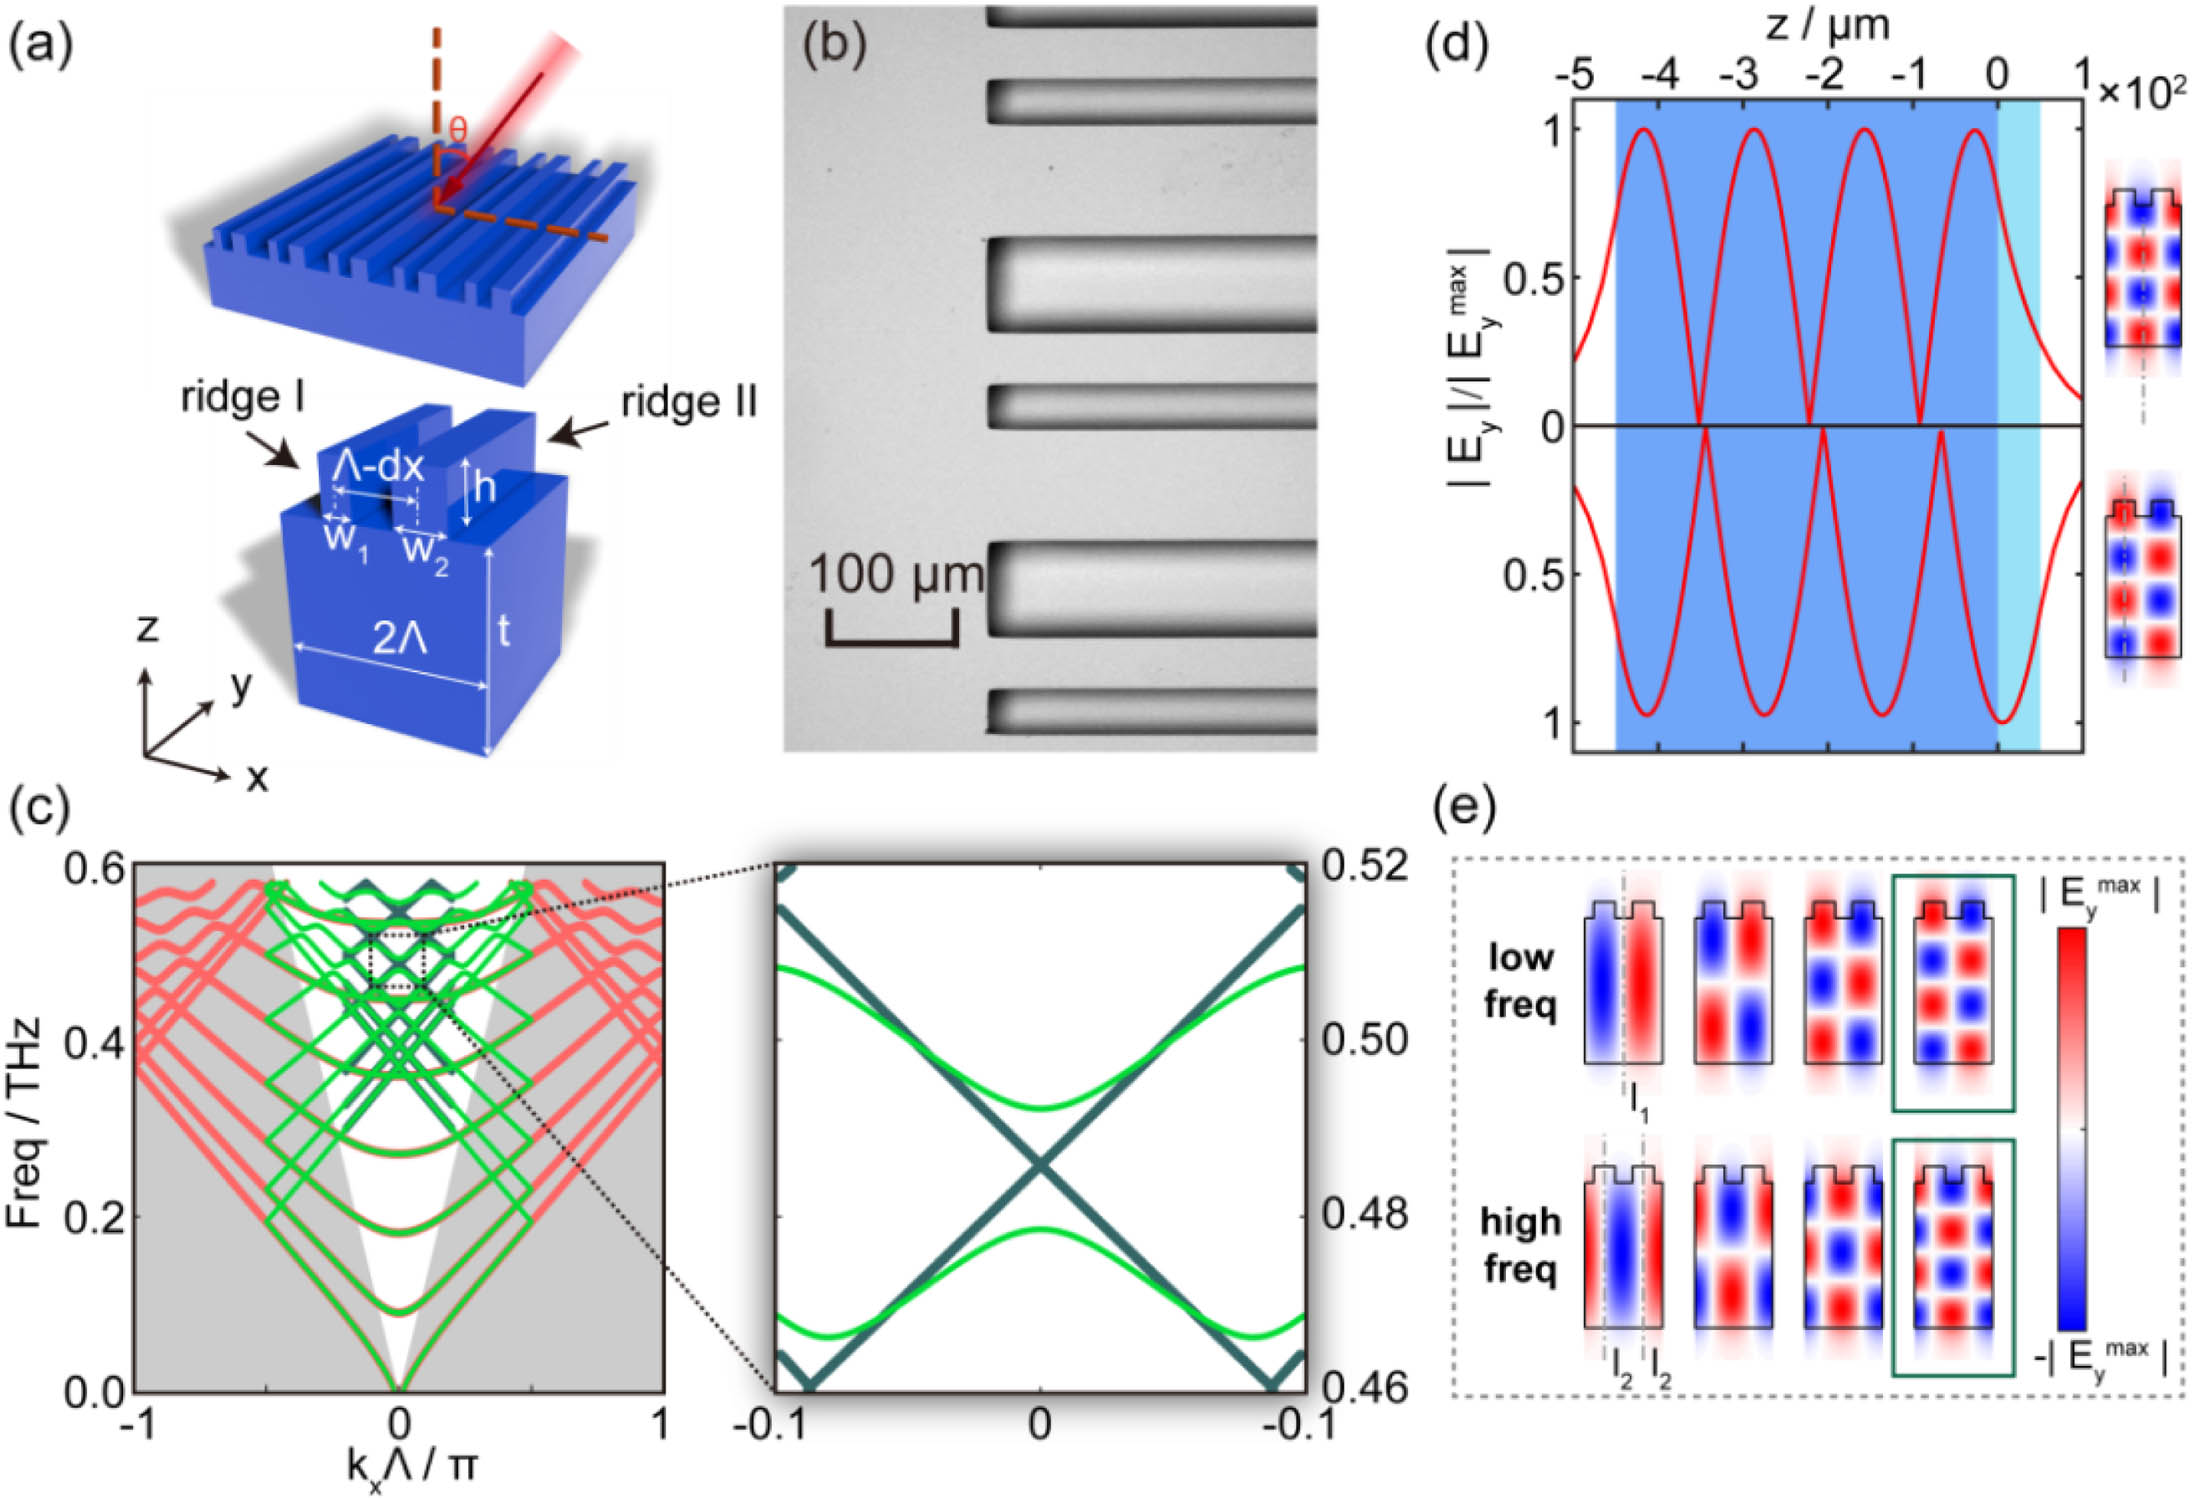
Fig. 1. Schematic of dual-period dielectric gratings and eigenmode analysis. (a) Schematic illustration of dual-period grating and structural parameters of the grating; (b) microscopy image of the sample; (c) band structure of confined eigenmodes simulated with dual- (green) and mono- (red) period boundary and calculated by the GMR theory (dark blue); (d) electric field distribution of the fourth group of modes at 0.479 and 0.492 THz along the gray axis in the right panel, respectively; the light and dark blue regions indicate the grating layer and substrate, respectively; (e) electric field profile of E y
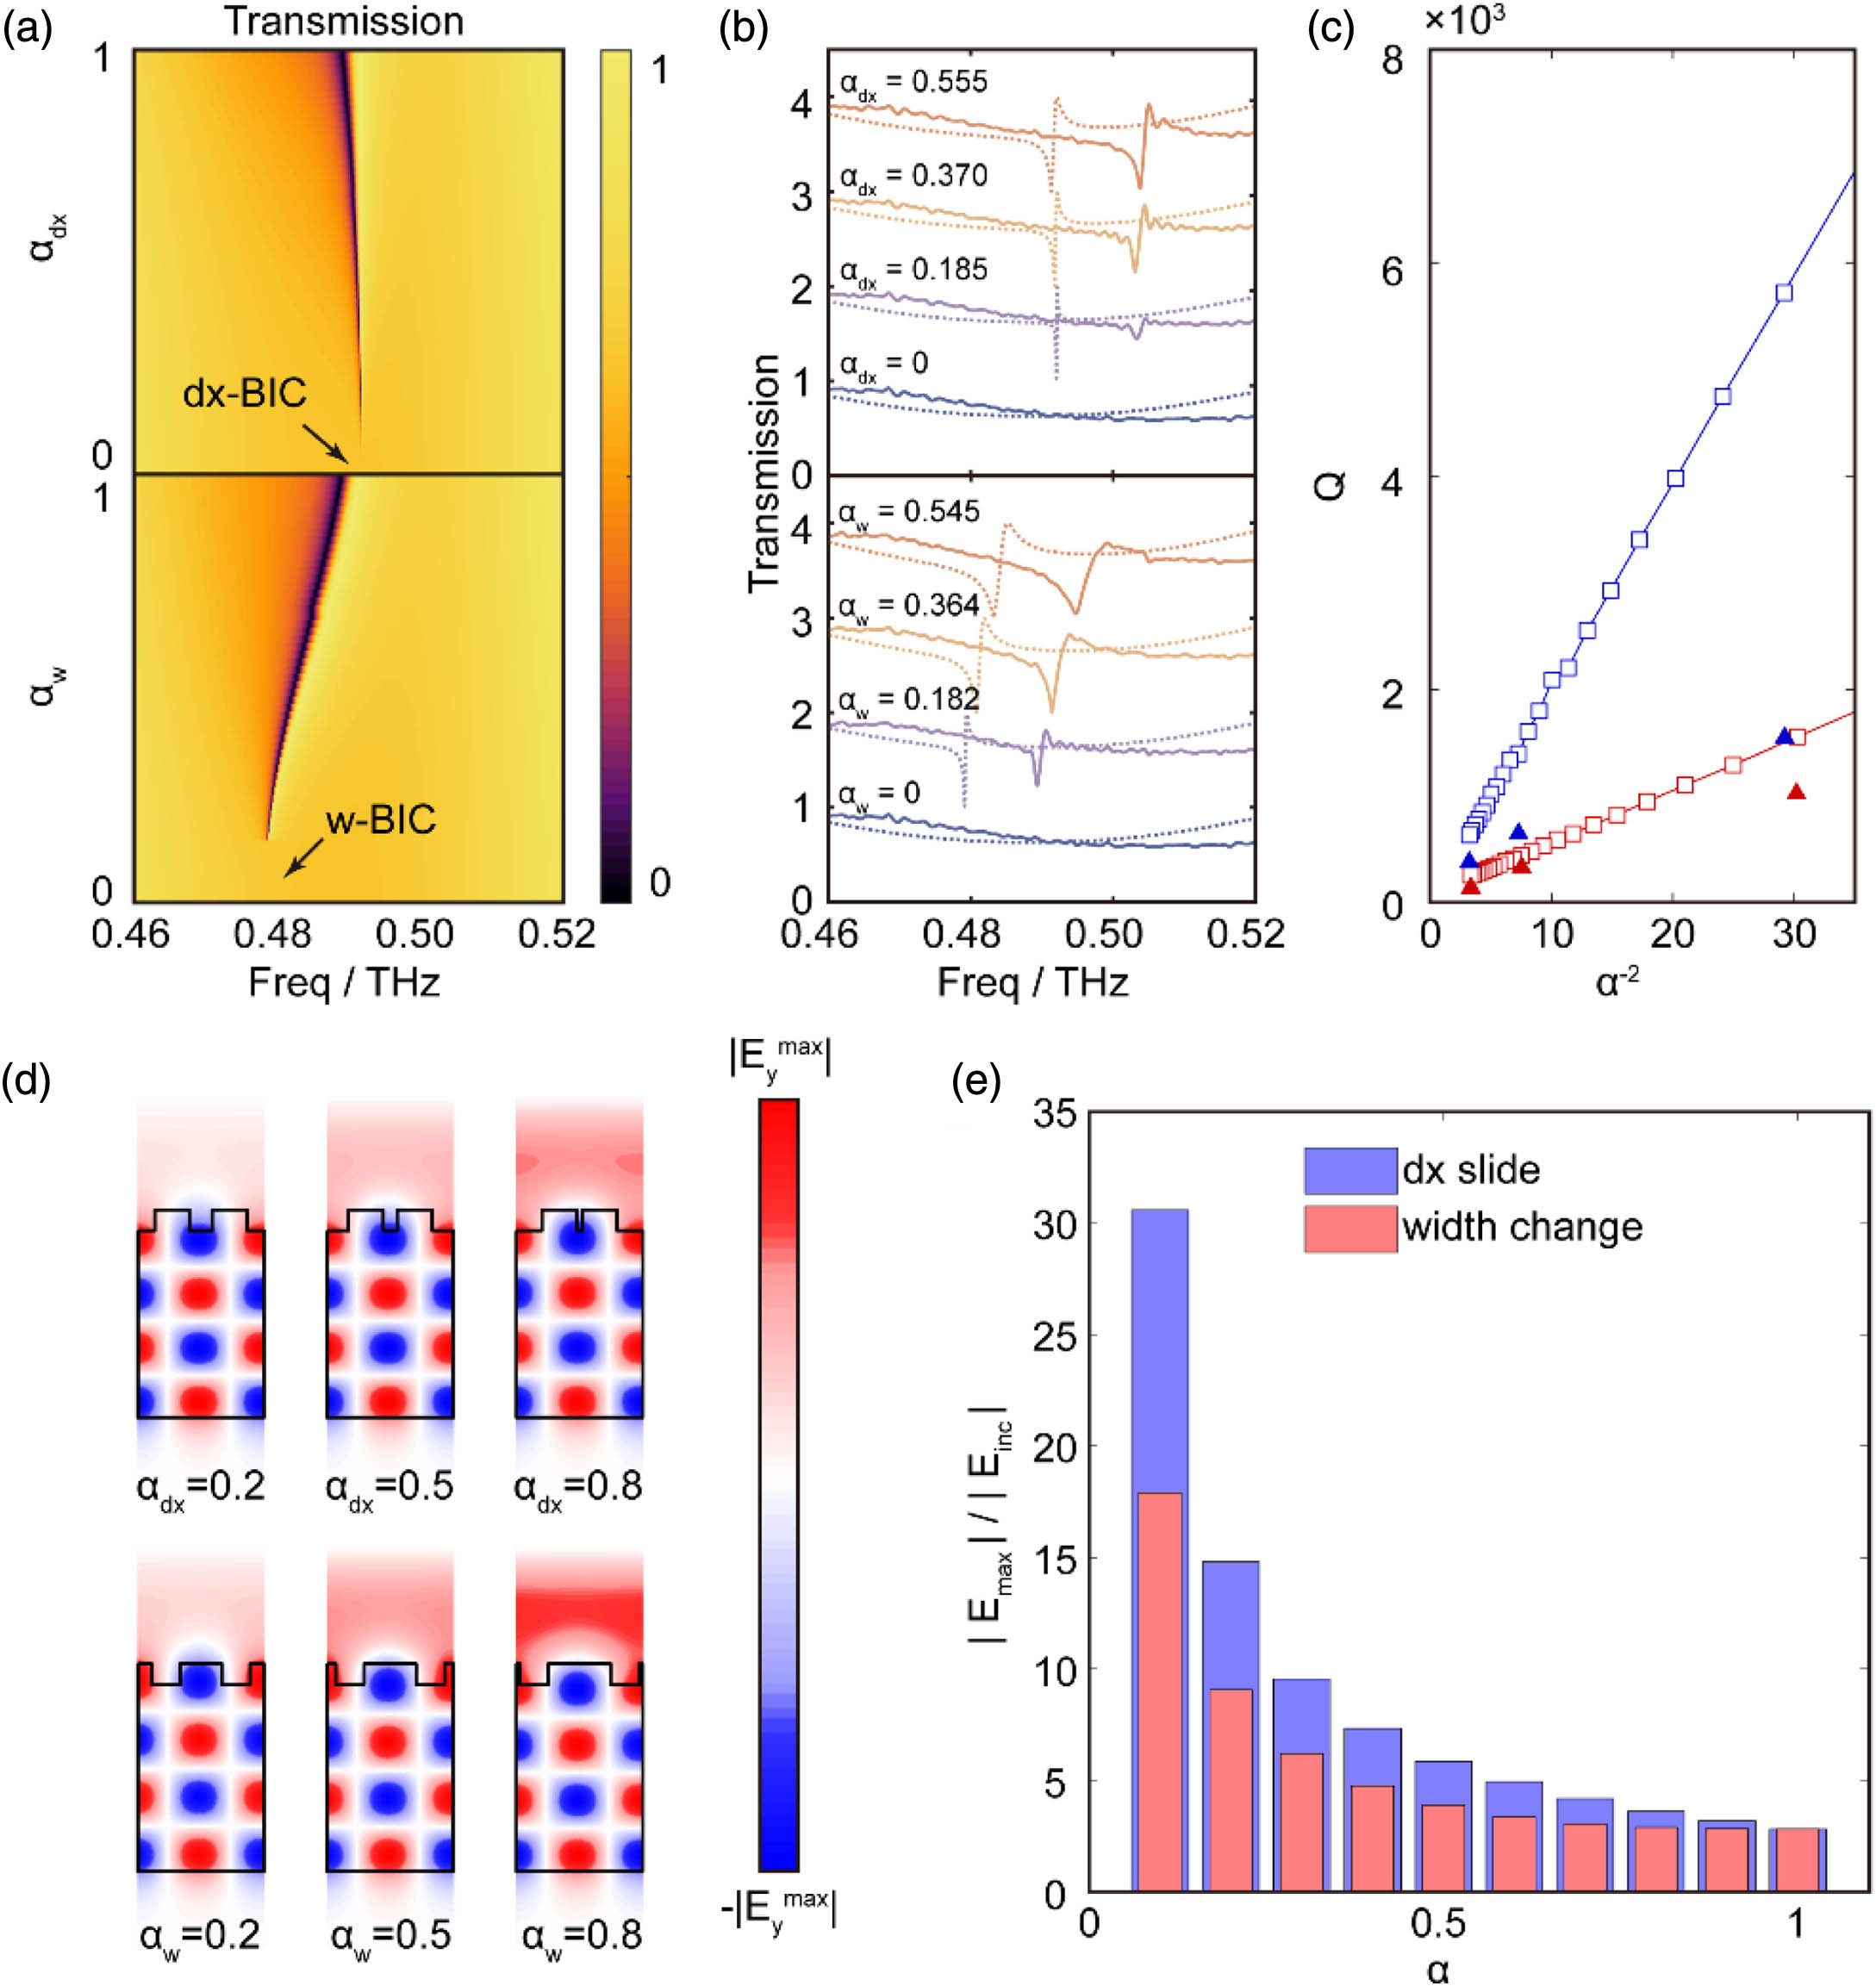
 component based on GMR; upper panel, the frequencies from left to right are 0.370, 0.394, 0.431, and 0.479 THz, respectively; lower panel, 0.371, 0.397, 0.439, and 0.492 THz, respectively.

Fig. 2. d x -caused and w -caused BICs in the dual-period grating. (a) and (b) Transmission spectrum with perturbed structural symmetry under normal incidence; (a) and the dashed lines in (b) are the simulated results. The solid lines in (b) are the measured results. (c) Relation between Q factors of the d x -caused quasi-BIC (blue) and w -caused quasi-BIC (red) and α − 2 . The simulated and measured results are indicated by hollow and solid markers, respectively. (d) Electric field profile in the plane y = 0 for different asymmetry at the dip of transmission spectrum; (e) maximum | E y | of the mode in the plane y = 0 under unified incidence with changing asymmetry.

Fig. 3. Investigation of w -caused BIC and quasi-BIC under tilted incidence with d x slide. (a) w -caused BIC band in the first Brillouin zone with α d x = 0 ; (b) Q factors of w -caused BIC band (black circle) in symmetric structure and quasi-BIC band (circles of red, orange, yellow, green, cyan, and blue) with varying α d x (0.005, 0.01, 0.02, 0.04, 0.08, and 0.16); the gray area reveals the discrete region for the band in (a). (c) The measured spectrum with α d x = 0 , 0.370, and 0.555 under normal and tilted incidence. The cyan regions denote the evolution of quasi-BIC correlated to incident angle.

Fig. 4. Manipulation of two quasi-BICs and EIT-like effect. (a) Transmission evolution with varying α w when α d x = 0.37 . The dark blue circle points out the EIT-like line shape. (b) Simulated transmission evolution with varying α d x when α w = 0.82 . (c) Profile of electric field E y of eigenmodes when α d x = 0 and α w = 0.82 ; both are at 0.487 THz. (d) Comparison between simulated, fitted, and measured transmission with varying α d x ; simulation results are also marked with dashed lines in (b).

Fig. 5. Simulated and measured slow-light effect. (a) Simulated and (d) measured transmission with α d x = 0.37 and α w = 0.82 ; (b) simulated and (e) measured phase shift of transmission; (c) simulated and (f) measured group delay.

Set citation alerts for the article
Please enter your email address