• Infrared and Laser Engineering
  • Vol. 50, Issue 5, 20200326 (2021)
Bin Liu1、2, Qian Qiao1、2, Jing Zhao1、2, Zimiao Zhang3、*, Zhiwei Li1、2, and Baofeng Zhang1、2
Author Affiliations
  • 1Tianjin Key Laboratory of Control Theory & Applications in Complicated System, Tianjin University of Technology, Tianjin 300384, China
  • 2School of Electrical and Electronic Engineering, Tianjin University of Technology, Tianjin 300384, China
  • 3Tianjin Key Laboratory of High Speed Cutting & Precision Machining, Tianjin University of Technology and Education, Tianjin 300222, China
  • show less
    DOI: 10.3788/IRLA20200326 Cite this Article
    Bin Liu, Qian Qiao, Jing Zhao, Zimiao Zhang, Zhiwei Li, Baofeng Zhang. 3D profile measurement based on depth from focus method using high-frequency component variance weighted entropy image sharpness evaluation function[J]. Infrared and Laser Engineering, 2021, 50(5): 20200326 Copy Citation Text show less
    Schematic diagram of 3D profile measurement based on DFF
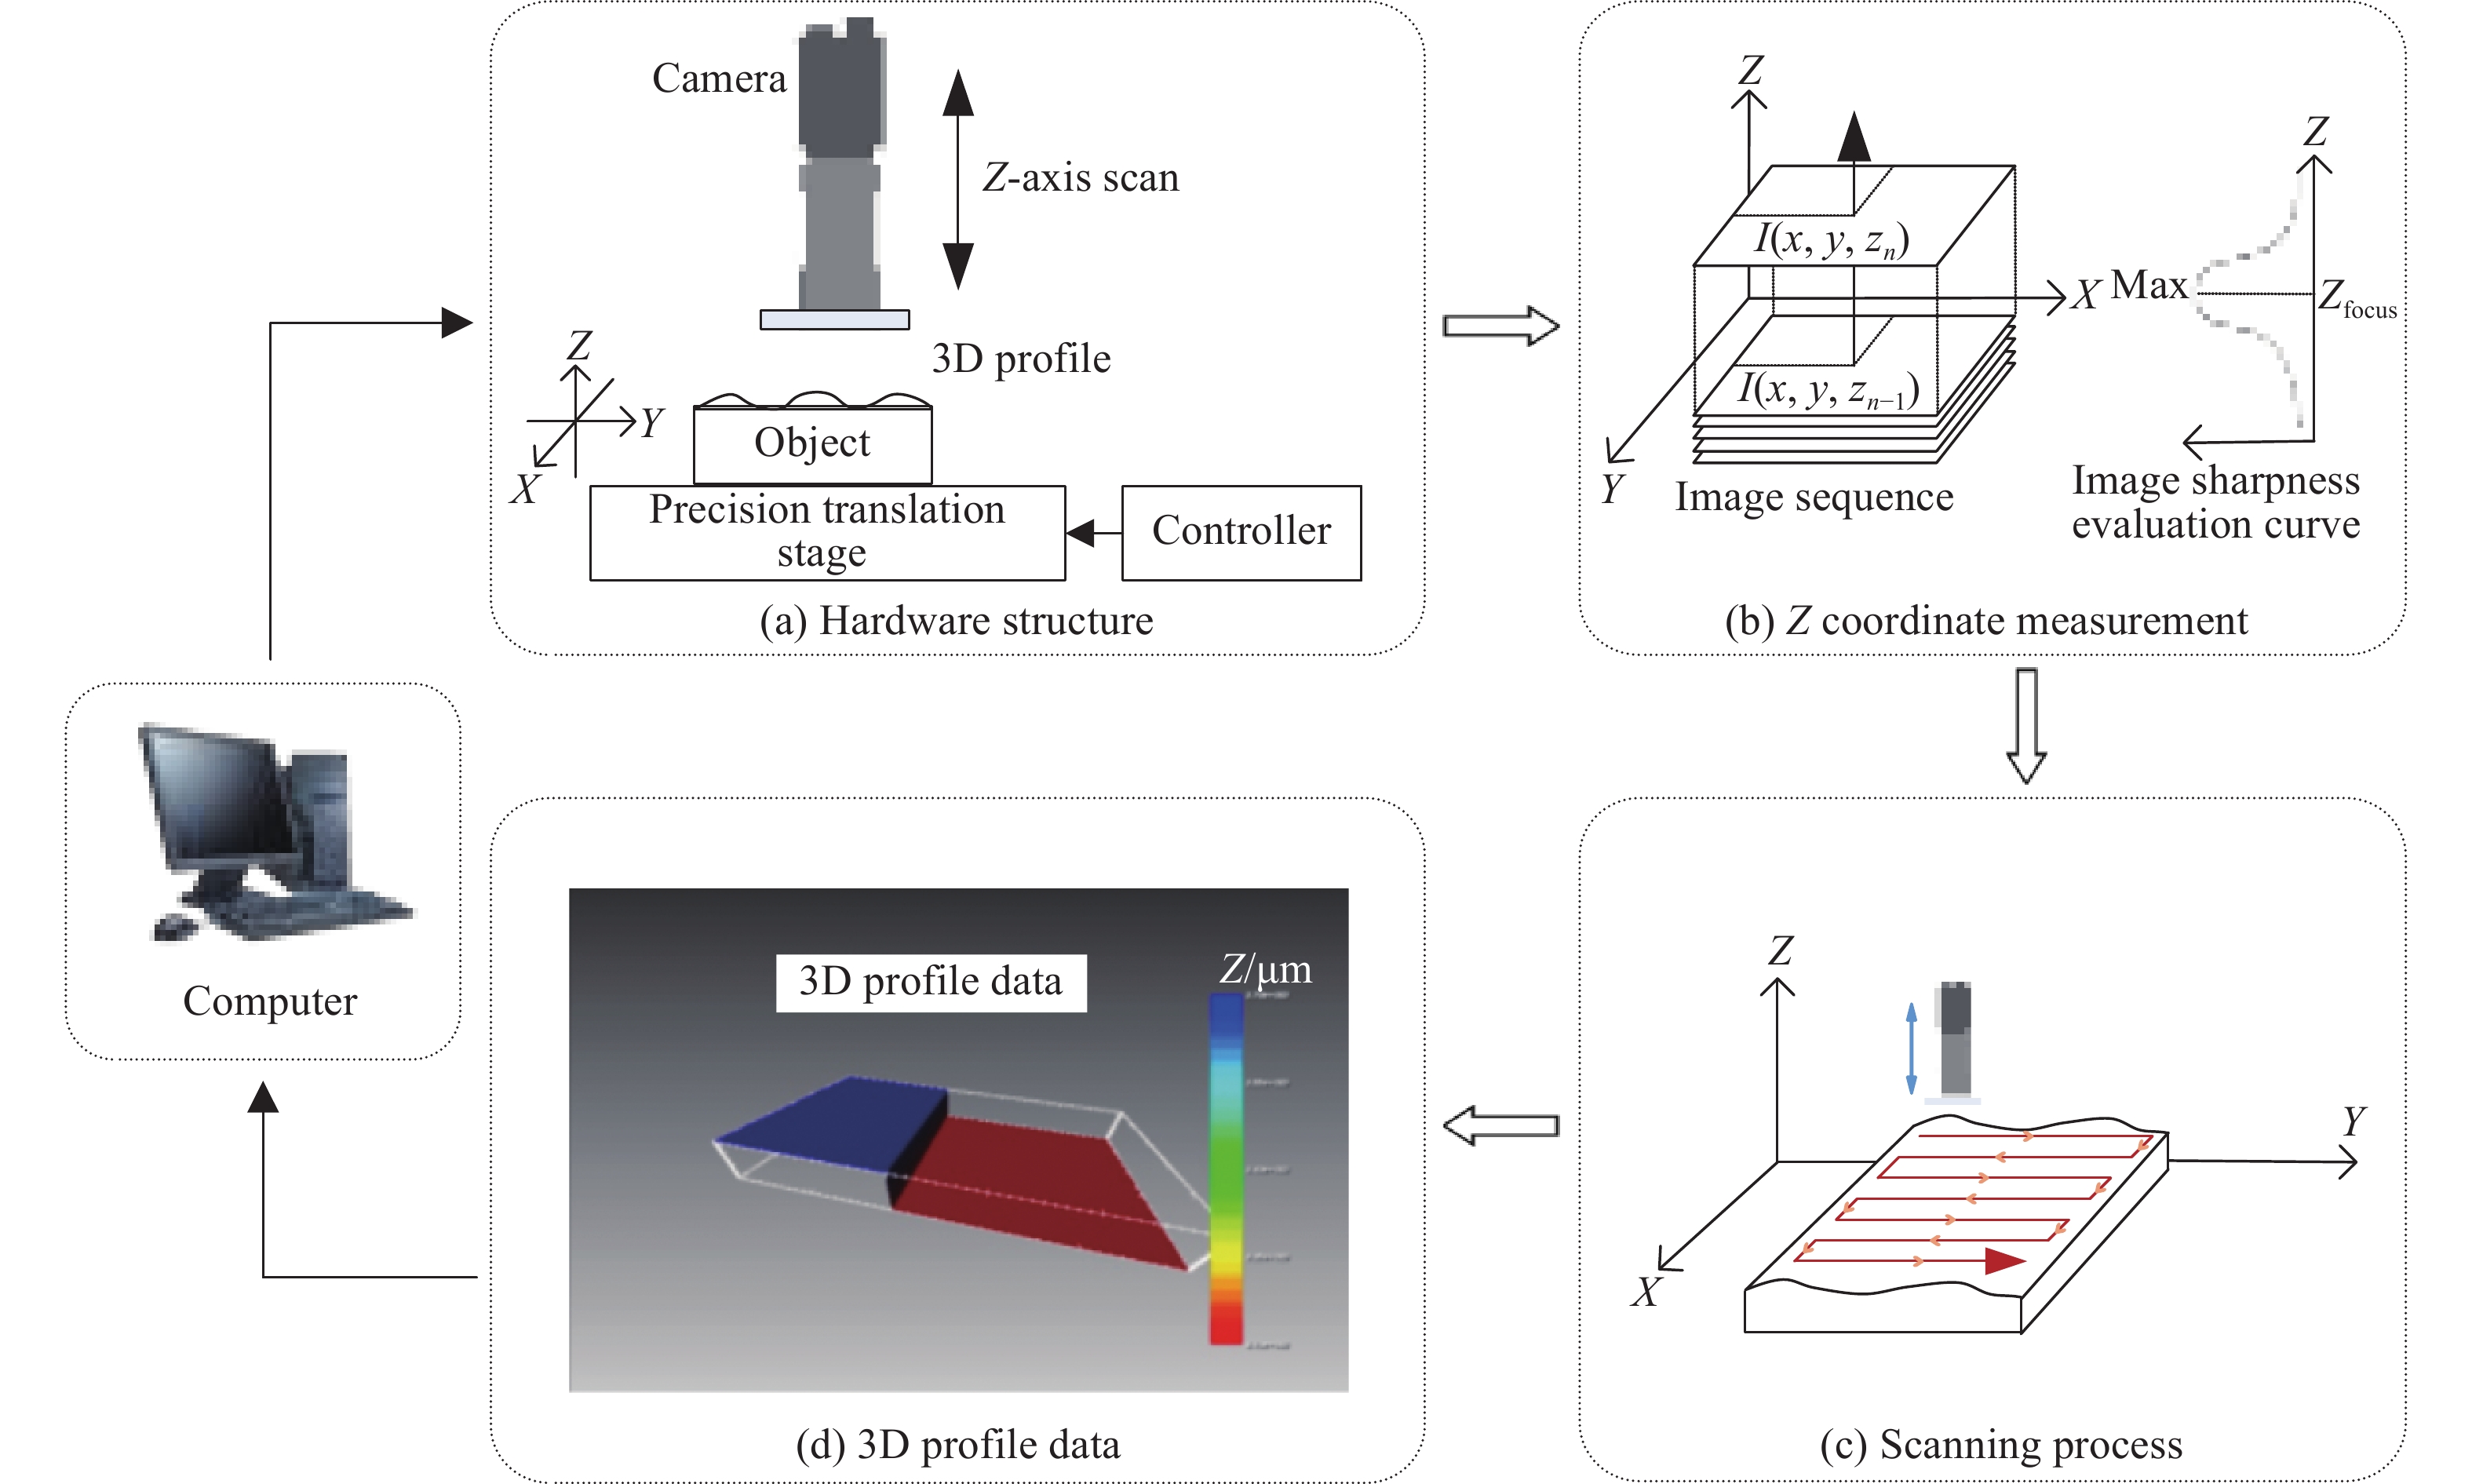
    Fig. 1. Schematic diagram of 3D profile measurement based on DFF
    Acquired image sequence
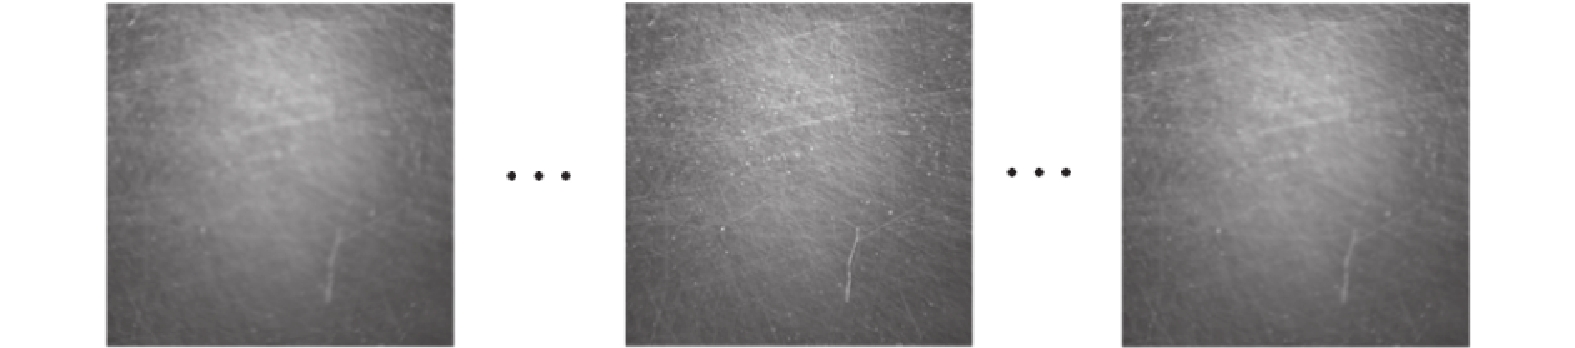
    Fig. 2. Acquired image sequence
    Curves of the common image sharpness evaluation functions
    Fig. 3. Curves of the common image sharpness evaluation functions
    Canny operator processing result
    Fig. 4. Canny operator processing result
    Flow chart of the calculation process of HCVWE function
    Fig. 5. Flow chart of the calculation process of HCVWE function
    Curves of the proposed HCVWE and common image sharpness evaluation functions
    Fig. 6. Curves of the proposed HCVWE and common image sharpness evaluation functions
    Schematic diagram of the sensitivity factor
    Fig. 7. Schematic diagram of the sensitivity factor
    Gaussian fitting result
    Fig. 8. Gaussian fitting result
    Hardware system
    Fig. 9. Hardware system
    Standard height step
    Fig. 10. Standard height step
    Scanning and image acquisition process
    Fig. 11. Scanning and image acquisition process
    Measurement result of the standard step
    Fig. 12. Measurement result of the standard step
    Distance from each upper surface point to the lower plane
    Fig. 13. Distance from each upper surface point to the lower plane
    Distance from each upper surface point to the upper plane
    Fig. 14. Distance from each upper surface point to the upper plane
    Distance from each lower surface point to the lower plane
    Fig. 15. Distance from each lower surface point to the lower plane
    FunctionsRfsen (ε=1) fsen (ε=−1)
    Tenengrad1.5190.0090.038
    Brenner2.3380.0120.017
    Laplace1.5780.0390.007
    Roberts1.5420.0290.003
    LVE4.1150.0190.059
    HCVWE4604.6340.0250.056
    Table 1. Quantitative evaluation indexes
    Scanning rangeFocusing position
    15-1350644.520
    60-1305641.414
    105-1260644.303
    150-1215645.675
    195-1170637.527
    240-1125640.032
    285-1080642.689
    330-1035639.590
    Average value641.969
    Standard deviation2.820
    Table 2. Data of the focusing repeatability test data (Unit: μm)
    Bin Liu, Qian Qiao, Jing Zhao, Zimiao Zhang, Zhiwei Li, Baofeng Zhang. 3D profile measurement based on depth from focus method using high-frequency component variance weighted entropy image sharpness evaluation function[J]. Infrared and Laser Engineering, 2021, 50(5): 20200326
    Download Citation