• Journal of the European Optical Society-Rapid Publications
  • Vol. 19, Issue 2, 2023037 (2023)
Léna Waszczuk1、2、*, Jonas Ogien2, Frédéric Pain1, and Arnaud Dubois1、2
Author Affiliations
  • 1Université Paris-Saclay, Institut d’Optique Graduate School, CNRS, Laboratoire Charles Fabry, Palaiseau 91127, France
  • 2DAMAE Medical, Paris 75013, France
  • show less
    DOI: 10.1051/jeos/2023037 Cite this Article
    Léna Waszczuk, Jonas Ogien, Frédéric Pain, Arnaud Dubois. Determination of scattering coefficient and scattering anisotropy factor of tissue-mimicking phantoms using line-field confocal optical coherence tomography (LC-OCT)[J]. Journal of the European Optical Society-Rapid Publications, 2023, 19(2): 2023037 Copy Citation Text show less
    LC-OCT vertical image (i.e., cross-sectional view) of a bilayered phantom. The LC-OCT image is displayed in a logarithmic intensity scale (arbitrary unit).
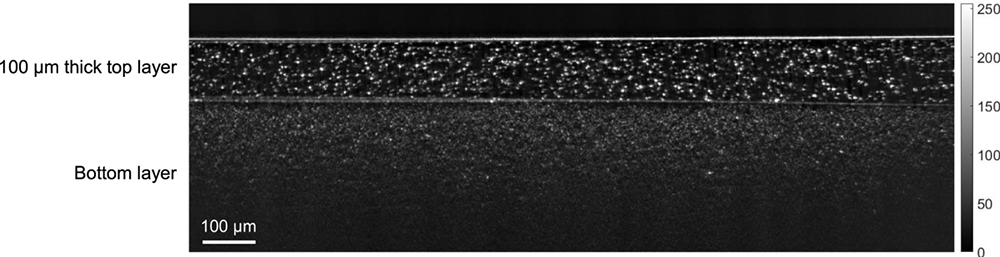
    Fig. 1. LC-OCT vertical image (i.e., cross-sectional view) of a bilayered phantom. The LC-OCT image is displayed in a logarithmic intensity scale (arbitrary unit).
    (a) 3D LC-OCT image (horizontal or en face view and vertical or cross-sectional view) of a phantom made of PDMS and TiO2 particles, in logarithmic intensity scale and (b) averaged intensity profile I(z) in the 3D LCOCT image as a function of depth, in logarithmic scale. A linear regression (red line) is applied on the intensity profile to obtain the measurement of the pair of observables μeff and ρ.
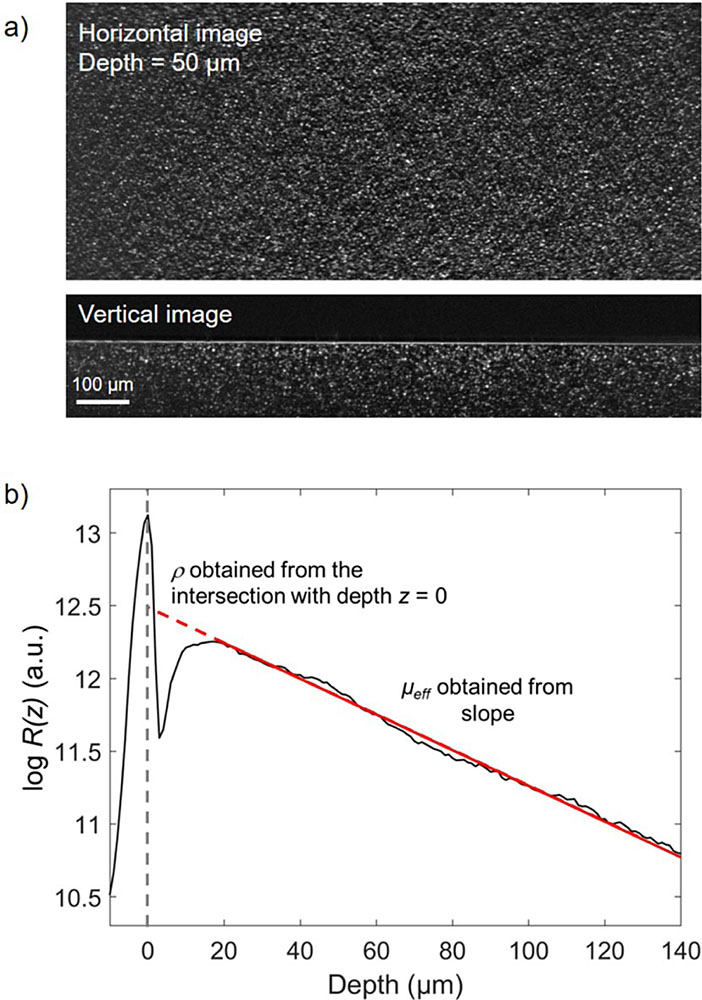
    Fig. 2. (a) 3D LC-OCT image (horizontal or en face view and vertical or cross-sectional view) of a phantom made of PDMS and TiO2 particles, in logarithmic intensity scale and (b) averaged intensity profile I(z) in the 3D LCOCT image as a function of depth, in logarithmic scale. A linear regression (red line) is applied on the intensity profile to obtain the measurement of the pair of observables μeff and ρ.
    Ratio of μeff/ρ as a function of g, calculated for λ = 800 nm, NA = 0.5 and Δz = 1.2 μm.
    Fig. 3. Ratio of μeff/ρ as a function of g, calculated for λ = 800 nm, NA = 0.5 and Δz = 1.2 μm.
    Averaged intensity profile R(z) in the 3D LC-OCT image of a bilayered phantom as a function of depth (in logarithmic scale). For each layer, a linear regression (red line) is applied on the intensity profile to obtain the measurement of the pair of observables (ρtop, μtop) and (ρbottom, μbottom). The value of ρbottom is retrieved from the intercept with the interface between the two layers (z = 110 μm) corrected from attenuation in the top layer.
    Fig. 4. Averaged intensity profile R(z) in the 3D LC-OCT image of a bilayered phantom as a function of depth (in logarithmic scale). For each layer, a linear regression (red line) is applied on the intensity profile to obtain the measurement of the pair of observables (ρtop, μtop) and (ρbottom, μbottom). The value of ρbottom is retrieved from the intercept with the interface between the two layers (z = 110 μm) corrected from attenuation in the top layer.
    Comparison of μs values obtained by LC-OCT and combined integrating spheres and collimated transmission measurements on monolayered phantoms. Mean values and error bars were determined as explained in detail in Section 2.4.
    Fig. 5. Comparison of μs values obtained by LC-OCT and combined integrating spheres and collimated transmission measurements on monolayered phantoms. Mean values and error bars were determined as explained in detail in Section 2.4.
    Comparison of g values obtained by LC-OCT and combined integrating spheres and collimated transmission measurements on monolayered phantoms. Mean values and error bars were determined as explained in detail in Section 2.4.
    Fig. 6. Comparison of g values obtained by LC-OCT and combined integrating spheres and collimated transmission measurements on monolayered phantoms. Mean values and error bars were determined as explained in detail in Section 2.4.
    High-resolution microscopic images of phantom 9 acquired with a 1.35 NA objective. (a) Image acquired in a homogeneous region without aggregates and (b) image acquired in a region with particle aggregates.
    Fig. 7. High-resolution microscopic images of phantom 9 acquired with a 1.35 NA objective. (a) Image acquired in a homogeneous region without aggregates and (b) image acquired in a region with particle aggregates.
    Comparison of μs and g values (mean ± standard deviation) obtained by LC-OCT and combined integrating spheres and collimated transmission measurements on two different bilayered phantoms.
    Fig. 8. Comparison of μs and g values (mean ± standard deviation) obtained by LC-OCT and combined integrating spheres and collimated transmission measurements on two different bilayered phantoms.
    Bilayeredphantom LayerCorresponding monolayered phantomParticle materialSizeDensity (% weight of PDMS)
    No. 1Top layerPhantom no. 5ZnO800 nm1.19%
    Bottom layerPhantom no. 2TiO2<5 μm0.30%
    No. 2Top layerPhantom no. 2TiO2<5 μm0.30%
    Bottom layerPhantom no. 5ZnO800 nm1.19%
    Table 0. Summary of bilayered phantoms composition, given by the material, size and weight concentration of the scattering particles embedded in PDMS.
    PhantomParticle materialRefractive indexSizeDensity (% weight of PDMS)μs targetg target
    No. 0TiO22.29<5 μm0.40%
    No. 1TiO22.29800 nm0.13%1.8 mm−10.6
    No. 2TiO22.29<5 μm0.30%
    No. 3TiO22.29800 nm1.34%18 mm−10.6
    No. 4ZnO1.96800 nm0.12%1.4 mm−10.8
    No. 5ZnO1.96800 nm1.19%14 mm−10.8
    No. 6SiO21.54400 nm1.27%1 mm−10.7
    No. 7SiO21.54400 nm12.7%10 mm−10.7
    No. 8SiO21.541 μm0.38%1 mm−10.9
    No. 9SiO21.541 μm3.81%10 mm−10.9
    Table 0. Summary of monolayered phantoms composition. All phantoms are made of a PDMS matrix including scattering particles of different materials, sizes and concentrations.
    Léna Waszczuk, Jonas Ogien, Frédéric Pain, Arnaud Dubois. Determination of scattering coefficient and scattering anisotropy factor of tissue-mimicking phantoms using line-field confocal optical coherence tomography (LC-OCT)[J]. Journal of the European Optical Society-Rapid Publications, 2023, 19(2): 2023037
    Download Citation