• Chinese Journal of Lasers
  • Vol. 48, Issue 24, 2407001 (2021)
Yang Zhang1、2, Tengchao He1、3, Weishuai Zhong1、3, Meili Dong1、3, Jingshu Ni1、2, Yong Liu1, Yikun Wang1、3、**, and Yuanzhi Zhang1、*
Author Affiliations
  • 1Anhui Institute of Optics and Fine Mechanics, Hefei Institutes of Physical Science, Chinese Academy of Sciences, Anhui Provincial Engineering Technology Research Center for Biomedical Optical Instrument, Anhui Provincial Engineering Laboratory for Medical Optical Diagnosis & Treatment Technology and Instrument, Hefei, Anhui 230031, China;
  • 2Science Island Branch, Graduate School of University of Science and Technology of China, Hefei, Anhui 230026, China
  • 3Wan Jiang New Industry Technology Development Center, Tongling, Anhui 244000, China
  • show less
    DOI: 10.3788/CJL202148.2407001 Cite this Article Set citation alerts
    Yang Zhang, Tengchao He, Weishuai Zhong, Meili Dong, Jingshu Ni, Yong Liu, Yikun Wang, Yuanzhi Zhang. Flow Mediated Tissue Fluorescence Measurement System and Phantom Verification[J]. Chinese Journal of Lasers, 2021, 48(24): 2407001 Copy Citation Text show less
    Schematic of flow-mediated tissue fluorescence spectrum measurement system and end distribution of probe
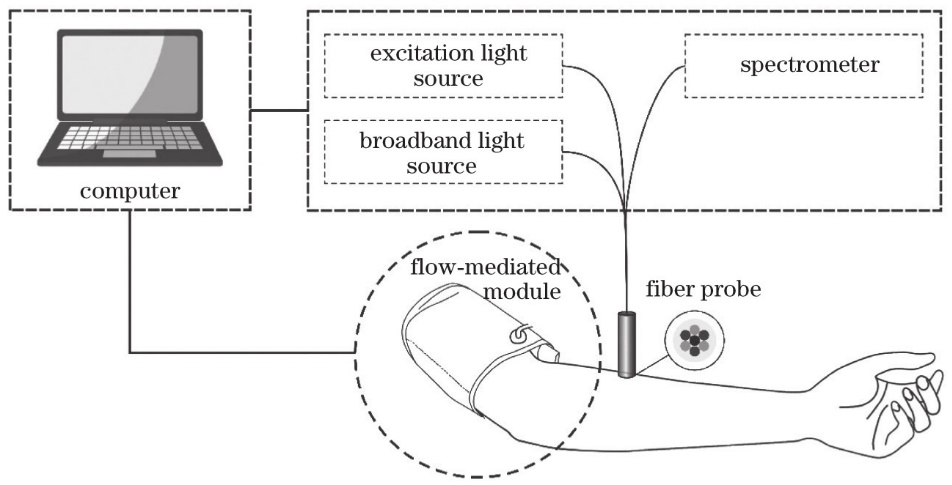
    Fig. 1. Schematic of flow-mediated tissue fluorescence spectrum measurement system and end distribution of probe
    Calculated values of three filter criteria with different α and β pairs. (a) Variable coefficient of fluorescence intensity of tissue phantom; (b) linear correlation coefficient between fluorescence intensity with fluorescent component concentration; (c) difference distribution of fluorescence spectrum curve shapes
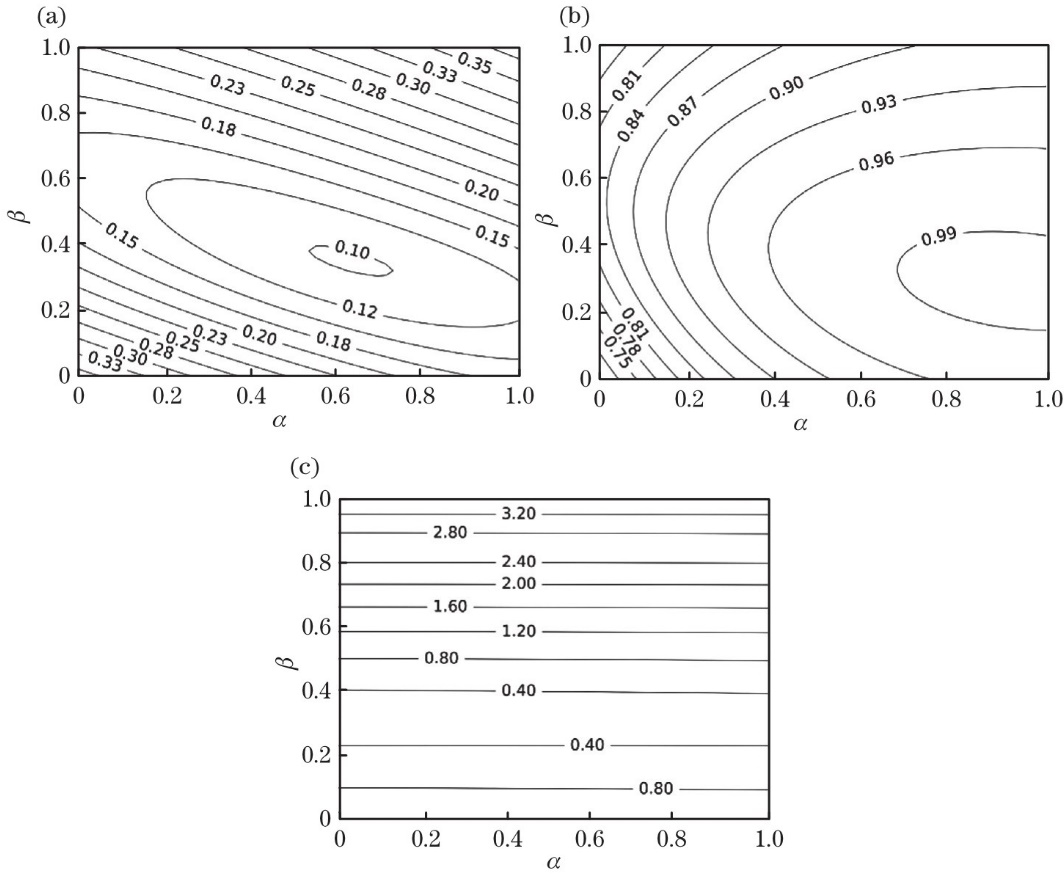
    Fig. 2. Calculated values of three filter criteria with different α and β pairs. (a) Variable coefficient of fluorescence intensity of tissue phantom; (b) linear correlation coefficient between fluorescence intensity with fluorescent component concentration; (c) difference distribution of fluorescence spectrum curve shapes
    Relationship between concentration of fluorescent components and fluorescence intensity before and after recovery. (a) Relationship between concentration of fluorescent components and fluorescence intensity before recovery; (b) relationship between concentration of fluorescent components and fluorescence intensity after recovery; (c) fluorescence spectrum curves of phantom before and after recovery. Among them, curve 1 is the normalized mean spectral curve of fluorescence spectra of five different concentrations of NADH tissue without absorption and scattering characteristics, curve 2 is the normalized mean spectral curve of fluorescence spectra of 45 groups of NADH tissue with different absorption and scattering characteristics after spectral recovery, and curve 3 is the measured normalized mean spectral curve of fluorescence spectra of 45 groups of NADH tissue with different absorption and scattering characteristics
    Fig. 3. Relationship between concentration of fluorescent components and fluorescence intensity before and after recovery. (a) Relationship between concentration of fluorescent components and fluorescence intensity before recovery; (b) relationship between concentration of fluorescent components and fluorescence intensity after recovery; (c) fluorescence spectrum curves of phantom before and after recovery. Among them, curve 1 is the normalized mean spectral curve of fluorescence spectra of five different concentrations of NADH tissue without absorption and scattering characteristics, curve 2 is the normalized mean spectral curve of fluorescence spectra of 45 groups of NADH tissue with different absorption and scattering characteristics after spectral recovery, and curve 3 is the measured normalized mean spectral curve of fluorescence spectra of 45 groups of NADH tissue with different absorption and scattering characteristics
    Changes of blood hemoglobin concentration and oxygen saturation during oxygen consumption. (a) Change of blood hemoglobin concentration; (b) change of oxygen saturation
    Fig. 4. Changes of blood hemoglobin concentration and oxygen saturation during oxygen consumption. (a) Change of blood hemoglobin concentration; (b) change of oxygen saturation
    Changes of NADH fluorescence intensity of blood phantom before and after recovery
    Fig. 5. Changes of NADH fluorescence intensity of blood phantom before and after recovery
    Changes of normalized fluorescence intensity of the subject’s skin before and after recovery in the blood flow mediated process. (a) Normalized fluorescence intensity of skin before recovery; (b)normalized fluorescence intensity of skin after recovery
    Fig. 6. Changes of normalized fluorescence intensity of the subject’s skin before and after recovery in the blood flow mediated process. (a) Normalized fluorescence intensity of skin before recovery; (b)normalized fluorescence intensity of skin after recovery
    SubjectnumberLFRLFR (recovery)Change rateHFRHFR(recovery)Change rate
    Subject 126.719.527.012.710.120.5
    Subject 214.610.230.117.013.620.0
    Subject 314.411.619.414.29.930.3
    Subject 423.419.815.410.48.617.3
    Average value19.815.2823.013.610.622.0
    Table 1. Fluorescence response value and change rate of brachial artery occlusion and recovery in 4 subjects before and after recovery%
    Yang Zhang, Tengchao He, Weishuai Zhong, Meili Dong, Jingshu Ni, Yong Liu, Yikun Wang, Yuanzhi Zhang. Flow Mediated Tissue Fluorescence Measurement System and Phantom Verification[J]. Chinese Journal of Lasers, 2021, 48(24): 2407001
    Download Citation