1Key Laboratory of Southeast Coast Marine Information Intelligent Perception and Application,Ministry of Natural Resources,Zhangzhou Institute of Surveying and Mapping,Zhangzhou 363000,China
2Anhui Province Key Laboratory of Physical Geographic Environment,Chuzhou University,Chuzhou 239000,China
3College of Electronic and Information Engineering,Nanjing University of Aeronautics and Astronautics,Nanjing 210016,China
4School of Management,Nanjing University of Posts and Telecommunications,Nanjing 210003,China
5Key Laboratory of Meteorology and Ecological Environment of Hebei Province,Meteorological Institute of Hebei,Shijiazhuang 050021,China
6Xi’an Key Laboratory of Territorial Spatial Information,Chang'an University,Xi’an 710064,China
Peng WANG, Yong-Kang CHEN, Gong ZHANG, Hong-Ying WANG, Chun-Lei ZHAO, Ling HAN. Sub-pixel mapping based on spectral information of irregular scale areas for hyperspectral images[J]. Journal of Infrared and Millimeter Waves, 2023, 42(4): 538
Copy Citation Text
Sub-pixel mapping technology can analyze mixed pixels and realize the transformation from fractional images to fine a land-cover mapping image at the sub-pixel level. However, the spectral information used by the traditional sub-pixel mapping methods is usually constructed in a specified rectangular local window, and the spectral information of all bands is rarely used, affecting the performance of sub-pixel mapping. To solve this issue, sub-pixel mapping based on spectral information of irregular scale areas (SIISA) for hyperspectral images is proposed in this paper. The experimental results on three remote sensing images show the proposed SIISA outperforms the existing sub-pixel mapping methods.
Due to its rich spectral information from hundreds of bands,hyperspectral images not only have been actively investigated by remote sensing scholars in recent years,but also widely utilized in many fields,such as burned-area mapping,flood inundation mapping,and forest cover monitor[1]. However,with the continuous improvement of spectral resolution of hyperspectral images,its spatial resolution will be affected,resulting in many mixed pixels[2,3]. Spectral unmixing could handle with these mixed pixels to obtain the abundance images including the proportional values of sub-pixels belonging to land-cover classes,but the specific spatial distribution information on land-cover classes still cannot be extracted[4]. To solve this issue,sub-pixel mapping which is as the subsequent processing technology of spectral unmixing is proposed. In sub-pixel mapping,each pixel is divided into S2 sub-pixels according to factor scale S,land-cover class labels are then assigned to sub-pixels to obtain the fine land cover-class mapping images at sub-pixel scale[5].
According to the method of obtaining the sub-pixel mapping results,there are two main types,the initialization-then-optimization sub-pixel mapping and soft-then-hard sub-pixel mapping. In the initialization-then-optimization sub-pixel mapping,class labels are allocated randomly to sub-pixels,and the location of each sub-pixel is optimized to obtain the final result[6]. The sub-pixel mapping methods based on the perimeter minimization,pixel swapping,and particle swarm optimization all belong to the initialization-then-optimization sub-pixel mapping[7,8]. However,this type usually has a long processing time due to the high computational complexity of optimization. On the other hand,the soft-then-hard sub-pixel mapping type has simple processing,which makes this type be more popular than the other sub-pixel mapping type[9]. The soft-then-hard type involves two steps,the sub-pixel sharpening and the class allocation. Fine fractional images with the land-cover class proportions corresponding to the sub-pixels are first obtained by sub-pixel sharpening using the methods based on super-resolution reconstruction,backpropagation neural network,spatial attraction model,indicator-cokriging,and Hopfield neural networks[10-13]. Then,the class labels are allocated to all sub-pixels by class allocation according to the proportions. The class allocation methods include the simulated annealing,the linear optimization,the highest fraction value,and units of classes[14,15].
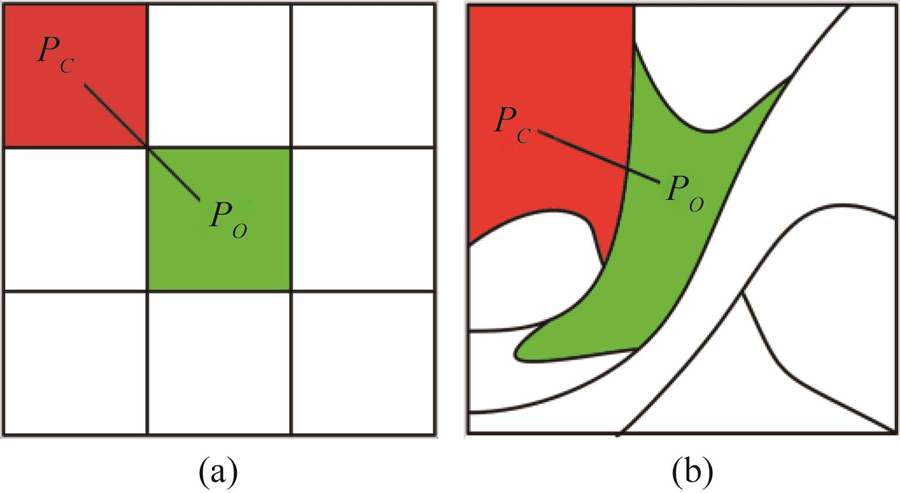
Most soft-then-hard sub-pixel mapping methods are based on the spatial dependence assumption,namely,the closer the spatial distance is,the more likely the sub-pixels belong to the same land-cover class[16-19]. According to the spatial dependence assumption,Mertens et al. obtained the pixel-scale spatial information by using the spatial attraction model between sub-pixels and pixels,and the mapping result was derived according to this spatial information[20]. In order to obtain more precise scale spatial information,Ling et al. proposed a spatial attraction model between sub-pixels to obtain sub-pixel scale spatial information,improving the mapping accuracy of land-cover classes[21]. Chen et al. used the image segmentation algorithm to segment the abundance images,and then calculated the irregular scale areas from the segmentation images to obtain a kind of object-scale spatial information[22]. Further,Wang et al. used the random walk algorithm to consider the spatial dependence among and within the irregular scale areas at the same time,so as to obtain the better mapping results[23]. However,the current sub-pixel mapping methods usually use the dependence between sub-pixels in the specified rectangular local window to obtain the spectral information,as shown in Fig. 1(a),and the number of spectral bands used is also little. But the distribution area of land-cover class is irregular in the actual environment,as shown in Fig. 1(b),and the spectral information in each band is also different. Therefore,the spectral information in the current sub-pixel mapping methods is usually not accurate enough,affecting the final mapping result.
Figure 1.Spatial information in(a)the rectangular local window and(b)the irregular scale areas
To solve this issue,sub-pixel mapping based on spectral information of irregular scale areas(SIISA)for hyperspectral images is proposed in this paper. The contributions of this work are as follows:
(1)Through establishing the normalized model,the proposed SIISA considers the spectral information of irregular scale areas and utilizes the spectral information of all bands,improving the accuracy of mapping results.
(2)The proposed SIISA combines the spectral information of irregular scale areas with the spatial information of irregular scale areas generated from our previous work[23] to obtain more accurate spatial-spectral information. The spatial-spectral information is closer to the real distribution of land-cover classes,which improves the performance of sub-pixel mapping.
(3)The superiority of SIISA over the existing sub-pixel mapping methods is demonstrated by testing three remote sensing images.
This paper is organized as follows. Section I introduces the proposed method in detail. Section II shows the experimental analysis. Section III gives the conclusions.
1 Method
The overall process of SIISA is shown in Fig. 2. The coarse original hyperspectral image is first upsampled by bicubic interpolation according to factor scale. The upsampled image is then unmixed and segmented to obtain the abundance image of each class and the segmentation image,respectively. Next,the random walker algorithm is used to calculate the proportional values of sub-pixels belonging to irregular scale areas from the fusion result of the abundance image of each class and segmentation image to obtain the spatial information of irregular scale areas. In addition,the normalized model is constructed to calculate the segmentation image to yield the spectral information of irregular scale areas for all bands. Finally,according to fusion results of spatial information and spectral information,class labels are assigned to sub-pixels to obtain the mapping result by class allocation method.
Suppose the coarse original hyperspectral image is . The upsampled image is obtained by bicubic interpolation. The abundance image from the upsampled image is (=1,2,...,,is the number of land-cover classes)with the proportional value of sub-pixel (=1,2,...,, is the number of mixed pixels, is the number of sub-pixels)belonging to the land-cover class. At the same time,the segmentation result from the upsampled image is with the irregular scale areas (=1,2,...,, is the number of irregular scale areas)by a segmentation scale parameter ,where contains sub-pixels. We integrate the abundance image of each class with the principal component of segmentation images to obtain the proportional values of sub-pixels in irregular scale areas. Therefore,the proportion value of the irregular scale areas belonging to the land-cover class is obtained by averaging these proportion values of sub-pixels in this area,as shown in Eq.(1).
.
Next,we will introduce in detail the two modules included in the proposed SIISA method,namely the spatial information module and the spectral information module.
1.1 Spatial information module
In spatial information module,we calculate the proportion value of the irregular scale areas to obtain the spatial information of irregular scale areas by using the random walk algorithm[23],as shown in Eq.(2).
,
where is the column vector and is the empirical weight parameter,which is set to 0.5 here. represents the internal spatial information of each irregular scale area,and represents the spatial information between adjacent irregular scale areas. They can be calculated by Eqs.(3)and(4),respectively.
,,
where is a diagonal matrix,where the value on the diagonal is the proportional value of each irregular scale area belonging to the land-cover class,and the value on the diagonal in is the proportional value of each irregular scale area belonging to the land-cover class. The representation of is a vector whose elements are 1. is a Laplace matrix which represents the difference between adjacent areas,as shown in Eq.(5).
,
where is the spectral value difference between the irregular scale area and the irregular scale area .
1.2 Spectral information module
In spectral information module,the spectral information of all bands in the irregular scale areas is obtained by using the previously obtained segmentation image . The segmentation image contains irregular scale regions ,and each includes sub-pixels. Assuming that the spectrum of sub-pixels in each irregular scale area follows an approximate normal distribution[24],a normalized model is constructed to calculate the spectral information of all bands in irregular scale areas as:
,
where is the number of spectral bands,and and is the average value and standard deviation of the spectral reflectance of the irregular scale area in the band . They are obtained by calculating the spectral reflectance of all sub-pixels in this irregular scale area. represents the spectral reflectance of the sub-pixel in the band in the irregular scale area .
The spatial information and spectral information are then integrated through the weight parameter to obtain the irregular scale spatial- spectral information ,as shown in Eq.(7).
.
Finally,the class allocation based on particle swarm optimization[25] is used to optimize the objective function to obtain the final mapping result. First,land-cover class labels are randomly assigned to all sub-pixels. Then,the labels of these sub-pixels are updated iteratively until the objective function reaches the minimum value. In each iteration,when the label assigned to a sub-pixel is converted to other labels,if the objective function value decreases,the conversion will be accepted,and if it increases,the conversion will be rejected. It is stipulated that when the converted sub-pixel is less than 0.1% of the total number,the class allocation terminates,obtaining the final mapping result.
2 Experiment
2.1 Experimental dataset
Three datasets are tested to evaluate the performance of the proposed SIISA. According to the general experimental process of sub-pixel mapping,the original fine hyperspectral image is downsampled by an mean filter to obtain the simulated coarse image as input[26,27]. Due to its good robustness,the spectral unmixing method based on support vector machine is used to obtain the abundance images from the simulated coarse image[10]. A reference image is yielded by classifying the fine hyperspectral image. The weight parameter is selected as 0.6,0.6 and 0.5 for experiments 1,2 and 3,respectively. The segmentation scale parameter is set to 10,10 and 5 for the three datasets,respectively.
In the experiment 1,the performance of the proposed method is tested in the dataset from the multispectral sensor. The tested dataset is acquired over Rome,Italy from Landsat 8. As shown in Fig. 3(a),the fine multispectral dataset is with six bands,300 × 300 pixels,and 30-m spatial resolution. Figure 3(a)is downsampled with S=8 to produce the simulated coarse image shown in Fig. 3(b). The dataset of experiment 2 is from the hyperspectral sensor. As shown in Fig. 4(a),the fine hyperspectral image with 320 × 320 pixels,103 bands,and 1.3-m spatial resolution is captured over the Engineering School at University of Pavia,Italy by reflective optics system imaging spectrometer(ROSIS). As shown in Fig. 4(b),the fine hyperspectral is downsampled with to produce the simulated coarse image. In order to verify the performance of the proposed SIISA in hyperspectral image with larger size,as shown in Fig. 5(a),the fine hyperspectral image with 1500 × 3000 pixels,250 bands,and 0.5-m spatial resolution captured over Xiong'an New Area,China is tested in experiment 3. The five sub-pixel methods are evaluated by repeating experiments for three scale factor values(i.e.,10,15,and 25). Figure 5(b)shows the simulated coarse image at .
Figure 3.Multispectral images covering Rome, Italy,(a)RGB of multispectral image,(b)coarse image(S=8)
The proposed SIISA was compared with four sub-pixel mapping methods including spatial-spectral interpolation(SSI)[28],pixel and sub-pixel spatial dependence(PSSD)[21],object-scale spatial information(OSI)[22],and s random walk algorithm(RWA)[23]. The evaluation indices of mapping results include the mapping accuracy of each land-cover class,the overall accuracy(OA),and the Kappa coefficient(Kappa). All experiments are tested by MATLAB 2018a software on a Pentium® Dual-core Processor(2.20 GHz).
2.2 Results analysis
The results of experiment 1 are shown in Fig. 6. When compared with the reference image in Fig. 6(a),it is noted that there are still some artefacts in the four traditional methods in Figs. 6(b)-(e). For example,there is a sort of grid in Building in Fig. 6(c),this is because the PSSD favors the class of the majority of the sub-pixel neighbors,form aggregated and homogenized patches. Since the more comprehensive spectral information of the irregular scale areas is considered in the proposed SIISA,the SIISA outperforms the other four SPM methods. Smoother boundaries and more continuous regions in Fig. 6(f)are achieved and the result of SIISA is closer to the reference image. In addition,the evaluation indicators of the five methods are listed in Table 1. When comparing with the mapping accuracy of each class in RWA,the accuracy of Vegetation,Building,and Soil in the proposed SIISA are increased by about 1.49%,3.59%,and 1.73%,respectively. The OA(%)is 78.67% in SIISA,around 2.62% greater than that in RWA. According to the definition of OA(%),since the tested region has 300×300 pixels,the correct number of pixels in SIISA is about 2358 pixels more than that in RWA. The SIISA can also obtain the highest Kappa of 0.656 6. The gain in accuracy of the proposed method is appeared.
The mapping results of experiment 2 are shown in Figs. 7(b)-(f). Since the spatial information used in SSI and PSSD is usually constructed according to the assumption in the regular rectangular local window,many disconnected patches and obvious burrs are observed in Figs. 7(b)-(c). Due to considering the more accurate spatial information of the irregular scale areas in OSI,RWA and SIISA,these phenomena are alleviated in Figs. 7(d)-(f). Especially,the proposed SIISA also considers the spectral information of the irregular scale areas,the mapping result of the proposed SIISA in Fig. 7(f)is the closest to the reference image in Fig. 7(a). The mapping accuracy of each class,OA(%)and Kappa values for five sub-pixel mapping methods are listed in Table 2. As shown in Table 2,the proposed SIISA obtains higher values of the three evaluation indices than the other four methods. For example,compared with the mapping accuracy of each class in RWA,the accuracy of Road,Tree,and Grass in the proposed SIISA are improved by about 8.02%,3.79%,and 1.48%,respectively. In addition,the proposed SIISA has the highest OA(%)of 85.22%,and Kappa of 0.8157. When compared by RWA,there is a growth about OA(%)of 2.03% and Kappa of 0.018. Since the tested region has 320×320 pixels,growth about OA(%)of 2.03% means the correct number of pixels in SIISA is about 2079 pixels more than that in RWA. The above indices further confirm that the proposed SIISA can significantly improve the mapping result.
The mapping results of experiment 3 are presented in Figs. 8(b)-(f). To facilitate observation,in Fig. 9,the salient sub-regions with 4000×4000 pixels marked in Fig. 8(a)with a white frame are magnified. Compared with the reference image in Fig. 9(a),there were many boundaries with burrs in Figs. 9(b)–(e). This was because these methods lacked the accurate spectral information of the irregular scale areas. Nevertheless,the proposed SIISA could consider not only spatial information of the irregular scale areas but also spectral information of the irregular scale areas. The boundaries became smoother,as shown in Fig. 9(f). Therefore,similar to the visual comparison results of Experiment 1 and 2,the proposed SIISA is the closest to the reference image. The OA(%)and Kappa for three scale values(i.e.,10,15,and 25)are shown in Fig. 10,where it can be seen that the OA(%)and Kappa of the five methods decreased as S increased. This is because a larger value of S referred to a coarser generated image,which affects the performance of the five sub-pixel methods significantly. However,consistent with the experimental results in Table 1 and 2,the proposed SIISA achieves the highest OA(%)and Kappavalue in all three cases. Namely,SIISA shows the best performance for all considered degrees of coarse images.
As shown in Eq.(7),the weight parameter is used to balance the influence of spatial information and spectral information in SIISA. Therefore,we discuss how to select the weight parameter . In addition,this study also demonstrates the spatial information and spectral information can improve the mapping results,respectively. Experiments 2()and 3()are repeated to obtain the OA(%)for ten combinations of in the range of[0,0.9]at an interval of 0.1. As shown in Fig. 11,when ,there is only spatial information in the proposed SIISA. As the value of increases,the value of OA(%)also increases due to adding the spectral information to the SIISA,and the more accurate spectral properties are utilized to improve the mapping result. It is noted that when the value of OA(%)achieves the highest value,the most appropriate value of in experiments 1 and 2 is 0.6 and 0.5,respectively.
Figure 11.OA(%)value of the SIISA in relation to weight parameter in(a)experiments 2 and(b)3
In addition,the segmentation is an important step to obtain the irregular scale areas in the proposed SIISA. The segmentation scale parameter mainly decides the quality of the irregular scale areas. Hence,the optimal selection of the segmentation scale parameter is necessary to analyze. Ten segmentation scale parameters(from 5 to 50 with an interval of 5)are applied to experiments 2()and 3(). Figure 12 presents the experimental results,and it can be observed that the best segmentation scale parameters of experiments 2 and 3 are 10 and 5,respectively,when the OA(%)achieves the greatest value.
Figure 12.OA(%)value of the SIISA in relation to segmentation scale parameter V in(a)experiments 2 and(b)3
In this paper,we propose the SIISA method which establishes a normalized model to extract the spectral information of the irregular scale areas and utilizes the spectral information of all bands,improving the sub-pixel mapping result. The experimental results on three remote sensing images show that the proposed method has the better performance than the existing sub-pixel mapping methods. In terms of visual comparison,the land-cover class mapping results obtained by the proposed SIISA method have more continuous regions and smoother boundary. In terms of quantitative comparison,for Rome dataset,the accuracy of Road,Tree,and Grass in the proposed SIISA achieves the highest values,achieving 74.88%,84.31% and 71.37%,respectively. For University of Pavia dataset,the proposed SIISA method produces the highest OA(%)and Kappa,achieving 85.22% and 0.8157. For Xiong'an New Area dataset,the proposed SIISA method can still obtain the best evaluation indices under the three scales.
Because the main contributions of this paper are to propose more accurate spectral information of the irregular scale areas,from the perspective of the universality of the algorithm,this useful spectral information can also be applied to improve other remote sensing image processing technologies,such as remote sensing image classification,target recognition and change detection. In addition,experiments with different types of sensors also prove that the proposed method is generally applicable to a variety of types of multispectral images and hyperspectral images. The appropriate parameter is selected by multiple tests in this paper. Therefore,an adaptive method for selecting is worth studying in future work.
References
[1] Feng LING, Shen-Jun WU, Fei XIAO et al. Sub-pixel mapping of remotely sensed imagery: a review. Journal of Image and Graphics, 16, 1335-1345(2011).
[26] Xiong XU, Yan-Fei ZHONG, Liang-Pei ZHANG et al. A sub-pixel mapping algorithm based on BP neural network with spatial autocorrelation function for remote sensing imagery. Acta Geodaetica et Cartographica Sinica, 40, 307-311(2011).
Peng WANG, Yong-Kang CHEN, Gong ZHANG, Hong-Ying WANG, Chun-Lei ZHAO, Ling HAN. Sub-pixel mapping based on spectral information of irregular scale areas for hyperspectral images[J]. Journal of Infrared and Millimeter Waves, 2023, 42(4): 538