
Jian-Sheng WANG, Qing-Li LI, Mei ZHOU, Li SUN, Meng-Han HU, Yue LYU, Jun-Hao CHU. Identification and measurement of cutaneous melanoma superficial spreading depth using microscopic hyperspectral imaging technology[J]. Journal of Infrared and Millimeter Waves, 2020, 39(6): 749
- Journal of Infrared and Millimeter Waves
- Vol. 39, Issue 6, 749 (2020)
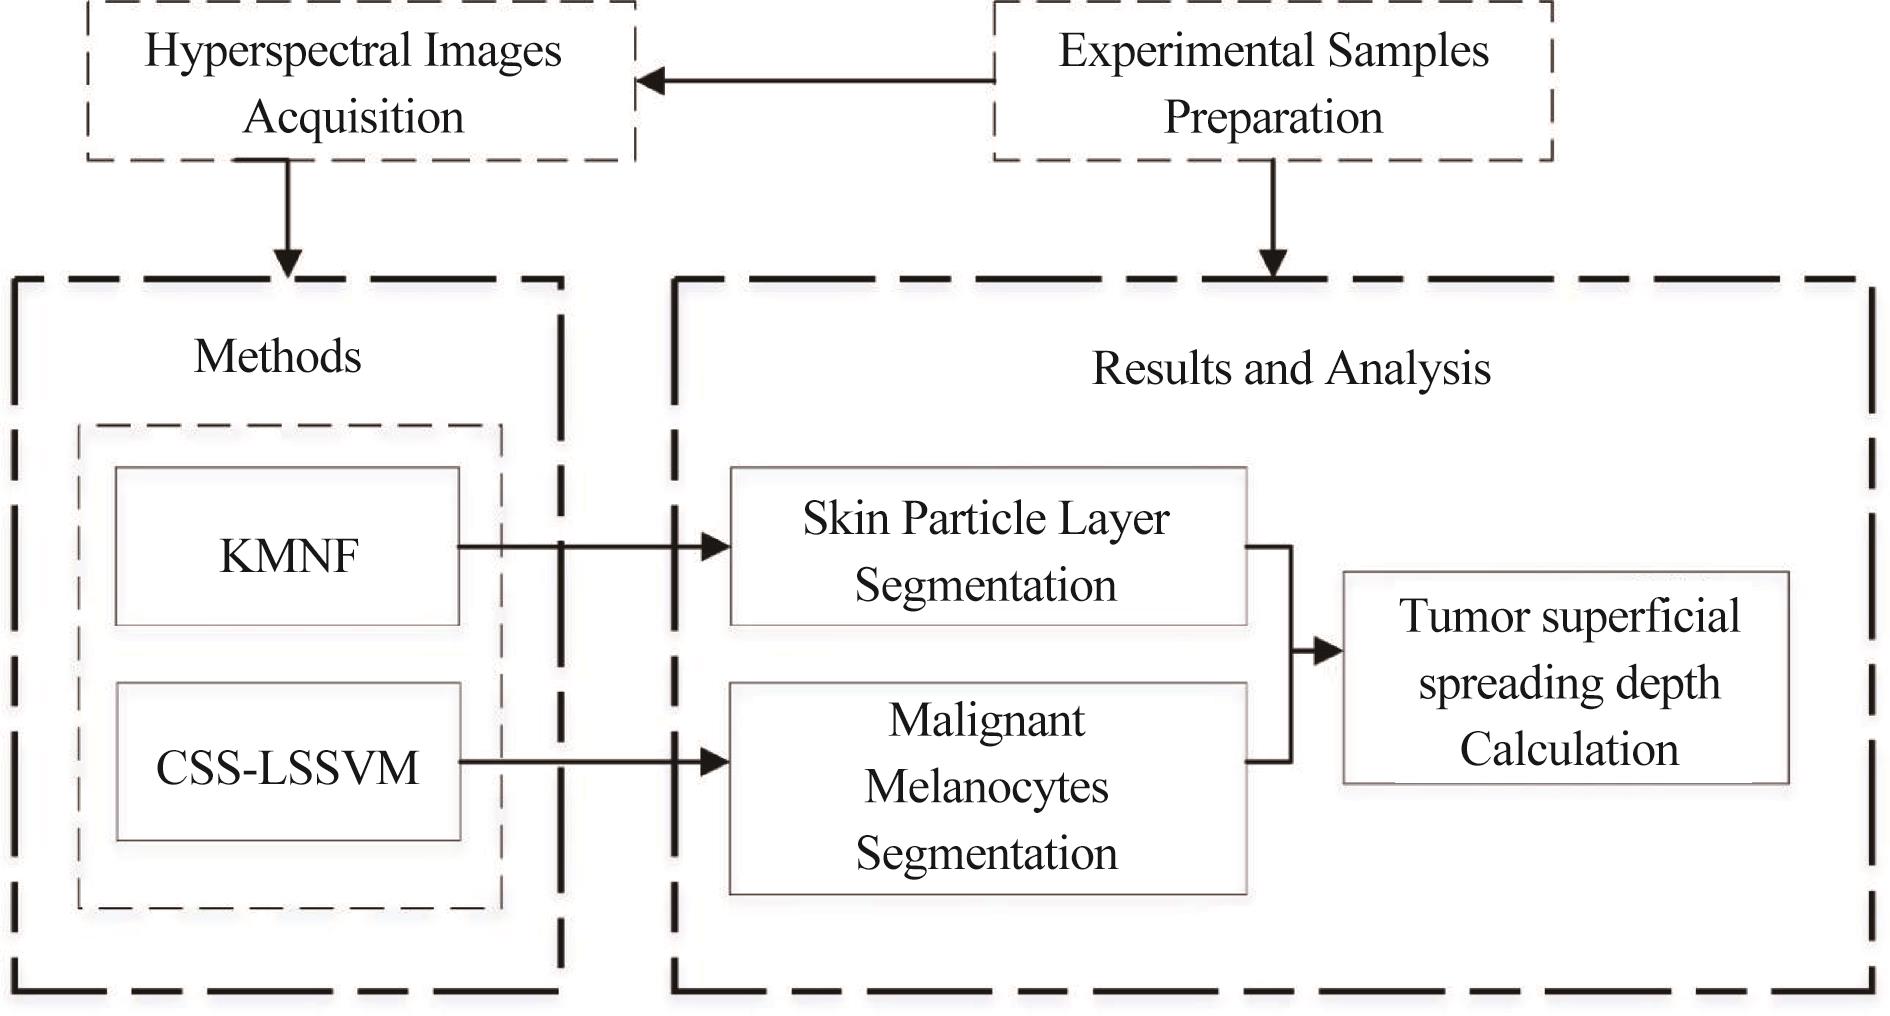
Fig. 1. The main flowchart of the proposed methods
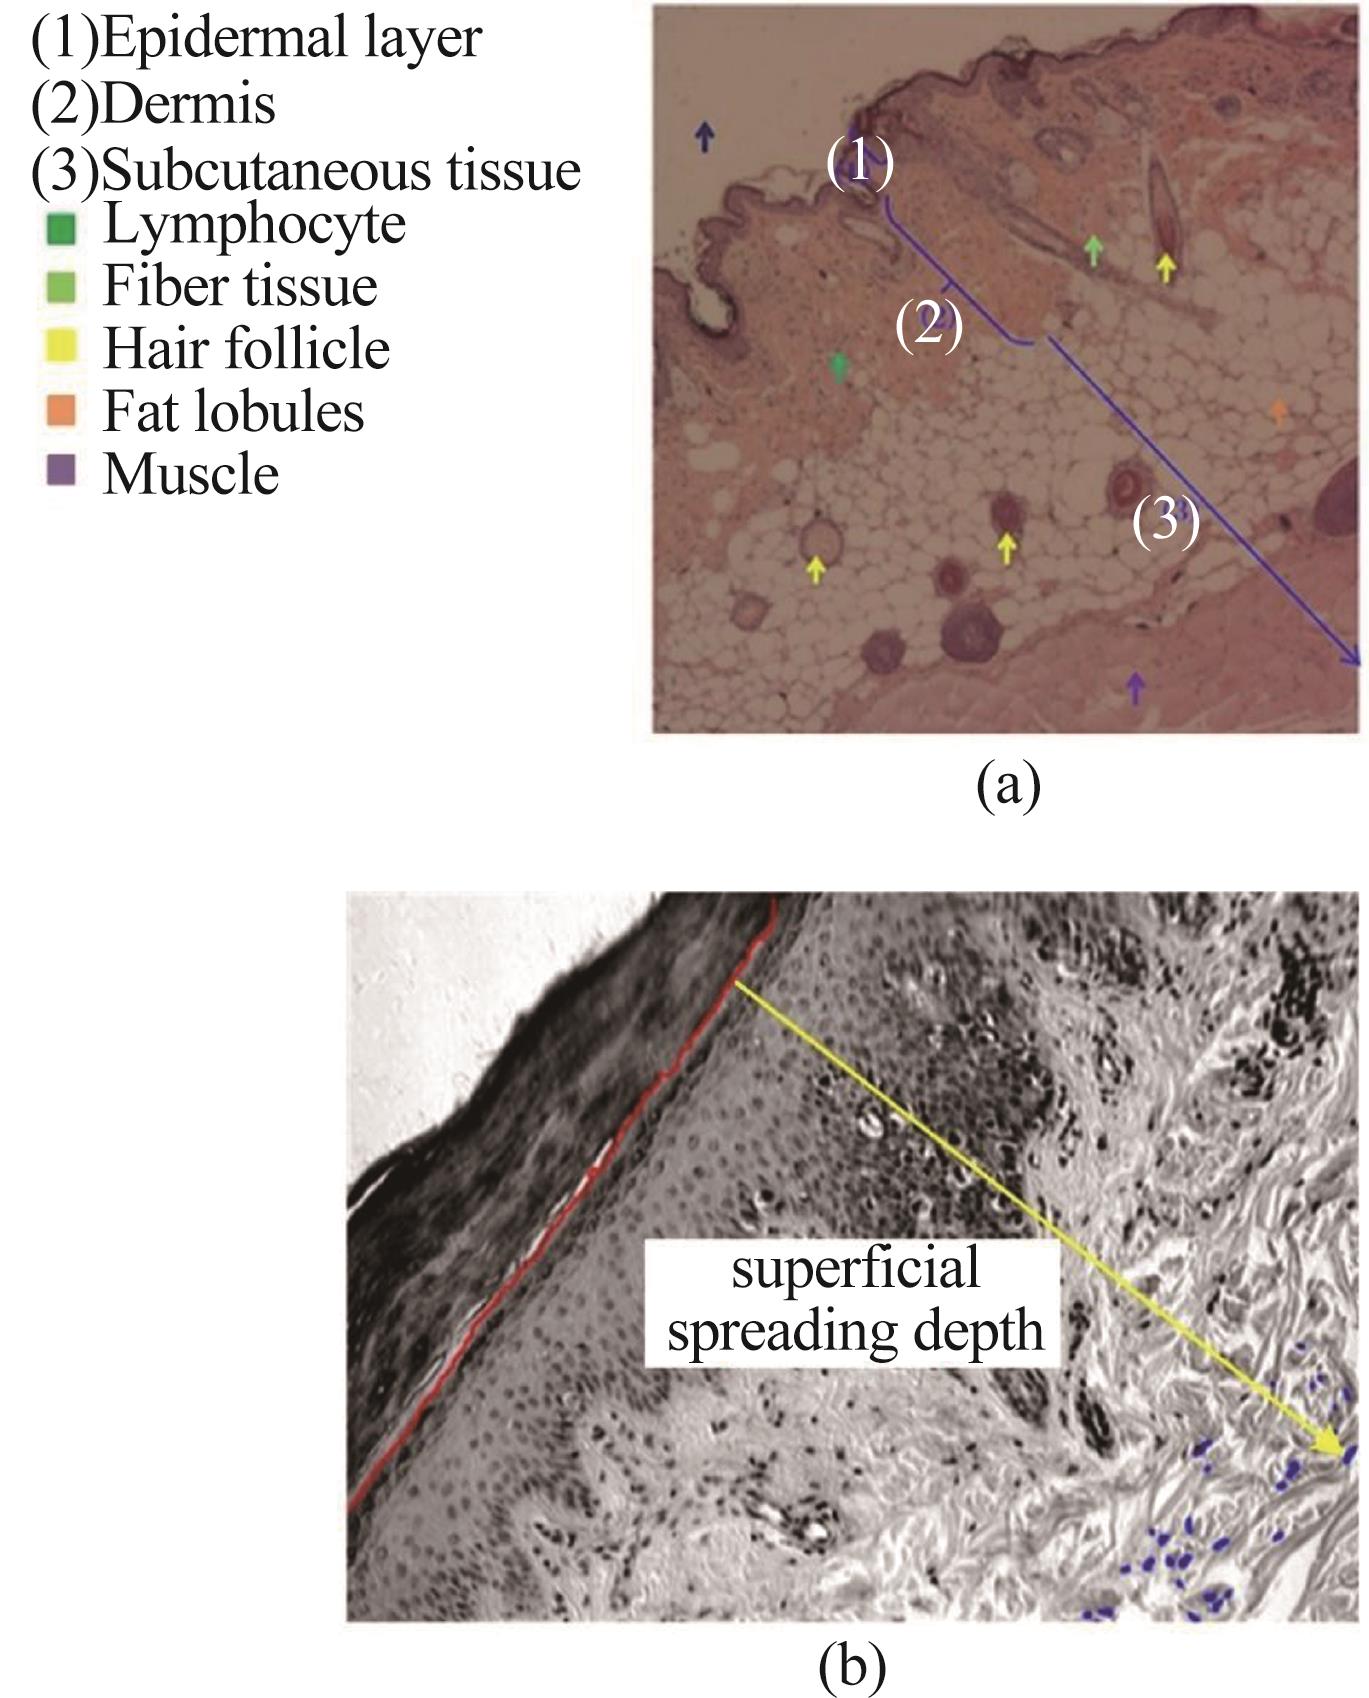
Fig. 2. (a) Normal skin tissue, (b) melanoma sample
Fig. 3. The main schematic and optical path diagram of microscopic hyperspectral imaging system
Fig. 4. (a) Spectrum of a sampling point, (b) the data cube of the cutaneous melanoma, and (c) the single band image
Fig. 5. (a) 100x microscopic image of melanoma sample, (c) 200x image, (b) and (d) Single-band images at 810 nm.
Fig. 6. (a) and (b) Single-band images after preprocessing. (c) and (d) Spectra at the same position before and after processing
Fig. 7. (a) The color microscope image, (b) the single-wavelength hyperspectral image, (c) the KMNF-based result at sixth waveband, (d) the morphological filtering result of skin granular layer, (e) the contour extraction based on level set segmentation, and (f) the finished segmentation result.
Fig. 8. Comparison of granular layer segmentation results of different methods
Fig. 9. (a) A microscope image of malignant melanocytes, (b) the single band image at 810 nm, (c) the SVM segmentation result, and (d) the CSS-LSSVM segmentation result.
Fig. 10. Measurement results of cutaneous melanoma superficial spreading depth.
| |||||||||||||||||||||||||||||||||||||||||||
Table 1. Comparison of malignant melanocytes segmentation results of different methods
| |||||||||||||||||||||||||||||||||
Table 2. Correspondence between pixel size and real physical value of MHSI system

Set citation alerts for the article
Please enter your email address
© Copyright 2018-2021 | Chinese Laser Press. All Rights Reserved 沪ICP备15018463号-20