
Jian-Sheng WANG, Qing-Li LI, Mei ZHOU, Li SUN, Meng-Han HU, Yue LYU, Jun-Hao CHU. Identification and measurement of cutaneous melanoma superficial spreading depth using microscopic hyperspectral imaging technology[J]. Journal of Infrared and Millimeter Waves, 2020, 39(6): 749
- Journal of Infrared and Millimeter Waves
- Vol. 39, Issue 6, 749 (2020)
Abstract
Keywords
Introduction
According to the GLOBOCAN2012 database of World Health Organization (WHO), in 2015, the number of new cases of cutaneous melanomas (CM) worldwide reached 250 178, including 130 800 males and 119 378 females. There were 60 098 global cutaneous melanoma deaths, including 34 143 males and 25 955 females[
Detecting melanoma in skin tissue and determining the size of the lesion area are common diagnostic procedures. Researchers at home and abroad have combined numerous modern optical imaging techniques with image processing methods for medical diagnosis. Innovative approach such as dermoscopy can be well applied clinically[
The medical field recognizes that pathological diagnosis remains the gold standard for complex tumor diagnosis. In the treatment of melanoma, the depth of tumor invasion (DoI), namely Breslow thickness in skin tissue is a crucial prognostic factor [
The application of hyperspectral imaging technology in biomedical imaging points out a new direction for the identification and diagnosis of cutaneous melanoma [
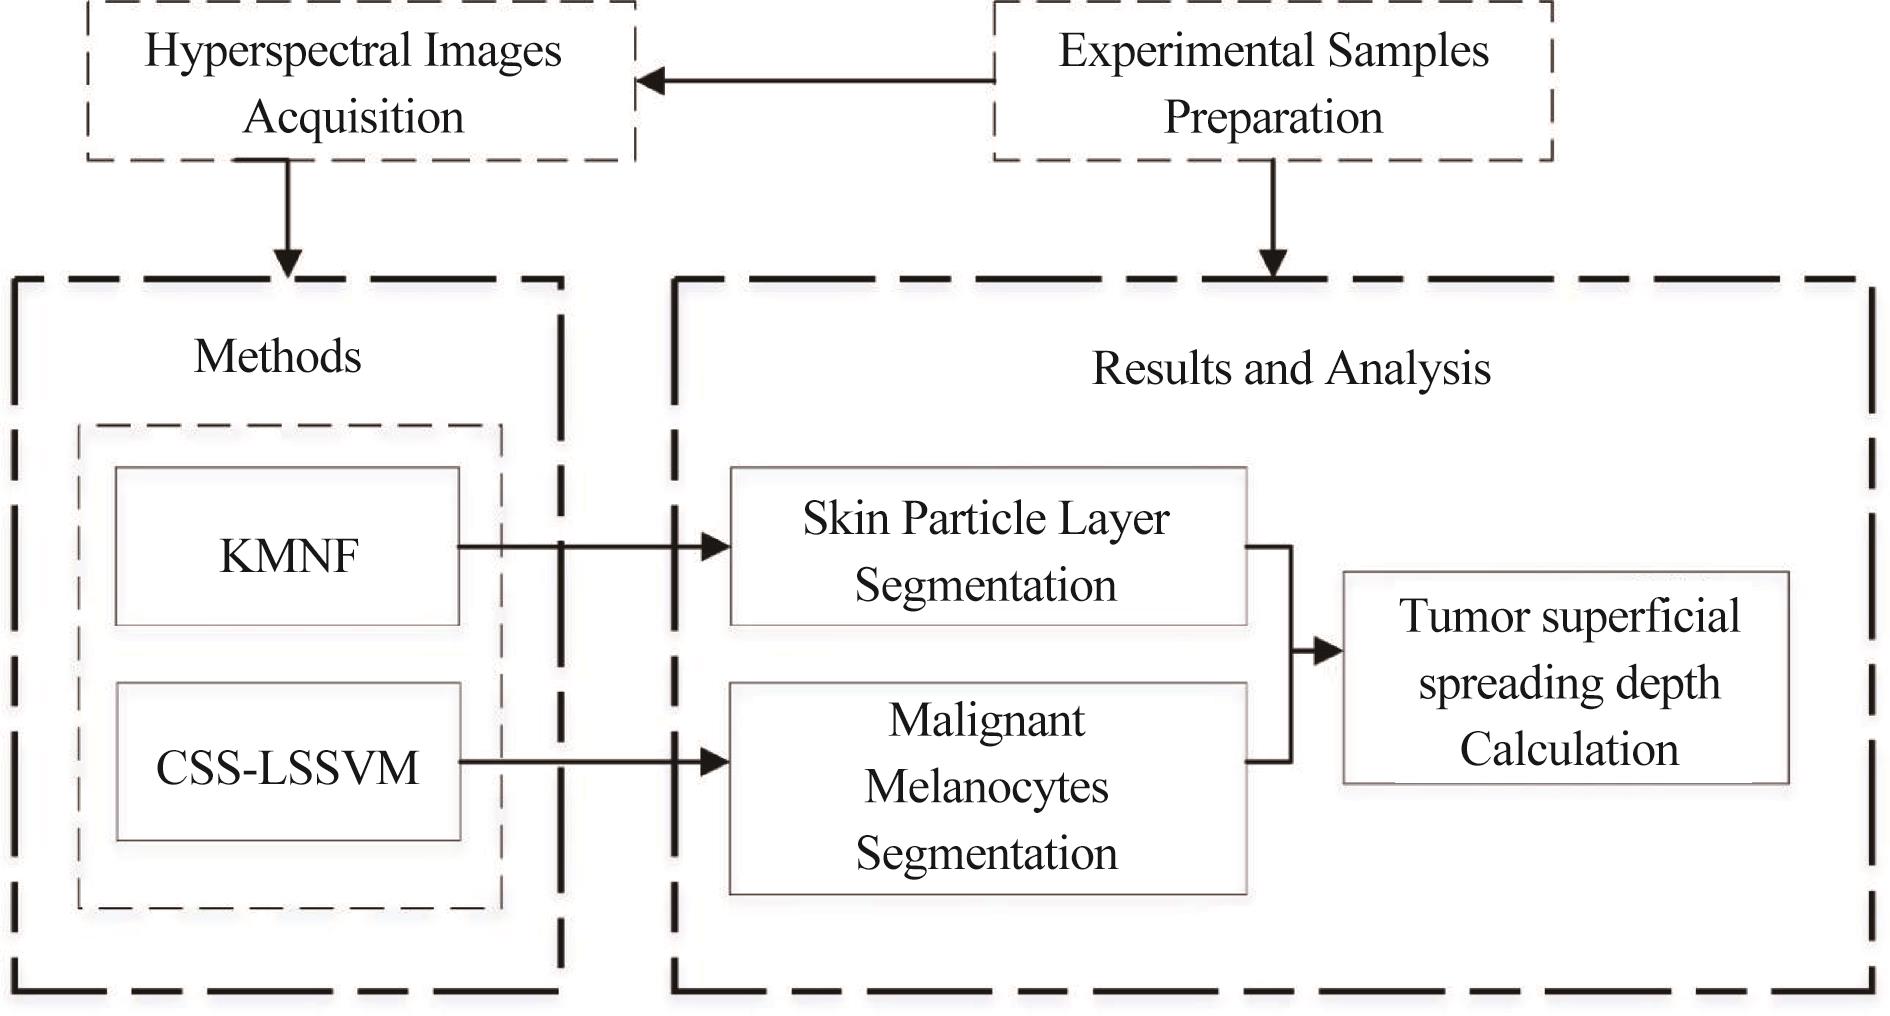
Microscopic hyperspectral imaging (MHSI) technology highlights the abundant spatial and spectral information in the pathological structure of cutaneous melanoma. In this article, to measure the superficial spreading depth of cutaneous melanoma, we use a segmentation approach combined a kernel minimum noise fraction (KMNF) algorithm and two morphological edge detection ways to identify the skin granular layer. Subsequently, a least squares support vector machine based on characteristic spectrum supervision (CSS-LSSVM) segmentation algorithm is applied to separate malignant melanocytes. Comparing the results of different algorithms, our method has realistic significance and may offer a quantitative basis for CM pathological diagnosis.
1 Materials and methods
Hyperspectral images can provide an assessment of tissue pathophysiology based on the spectral characteristics of different tissues[
![]()
Figure 1.The main flowchart of the proposed methods
1.1 Experimental samples
Conventional pathological sections preparation is extremely important in histopathology and is the basis of all pathological analyses. The main steps involved in the production process are tissue sample extraction, fixation, dehydration, waxing, embedding, slicing, baking, dyeing, and sealing [
The structure of skin tissue is complex, and skin melanoma has a wide variety of types. However, under the microscopic field of view, it is not possible to completely contain all the structures of the skin tissue. The cutaneous melanoma samples used in this research are superficial spreading melanoma (SSM). The lesions are mostly in the epidermis and dermis. The lesion boundaries are obvious, and melanocytes are scattered individually or in-cluster in various layers of the epidermis, with few tumor cell nests and no top-to-bottom maturation. Therefore, we define the tumor depth of invasion within the SSM sample as superficial spreading depth in our experiment. As shown in Fig. 2 (b), superficial spreading depth refers to the vertical distance from the outer boundary of skin granular layer to the furthest malignant melanocytes, while the structure of each layer of normal skin tissue is intact (Fig. 2(a)). Due to limitation of the microscopic field of view, the layers of skin tissue under low magnification are comprehensive, but the details of cell tissue cannot be expressed, which is contrary to high magnification. Different acquisition fields of view and magnification are usually chosen for different research purposes. According to the field characteristics of sample and research content, the samples studied in this experiment are 100 times images.
![]()
Figure 2.(a) Normal skin tissue, (b) melanoma sample
1.2 Hyperspectral image acquisition
The microscopic hyperspectral imaging system as shown in Fig.3 combines hyperspectral technology with microscopic imaging technology [
![]()
Figure 3.The main schematic and optical path diagram of microscopic hyperspectral imaging system
In hyperspectral data acquisition, single-wavelength image data are consistent with ordinary two-dimensional image data that contain only spatial information (Fig.4(c)). When acquiring multi-wavelength image data, a plurality of single-wavelength image data are stored together with wavelength information of each pixel (Fig.4(a)) as a hyperspectral image data cube. Figure 4(b) is a data cube of cutaneous melanoma image, containing 60 wavebands of spectral information. Each waveband of the hyperspectral image consists of 1 280 × 1 024 pixels × 16 bits/pixel. Once acquired, the dataset is saved in the band sequential (BSQ) file format.
![]()
Figure 4.(a) Spectrum of a sampling point, (b) the data cube of the cutaneous melanoma, and (c) the single band image
1.3 Spectral calibration and preprocessing
When the MHSI system is collecting image data, changes in external conditions such as illumination intensity, CCD electrical noise, and sample background have a certain impact on the quality of imaged data. Since the absorption characteristics of biological tissues to the spectrum are much smaller than the transmission and reflection characteristics of slide, the unprocessed sample data exhibit similar spectral characteristics in the same wavelength range. The spectral characteristics of target tissue are weakened, which cannot accurately reflect biochemical features of the sample. Hence samples’ spectrum should be corrected first before data processing.
Lambert-Beer's (LB) law [
In this experiment, we simultaneously acquired hyperspectral images of biological tissues and blank areas of the same slides. The transmittance and absorbance of the cutaneous melanoma samples are:
where D(n,m;λ) is the pixel value of the target sample in the nth row and mth column in the λ-th wavelength, B(n,m;λ) is the pixel value of the blank sample corresponding to the target sample, and I(n,m;λ) is the image noise acquired by the objective lens between the light source is turned off and on again. On the one hand, because the parameters of the system hardware are stable, the image noise at each pixel location is consistent. On the other hand, hyperspectral imaging mainly relies on spectral characteristics for tissue classification. Previous study has shown that spectral characteristics of the stain are fixed, and the difference in staining basically does not affect the spectral characteristics of biological tissues[
1.4 Skin granular layer segmentation
The purpose of this section is to achieve segmentation of the skin granular layer. In H&E-staining pathological images, the limitation of RGB information makes it difficult to distinguish different tissues with extremely high similarity. However, in microscopic hyperspectral images, the spectral characteristics of granular layer are different from other tissues. We utilized a KMNF and morphological filtering segmentation method to provide an accurate starting boundary for the calculation of melanoma superficial spreading depth.
Minimum noise fraction (MNF) [
KMNF [
After linearization, the MNF maximization is:
If a hyperspectral image is regarded as a data set of n pixels and p spectral bands, then PT is a matrix of n times p, and PnT is a similar matrix of noise. Let L be equal to , then the dual mode of MNF is:
Let a map of be Rn, then the maximization of KMNF is
where
KMNF retains nonlinear characteristics of hyperspectral data effectively. In cutaneous melanoma samples, the granular layer exhibits a black band in hyperspectral grayscale image. The next step is to extract main morphology of the granular layer by morphological filtering. A conventional morphological operator is an N by N (N=3,5,7...) square filter. In this section, in order to better adapt to the shape of the skin granular layer, a multi-size filter operator tending to the diamond shape is designed. We mixed three kinds of filter operators to achieve better morphological extraction results. Namely, the skin granular layer uses a 3 by 3 template, the epidermis layer except the granular layer adopts a 5 by 5 template, and the irregularly shaped fiber structure and malignant melanocytes employ a 7 by 7 template.
The skin granular layer is generally used as starting boundary for the measurement of skin melanoma superficial spreading depth [
We studied the image contour extraction method based on level set segmentation [
1.5 Malignant melanocytes segmentation
In pathological diagnosis of cutaneous melanoma, the morphology and distribution of malignant melanocytes are one of the main diagnostic criteria. It is also the termination boundary for calculating melanoma superficial spreading depth. In this research, we utilized the least squares support vector machine method based on characteristic spectrum supervision to segment melanocytes.
The least squares support vector machine (LSSVM) is an improved data mining-based machine learning method [
The least squares support vector machine based on characteristic spectrum supervision (CSS-LSSVM) segmentation method add characteristic spectra of the target to match in the LSSVM model and segment the LSSVM results again to achieve higher accuracy. The matching way calculates spectral similarity between melanocytes and the pixel of segmentation image one by one and determine the type of the segmented pixel. A spectral angle matching method is typically used for evaluation of spectral similarity. It is known that the number of wavelengths of experimental sample is λ, the spectral characteristic of a single pixel is X=[x1,x2,···,xλ], and the characteristic spectra of the melanocytes are X’=[x’1,x’2,···,x’λ], then the spectral similarity [
The threshold α is usually set artificially, beyond which it is considered not to be a homogeneous biological tissue. The CSS-LSSVM segmentation method includes the following steps:
1) The spectra of region of interest (ROI) are selected as the training set.
2) A feature spectrum library is constructed, and the average spectrum of a plurality of adjacent pixels in the target region is taken as a characteristic spectrum.
3) The ROI data set is trained to establish LSSVM classification model.
The spectra of remaining pixels are sequentially inputted to the LSSVM model. If the model output is determined to be the target class, output is the target class; if not, the pixel’s spectrum is matched with the feature spectral library. If the matching result is a target class, it is determined to be the target class, otherwise, it is not.
1.6 Measurement of melanoma superficial spreading depth
The samples used in this section are magnified 100-fold images of cutaneous melanoma, as they contain both granular layers and melanocytes in the field of view. The boundary of granular layers is divided into an inner boundary (near the dermal layer portion) and an outer boundary (near the stratum corneum portion), and the outer boundary is calculated for superficial spreading depth. For the malignant melanocytes in the samples, the data of the nearer melanocytes are removed with reference to the slope of the outer boundary of granular layer, and the farthest data are retained.
Let the set of outer boundary curve points of the granular layer be D(Φi(x,y)|i∈1,2,···,p), and p is the number of pixels of the outer boundary curve. Let the set of malignant melanocyte boundary points be M(Γi(x,y)|j∈1,2,···,q), q is the number of pixels of malignant melanocytes border. The procedures for calculating superficial spreading depth of skin melanoma are:
1) Since the distance between adjacent pixels is small, in order to reduce the amount of calculation, the curves D and M are resampled. Let the pixel points of sampling distance be d, and the symbol ∟ indicates rounding down. The boundary sets of granular layer and malignant melanocytes are respectively expressed as:
2) Let Ekbe a set of coordinate pairs, and the ith point in the set Md is Φi. Calculating the distance between Φi and each point in the set Ddin turn, and Ek records the point with the smallest distance, ie:
where ||•|| represents the Euclidean distance between two points, and the coordinate pair indicates the point at which the malignant melanocytes are furthest from granular layer.
3) To improve the accuracy of the tumor superficial spreading depth calculation results, the maximum of the neighborhood is solved by the maximum distance of the previous step. Let Deep be the depth of melanoma, then:
2 Results and discussions
2.1 Melanoma images and preprocessing results
We operated the microscopic hyperspectral imaging system to capture images of cutaneous melanoma samples at different magnifications. A magnified 100x image contained epidermal layer is displayed in Figs.5(a-b). The color image Fig.5(a) is ordinary microscopic result and Fig.5(b) is a single-wavelength hyperspectral image at 810nm. In Fig.5(a), (1) is the entire layer of the epidermis layer, (2) is the stratum corneum, and (3) is the granular layer. From the viewpoint of skin histology, the skin granular layer is located between the stratum corneum and the spinous layer. In the images, the orange arrows point to the blank area of the sample, the red arrows point to the malignant melanocytes, the green arrows point to normal tissue of the epidermis, and the yellow arrows point to fibrous tissue of the dermis. Malignant melanocytes are irregularly distributed in the dermis and epidermal basal layers. As the magnification increases in Figs.5(c-d), images magnified 200x mainly contains malignant melanocytes in the lesion area. The nucleus and cytoplasm of melanocytes are obvious, and the morphology is clearer. Similar to Fig.5(a), the blue arrows in Fig.5(c) point to blood vessel in the center, showing that malignant melanocytes are distributed around the blood vessels and begin to invade inward.
![]()
Figure 5.(a) 100x microscopic image of melanoma sample, (c) 200x image, (b) and (d) Single-band images at 810 nm.
After spectral calibration of hyperspectral image, the spectral differences of various pathological tissue components can be relatively truly reflected. Figure 6 is an example of a cutaneous melanoma sample at 200x magnification. The field of view mainly includes the tumor areas and normal fibrous tissues, and the spectra of four regions are selected and compared. Figure 6(a) is a single-wavelength hyperspectral image with a wavelength of 810 nm, and (b) is an enlargement of the red partial region in (a), wherein the red curve is the nucleus of the malignant melanocytes, the blue curve is the tissue of the lesion region, the orange curve is a blank area of the slide covered by no skin tissue, and the green curve is normal fibrous tissue. Figure 6(c) is the untreated spectra corresponding to the four regions. It can be seen that the spectral characteristics of each type of tissue are similar. As the wavelength increases, significant peaks and troughs appear at the same wavelength, there are only some differences in the range of values. The corrected spectral data are shown in Fig.6(d), and the spectral transmittance of melanocytes is the lowest. The abundant spectral properties of melanoma samples are a powerful basis for subsequent biological tissue segmentation.
![]()
Figure 6.(a) and (b) Single-band images after preprocessing. (c) and (d) Spectra at the same position before and after processing
2.2 Granular layer segmentation
The skin melanoma samples used in the experiment are thick in stratum corneum and have no distinct boundary with granular layer. It is almost difficult to identify and segment the granular layer based on common pathological images. Combining the spectral information and spatial information of hyperspectral images, we used the KMNF algorithm to focus the spectral features of image to the first few wavebands and reduce the image noise. The segmentation process of skin granular layer is demonstrated in Fig.7. Figure 7(b) is still the hyperspectral imaging result with a wavelength of 810 nm. The sixth waveband result obtained after KMNF treatment on the experimental sample is shown in Fig.7(c). The white area in Fig.7(d) is the granular layer, which is the result of morphological filtering and identifying the largest connected domain. The contour of the skin granular layer is screened by the level set segmentation algorithm. The contour result (e) is superimposed with the original hyperspectral image field of view (b), and Fig.7(f) is the final segmentation result. Combined with the pathological characteristics of the skin granular layer, the KMNF-based segmentation results are basically consistent with the actual contour.
![]()
Figure 7.(a) The color microscope image, (b) the single-wavelength hyperspectral image, (c) the KMNF-based result at sixth waveband, (d) the morphological filtering result of skin granular layer, (e) the contour extraction based on level set segmentation, and (f) the finished segmentation result.
In this part, three methods for feature extraction of hyperspectral images are studied, and some samples are employed for experiments. Fig.8 shows the comparison results of three methods of PCA (principal component analysis), MNF, and KMNF. Based on the negative and positive results of disease detection, we introduced a confusion matrix to calculate the accuracy of the algorithms. The accuracy indicates the ability of algorithms to correctly classify the target and non-target for the whole sample. For all test samples, the accuracy of the KMNF-based segmentation method can reach more than 80%, which is higher than the other two algorithms. This method provides a relatively more accurate boundary for the calculation of skin superficial spreading depth. However, it must be acknowledged that the segmentation results of this algorithm depend on the complexity of the cutaneous melanoma samples. The improvement of the algorithm is one of our future research contents.
![]()
Figure 8.Comparison of granular layer segmentation results of different methods
2.3 Malignant melanocytes segmentation
Skin melanoma is derived from the cancerization of melanocytes. Therefore, malignant melanocytes are the key targets in the diagnosis of cutaneous melanoma. Under the microscopic field of H&E staining samples (Fig. 9(a)), malignant melanocytes have diversified morphological features, and there are subjective errors in human eye observation, which is time consuming and increases the difficulty in rapid pathological diagnosis of cutaneous melanoma. We added a melanocyte characteristic spectral library and used spectral information to assist the least squares support vector machine for segmentation. The malignant melanocyte recognition results are shown in Fig.9. The CSS-LSSVM segmentation method (Fig.9(d)) can identify more cell regions than the SVM segmentation method (Fig.9(c)).
![]()
Figure 9.(a) A microscope image of malignant melanocytes, (b) the single band image at 810 nm, (c) the SVM segmentation result, and (d) the CSS-LSSVM segmentation result.
The results of quantitative analysis of four samples are listed in Table 1. In addition to accuracy, the other two commonly used evaluation parameters are sensitivity and specificity. The sensitivity indicates the ratio of correct judgment of the algorithm to the total positive sample; the specificity indicates the ratio of negative sample prediction result to the actual negative sample.
| 1 | 2 | 3 | 4 | ||
|---|---|---|---|---|---|
| Accuracy | SVM | 68.60 | 79.34 | 77.25 | 78.48 |
| CSS-LSSVM | 86.02 | 87.49 | 86.02 | 86.85 | |
| Sensitivity | SVM | 38.05 | 60.04 | 56.50 | 58.32 |
| CSS-LSSVM | 77.91 | 79.33 | 76.72 | 76.54 | |
| Specificity | SVM | 99.15 | 98.64 | 98.01 | 98.64 |
| CSS-LSSVM | 94.13 | 95.66 | 95.33 | 97.15 | |
Table 1. Comparison of malignant melanocytes segmentation results of different methods
The CSS-LSSVM algorithm has higher segmentation accuracy than the SVM for malignant melanocytes in the samples and can reach more than 85%. Referring to Table 1, the sensitivity of the CSS-LSSVM algorithm is higher than that of the SVM, namely, the probability that the CSS-LSSVM can detect malignant melanocytes is higher. The increase in sensitivity tends to reduce specificity. The specificity of the CSS-LSSVM algorithm in the four samples is lower than that of the SVM, which means the probability that the CSS-LSSVM can detect non-malignant melanocytes is lower. It can be seen that CSS-LSSVM may misidentify a few non-malignant melanocytes while recognizing more malignant melanocytes. However, in view of melanoma is highly metastatic, in diagnosis of cutaneous melanoma, leakage recognition of malignant melanocytes may lead to cancer cell metastasis, which greatly affects the survival rate of patients. In consequence, compared with SVM segmentation method, the CSS-LSSVM segmentation method is more suitable as a recognition algorithm for malignant melanocytes.
2.4 Melanoma superficial spreading depth measurement
Surgical treatment is one of the most effective and preferred treatment methods for cutaneous melanoma. It is to prevent the spread of the tumor by resection of the primary lesion. Whether the resection of the primary lesion is complete is also a direct factor affecting the prognosis. The most important thing in surgical treatment is to determine the boundaries of the tumor. We adopted the CSS-LSSVM algorithm to segment the malignant melanocytes in 100-fold amplified samples, and extracted the skin granular layer structure based on the KMNF algorithm, and retained the outer boundary. During the measurement, the calculated superficial spreading depth denotes the farthest distance between the malignant melanocytes and the granular layer. The yellow arrows in Fig. 10 are the melanoma superficial spreading depth automatically calculated by the computer.
![]()
Figure 10.Measurement results of cutaneous melanoma superficial spreading depth.
Since the superficial spreading depth is calculated based on pixels, in order to obtain the true physical value corresponding to the pixel size of the image, we conducted the following experiments: at different microscope magnifications, an objective lens calibration ruler was moved to count the distance of pixels in the image. The results are shown in Table 2. It shows that under the same objective magnification, the moving distance of pixels and the scale have a linear growth relationship; under the same scale, the moving distance of the pixel and the objective multiple also have a linear growth relationship. From this, the conversion coefficient between the image size of the pixel and its true physical value at different objective magnifications can be calculated. The experimental data in this paper were collected under the 10x objective lens, hence the conversion coefficient 2 243 (pixel / mm) was selected to measure the true value corresponding to the morphological characteristics. For a sample (a), the superficial spreading depth is 1 379.5 pixels, approximate 0.61 mm.
| Objective multiple | Scale distance | Conversion coefficient(pixel/mm) | ||||
|---|---|---|---|---|---|---|
| 0.01 mm | 0.02 mm | 0.05 mm | 0.1 mm | 0.2 mm | ||
| 4x | 9.51 | 17.85 | 44.70 | 89.05 | 177.11 | 902 |
| 10x | 23.37 | 45.04 | 110.432 | 220.53 | 442.57 | 2243 |
| 20x | 46.03 | 91.61 | 222.09 | 448.29 | 891.02 | 4512 |
Table 2. Correspondence between pixel size and real physical value of MHSI system
To evaluate the depth measurement, we compared the melanoma sample with normal skin tissue, as shown in the Fig.2. Fig.2(b) shows that malignant melanocytes have been produced in the dermis layer. Tumor pathology grading is the key basis for treatment. In the clinical diagnosis of melanoma, Clack level [
The results show the distribution and spread of malignant melanocytes of superficial spreading melanoma. If patients are not treated in time, tumor deterioration and metastasis are likely to occur. we expect to provide a new technique to assist pathological diagnosis. The method proposed in this article is also applicable to advanced skin melanoma samples. However, due to the complexity of the melanoma samples, the morphological and spectral similarity of individual lymphocytes and malignant melanocytes in the melanoma sample may affect the accuracy of identification.
3 Conclusions
In view of the problem that the traditional pathological diagnosis of cutaneous melanoma cannot quantitatively analyze the tumor tissue, this paper applied microscopic hyperspectral imaging technology to identify and analyze melanoma superficial spreading depth. First, we segmented skin granular layer. Three multi-scale morphological filter operators were designed to extract the main morphological features, and the level set segmentation algorithm was used to obtain the contour of granular layer. By comparing PCA, MNF, and KMNF, the experimental results show that the KMNF-based algorithm has a segmentation accuracy of more than 80%. Second, we explored the segmentation of the malignant melanocytes. After adding the characteristic spectrum supervision of malignant melanocytes, the segmentation accuracy of the LSSVM is greater than 85%, which is better than the SVM algorithm. Finally, on the basis of the above researches, the superficial spreading depth of melanoma was quantitatively calculated. We consider that there is room for improvement in this study. Using microscopic hyperspectral imaging technology to identify and analyze superficial spreading melanoma samples is still a preliminary test, and the experimental results indicate the feasibility of this method. We have found that the thickness of granular layer in different samples is not exactly the same, and the adaptive ability of the filter operator in the experiment is insufficient. Further, we intend to verify on a large number of complex samples, so as to achieve the flexibility of MHSI technology for pathological diagnosis. Improving the accuracy of segmentation and measurement is also the direction of our efforts to developing method.
References
[1] J Ferlay, I Soerjomataram, R Dikshit. Cancer incidence and mortality worldwide: Sources, methods and major patterns in GLOBOCAN 2012. International Journal of Cancer, 136, E359-E386(2015).
[2] F Erdmann, J Lortet-Tieulent, J Schuz. International trends in the incidence of malignant melanoma 1953-2008uare recent generations at higher or lower risk?. International Journal of Cancer, 132, 385-400(2013).
[3] V Gray-Schopfer, C Wellbrock, R Marais. Melanoma biology and new targeted therapy. Nature, 445, 851-857(2007).
[4] A M M Eggermont, V Chiarion-Sileni, J J Grob. Prolonged Survival in Stage III Melanoma with Ipilimumab Adjuvant Therapy. New England Journal of Medicine, 375, 1845-1855(2016).
[5] C Garbe, K Peris, A Hauschild. Diagnosis and treatment of melanoma. European consensus-based interdisciplinary guideline - Update 2016. European Journal of Cancer, 63, 201-217(2016).
[6] L Thomas, S Puig. Dermoscopy, Digital Dermoscopy and Other Diagnostic Tools in the Early Detection of Melanoma and Follow-up of High-risk Skin Cancer Patients. Acta Dermato-Venereologica, 97, 14-21(2017).
[7] L Q Yu, H Chen, Q Dou. Automated Melanoma Recognition in Dermoscopy Images via Very Deep Residual Networks. Ieee Transactions on Medical Imaging, 36, 994-1004(2017).
[8] T Wang, G Hou, N Zhang. Melanoma Computer-aided Diagnosis Algorithms Based on Laser Scanning Confocal Microscope Images. Chinese Journal of Medical Imaging, 21, 130-133(2013).
[9] M Rastrelli, S Tropea, C R Rossi. Melanoma: Epidemiology, Risk Factors, Pathogenesis, Diagnosis and Classification. In Vivo, 28, 1005-1011(2014).
[10] M Silveira, J C Nascimento, J S Marques. Comparison of Segmentation Methods for Melanoma Diagnosis in Dermoscopy Images. Ieee Journal of Selected Topics in Signal Processing, 3, 35-45(2009).
[11] M Binder, M Schwarz, A Winkler. Epiluminescence microscopy: A useful tool for the diagnosis of pigmented skin lesions for formally trained dermatologists. Archives of Dermatology, 131, 286-291(1995).
[12] C Garbe, U Leiter. Melanoma epidemiology and trends. Clinics in Dermatology, 27, 3-9(2009).
[13] R M MacKie, M Dunitz. Skin cancer : an illustrated guide to the aetiology. pathology and management of benign and malignant cutaneous tumours(1989).
[14] M Mokhtari, M Rezaeian, S Gharibzadeh. Computer aided measurement of melanoma depth of invasion in microscopic images. Micron, 61, 40-48(2014).
[15] N Noroozi, A Zakerolhosseini. Computerized measurement of melanocytic tumor depth in skin histopathological images. Micron, 77, 44-56(2015).
[16] X Hongming, W Huiquan, R Berendt. Computerized measurement of melanoma depth of invasion in skin biopsy images. 2017 IEEE EMBS International Conference on Biomedical & Health Informatics (BHI), 17-20(2017).
[17] M S Dinehart, S M Dinehart, S Sukpraprut-Braaten. Immunohistochemistry utilization in the diagnosis of melanoma. Journal of cutaneous pathology(2020).
[18] K Kamyab-Hesary, A Ghanadan, K Balighi. Immunohistochemical Staining in the Assessment of Melanoma Tumor Thickness. Pathology oncology research : POR(2019).
[19] 19ChopraA, SharmaR, RaoU N M. Pathology of Melanoma [J]. Surgical Clinics of North America, 2020, 100(1): 43-+.
[20] G N Stamatas, C J Balas, N Kollias. Hyperspectral image acquisition and analysis of skin. Proceedings of the SPIE - The International Society for Optical Engineering, 4959, 77-82(2003).
[21] T Nagaoka, A Nakamura, H Okutani. A possible melanoma discrimination index based on hyperspectral data: a pilot study. Skin Research and Technology, 18, 301-310(2012).
[22] V Zheludev, I Polonen, N Neittaanmaki-Perttu. Delineation of malignant skin tumors by hyperspectral imaging using diffusion maps dimensionality reduction. Biomedical Signal Processing and Control, 16, 48-60(2015).
[23] A Pardo, J A Gutierrez-Gutierrez, I Lihacova. On the spectral signature of melanoma: a non-parametric classification framework for cancer detection in hyperspectral imaging of melanocytic lesions. Biomedical Optics Express, 9, 6283-6301(2018).
[24] A M Hosking, B J Coakley, D Chang. Hyperspectral imaging in automated digital dermoscopy screening for melanoma. Lasers in Surgery and Medicine, 51, 214-222(2019).
[25] S V Panasyuk, S Yang, D V Faller. Medical hyperspectral imaging to facilitate residual tumor identification during surgery. Cancer Biology & Therapy, 6, 439-446(2007).
[26] J S Wang, Q L Li. Quantitative analysis of liver tumors at different stages using microscopic hyperspectral imaging technology. Journal of Biomedical Optics, 23(2018).
[27] G Zonios, L T Perelman, V M Backman. Diffuse reflectance spectroscopy of human adenomatous colon polyps in vivo. Applied Optics, 38, 6628-6637(1999).
[28] S He, H Chen, F Jiao. Improved Preparation Method for Animal Histopathological Section. Progress in Veterinary Medicine, 32, 130-132(2011).
[29] Q L Li, D R Xu, X F He. AOTF based molecular hyperspectral imaging system and its applications on nerve morphometry. Applied Optics, 52, 3891-3901(2013).
[30] Q L Li, M Zhou, H Y Liu. Red Blood Cell Count Automation Using Microscopic Hyperspectral Imaging Technology. Applied Spectroscopy, 69, 1372-1380(2015).
[31] Q L Li, Y T Wang, H Y Liu. A combined spatial-spectral method for automated white blood cells segmentation. Optics and Laser Technology, 54, 225-231(2013).
[32] M L Huebschman, R A Schultz, H R Garner. Characteristics and capabilities of the Hyperspectral Imaging Microscope. Ieee Engineering in Medicine and Biology Magazine, 21, 104-117(2002).
[33] A A Green, M Berman, P Switzer. A transformation for ordering multispectral data in terms of image quality with implications for noise removal. IEEE Transactions on Geoscience and Remote Sensing, 26, 65-74(1988).
[34] L L Randeberg, E L Larsen, L O Svaasand. Characterization of vascular structures and skin bruises using hyperspectral imaging, image analysis and diffusion theory. Journal of Biophotonics, 3, 53-65(2010).
[35] A A Nielsen. Kernel Maximum Autocorrelation Factor and Minimum Noise Fraction Transformations. Ieee Transactions on Image Processing, 20, 612-624(2011).
[36] X Yang, X B Gao, D C Tao. An Efficient MRF Embedded Level Set Method for Image Segmentation. Ieee Transactions on Image Processing, 24, 9-21(2015).
[37] B Wang, J Li, X Gao. An Edge-and Region-Based Level Set Method with Shape Priors for Image Segmentation. Chinese Journal of Computers, 35, 1067-1072(2012).
[38] T F Chan, L A Vese. Active contours without edges. Ieee Transactions on Image Processing, 10, 266-277(2001).
[39] B J de Kruif, T J A de Vries. Pruning error minimization in least squares support vector machines. Ieee Transactions on Neural Networks, 14, 696-702(2003).
[40] D T Bui, T A Tuan, N D Hoang. Spatial prediction of rainfall-induced landslides for the Lao Cai area (Vietnam) using a hybrid intelligent approach of least squares support vector machines inference model and artificial bee colony optimization. Landslides, 14, 447-458(2017).
[41] C-x Dong, X Rao, S-q Yang. Research on estimating the generalization performance of RBF-SVM. Journal of Xidian University, 31, 557-561(2004).
[42] X Wei, X Yu, Q Fu. Spectral Matching Classification Approach and Experiment Combined with Spectral Angle Cosine and Spectral Correlation Coefficient. Geography and Geo-information Science, 32, 29-33(2016).
[43] J G Elmore, R L Barnhill, D E Elder. Pathologists' diagnosis of invasive melanoma and melanocytic proliferations: observer accuracy and reproducibility study. Bmj-British Medical Journal, 357, 11(2017).

Set citation alerts for the article
Please enter your email address
© Copyright 2018-2021 | Chinese Laser Press. All Rights Reserved 沪ICP备15018463号-20