Author Affiliations
1The Chinese University of Hong Kong, Department of Electronic Engineering, Shatin, Hong Kong SAR, China2University of Science and Technology of China, CAS Key Laboratory of Quantum Information, Hefei, China3University of Science and Technology of China, CAS Center for Excellence in Quantum Information and Quantum Physics, Hefei, Chinashow less
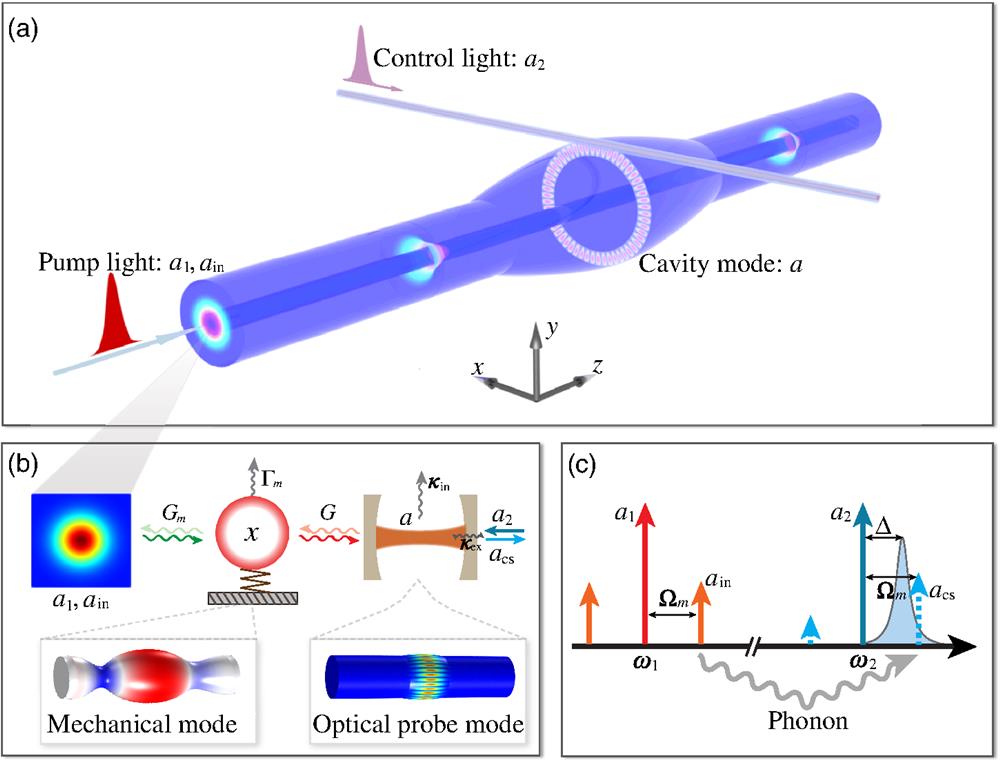
Fig. 1. Concept of coherent wavelength conversion with a fiber-based optomechanical system. (a) Schematic of the coherent wavelength conversion process. A pump beam propagating in the fiber core exerts an optical force in the transverse () direction to excite the mechanical motion. The mechanical motion modulates a probe field traveling in the fiber cladding in the transverse plane to generate an optical field of new wavelength. (b) Diagram of the coherent wavelength conversion from a longitudinally propagating Gaussian mode to a transversely resonating cavity mode. The single-pass pump field (control: , signal: ) and probe cavity mode () are coupled to the same mechanical mode () with coupling rates and , respectively. A control mode is coupled into the cavity with coupling rate . The intrinsic damping rates of the optical probe mode and the mechanical mode are and , respectively. Shown at the bottom left is the simulated displacement field of a mechanical RCM. Shown at the bottom right is the simulated optical probe field in a whispering-gallery mode traveling in the fiber cladding. (c) Schematic showing the relevant optical frequencies involved in the wavelength conversion process. The information carried in is coherently transferred through optomechanical interaction to a new frequency .
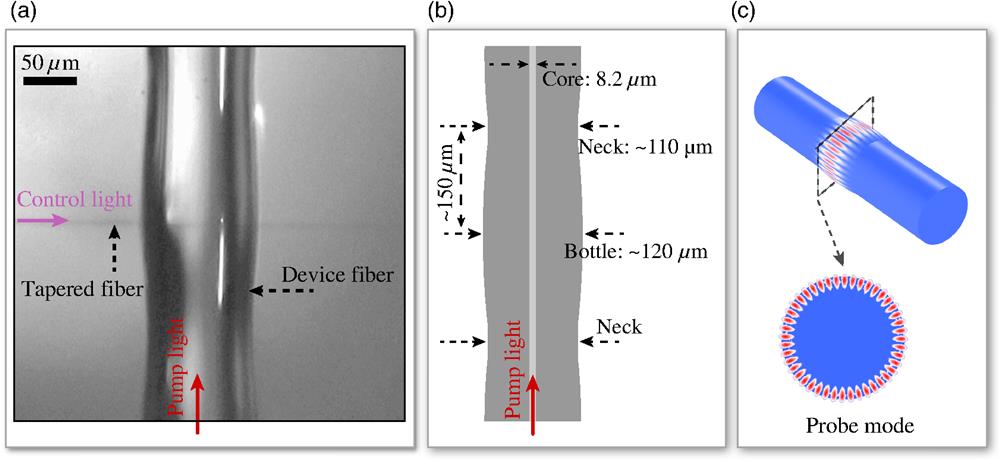
Fig. 2. Configuration and geometry of the device used in experiment. (a) Optical microscope image of the microbottle part of the fabricated device fiber and the tapered fiber. The pump light propagating in the core of the device fiber is used to actuate the mechanical modes of the microbottle cavity. (b) Geometry of the fabricated device fiber in (a). At the two neck positions, the size of the fiber cladding is reduced by laser fusing to create a microbottle-like cavity in the middle. (c) Illustration of the optical probe mode supported by the microbottle cavity, which can be modulated by the actuated mechanical motion. The probe mode is accessed by the probe light propagating in the tapered fiber in (a), which is evanescently coupled with the microbottle cavity.
Fig. 3. Experimental demonstration of broadband coherent wavelength conversion. (a) Experimental setup. A pump laser field (frequency 193.4 THz) was intensity-modulated to generate an input signal . A probe control laser field was sent via a tapered fiber into the microbottle cavity, which was modulated by the mechanical motion of the fiber to produce a new converted signal . DUT, device under test; IM, intensity modulator; EDFA, erbium-doped fiber amplifier; FPC, fiber polarization controller; OS, oscilloscope; PD, photodetector; RFA, radio-frequency amplifier; VNA, vector network analyzer. (b) Optical transmission spectrum of the probe light showing a resonance with an optical quality factor of at 193.03 THz. (c) Measured spectrum showing the mechanical driven response. This spectrum provides the relative strength of the converted signal through optomechanical interaction. (d) Measured relative optical power converted from the pump light of different wavelengths via one of the mechanical modes , which indicates that the coherent wavelength conversion process is independent of the wavelength of the pump light. (e) Simulated mechanical modal profiles for the five peaks shown in the measured spectrum in (c).
Fig. 4. Experimental demonstration of broadband optomechanically induced transparency and absorption. (a) Schematic showing the relevant optical frequencies involved in the BOMIT process. In addition to the pump fields ( and ) for phonon actuation, a probe control field () at frequency was red-detuned from the cavity mode at a frequency . Another probe field (violet solid arrow) was used to obtain the intracavity optical power spectrum. (b) Experimental setup for measuring the BOMIT. The probe light was generated by phase-modulating the control field at a frequency . The radio-frequency (RF) source for modulating the pump control and probe control is from the same VNA. PM, phase modulator; PS, phase shifter. (c) Transmission spectra of the probe light showing the BOMIT and BOMIA. Whether it exhibits BOMIT or BOMIA is determined by the RF phase between the driving field and the probe field . (d) Transmission spectra of the probe light for , , , and . When or , the resonance exhibits a Fano line shape.
Fig. 5. Experimental demonstration of tunability of optomechanically induced transparency and absorption by pump power. (a) Normalized transmission spectra of optomechanically induced transparency measured under various pump power levels. (b) Transmission at the dip of the spectra, i.e., the OMIT signal strength, in (a) as a function of the pump power. The black line is a theoretical fit of the experimental data. (c) Normalized transmission spectra of optomechanically induced absorption measured under various pump power levels. (d) Transmission at the peak of the spectra, i.e., the OMIA signal strength, in (c) as a function of the pump power. The black line is a theoretical fit of the experimental data.