Abstract
Advances in vectorial polarization-resolved imaging are bringing new capabilities to applications ranging from fundamental physics through to clinical diagnosis. Imaging polarimetry requires determination of the Mueller matrix (MM) at every point, providing a complete description of an object’s vectorial properties. Despite forming a comprehensive representation, the MM does not usually provide easily interpretable information about the object’s internal structure. Certain simpler vectorial metrics are derived from subsets of the MM elements. These metrics permit extraction of signatures that provide direct indicators of hidden optical properties of complex systems, while featuring an intriguing asymmetry about what information can or cannot be inferred via these metrics. We harness such characteristics to reveal the spin Hall effect of light, infer microscopic structure within laser-written photonic waveguides, and conduct rapid pathological diagnosis through analysis of healthy and cancerous tissue. This provides new insight for the broader usage of such asymmetric inferred vectorial information.1 Introduction
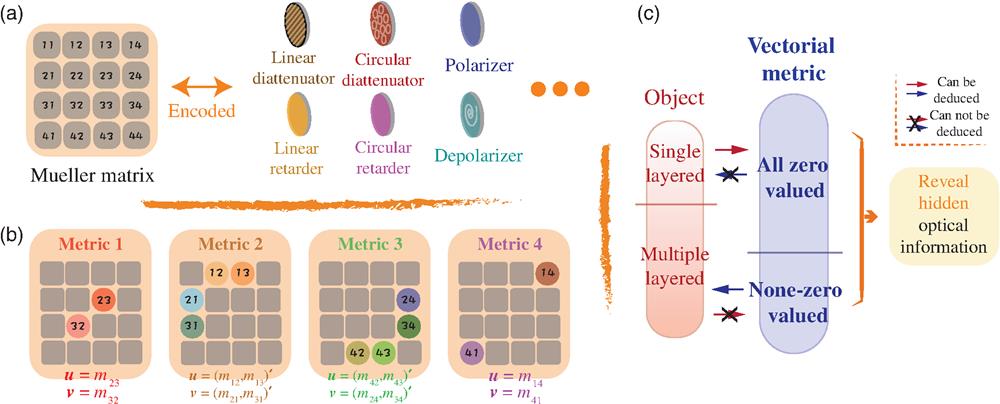
Light and the optical properties of matter have long been harnessed across different areas of research and applications.1 Rich information can be provided by the vectorial nature of light and its transformation by objects and there is still plenty of opportunity to explore these properties further.2–10 The way in which an object transforms the vectorial properties of light can be described by the Mueller matrix (MM), which consists of 16 elements ().11–13 Although the MM forms a comprehensive representation, it does not necessarily provide an intuitive link to the optical properties or structure of the object.11–13 That is to say, vectorial characteristics of the object, such as diattenuation, retardance, and depolarization [see Fig. 1(a)], are encoded within the MM elements.11–13

Figure 1.MM and the asymmetric inference of vectorial metrics. (a) Different vectorial optical properties that are encoded in an MM. (b) Four vectorial metrics and related elements in their MMs. (c) A summary of the asymmetric inference network of vectorial metrics. The blue and red arrows represent the mathematical inference. Detailed explanations are in Supplementary Material 2.
It has been shown previously that certain symmetries or asymmetries in the MM can be related to physical structures or optical phenomena in the object, when the original targets contain layered optical structures.13,14 Useful quantities can be defined as the difference between diagonally opposite elements of the MM.14–17 However, these quantities have not yet been put forward within a unified structure thus enabling further intuitive understanding and wider practical use.
Here we first define a universal metric derived from subsets of elements of the MM, which we refer to here as a “vectorial metric”: where the vectors consist of MM elements, , and , and is a vector -norm. The general metric encompasses several useful forms, which we will refer to as metrics 1 to 4 ( to ) [see Fig. 1(b), Supplementary Materials 1 and 2 for their details].
Sign up for Advanced Photonics TOC. Get the latest issue of Advanced Photonics delivered right to you!Sign up now
We point out an asymmetric inference between the metric value and the complexity of objects [Fig. 1(c)]. Such inference is important, as it constrains the physical information that the metrics could extract from objects, such as how multiple layers are constituted [see Fig. 1(c), Supplementary Material 2]. Hence, it not only explains the scope of interpretation of the but also allows further applications.
Using this newly unified representation, we then emphasize illustration of the derived vectorial metrics through MM measurements of various objects—objective lenses, photonic waveguides, and biological tissue. Through analysis of such metrics, we reveal the appearance of circular retardance (); the combination of linear diattenuation (LD) and linear polarizance (), multilayered linear retardance (LR) (); and the sequence of a linear diattenuator and a linear retarder (). Furthermore, practical applications are also enabled: harnessing the spin Hall effect of light (SHEL) with a graded index (GRIN) objective lens (); conducting vectorial analysis of silica-based photonic waveguides ( and ); and showing rapid cancer diagnosis and layer characterization of lung tissue ().
Moreover, new metrics could be developed that enable extraction of more useful physical information about the target and benefit more applications, whereas the asymmetric inference behind the metrics can also be explored again (see Sec. 5). Future impact of these developments could range from quantum physics to clinical diagnosis.
2 Revealing Spin Hall Effect of Light
The SHEL has been gaining large attention in fundamental research, such as geometric phase investigations or angular momentum (AM) transfer processes,18–23 and in applications such as optical edge detection for characterizing boundaries.19 Traditional methods to validate the SHEL include interferometry20 or quantum weak measurement;21,22 however, they are incapable of measuring or tracing the SHEL’s presence in the multilayered optical phenomena that result in a complex inhomogeneously polarized beam. Hence, MM analysis has become a powerful tool to deal specifically with such complex scenarios.23 Here we demonstrate the use of to validate the presence of a circular birefringence (CB) gradient, which serves as an efficient way to trace the SHEL’s presence in complex systems.22 This is illustrated through analysis of the optical properties of a GRIN lens24 under the condition of oblique illumination.
GRIN lenses are widely used in compact imaging systems.24 Their intrinsic radially symmetric linear birefringence, which can also be considered as a systematic polarization aberration, has been studied before.24 However, the performance of such birefringence with obliquely incident light has not yet been investigated; such a configuration is relevant, for example, to scanning laser microscopy through a GRIN lens endoscope.25 Under such conditions, the beam would no longer obey the meridional approximation with respect to the gradually changing refractive index of the GRIN lens,24,26 such that the effective aberration follows a complex development process rather than being modeled by a pure linear retarder assembly. In Fig. 2(a), we show two cases of obliquely illuminated GRIN endoscope lenses, with two different incident angles of 5 deg and 7 deg. In Figs. 2(b) and 2(c), the corresponding MMs, output vector beams, the equivalent retarder fast axis orientations, a CB gradient example, and are given (see Supplementary Material 3 for the Mueller–Stokes measurement approach and other decomposition methods). A plot of the value of with changing illumination angle is shown in Fig. 2(c) (see details in Supplementary Materials 2 and 4). Based upon the fact that the CB gradient existed22 (according to ), we validated that the SHEL could be created through propagation of light with oblique incidence on the GRIN lens.
Figure 2.GRIN lens with its decoupled vectorial information. (a) GRIN lens with right-hand circularly polarized light input, under obliquely incident angle at 5 deg and 7 deg, respectively. (b) Their related experimental MMs, output vector fields , fast axis orientations, as well as an example of a plot of CB gradient sampled via the yellow solid line within the subfigure of . (c) Value of under different obliquely incident angles of this system (we use absolute value in this section for simplicity), from 5 deg to 10 deg with 1 deg interval. The value is extracted via the middle linear gradient area (orange dotted rectangle, detailed in Supplementary Material 3). The shaded area represents the standard deviation. Details of the relationship between and CB can be found in Supplementary Material 2.
Additionally, the fast axis distributions of the two exemplar cases [Fig. 2(b)] demonstrate the transformation of intrinsic topological charges23 to support the existence of the SHEL from another perspective—that of AM (see Supplementary Material 4 for a detailed analysis). This demonstration newly reveals the AM transfer process in a GRIN lens under the non-meridional plane geometry. As the GRIN lens is also an imaging device, it has the potential to be used as a novel imaging SHEL device, which presents its own applications such as focus manipulation.27 As the illumination angle of the light beam relative to the lens can be controlled, the SHEL in such a system is field controllable,23 which would give additional degrees of freedom to harness the SHEL through such a device.
Here, for the first time, by analyzing the hidden information in MM vector images of an obliquely illuminated GRIN lens system through , we validated the presence of the CB gradient in such a system, hence confirming the existence of the SHEL.
3 Revealing Vectorial Phenomena in Laser Written Waveguides
We have seen above how the polarization aberration of a GRIN lens leads to mechanical effects that have optical consequences that are revealed through the vectorial metrics. Similar effects can occur during the fabrication of other photonic structures. We show here how the vectorial metrics and can be used to extract useful information about laser written waveguides28 from complex MM measurements.
Photonic integrated circuits (PICs), comprising a 3D network of waveguides embedded in a glass substrate, are used in a range of applications and may be written by an ultrashort pulsed laser.29 These so-called direct laser written PICs have found particular application in photon-based quantum information processing.30–32 In such applications, two waveguide parameters are of critical importance: low loss and low polarization dependence.33 Previous studies of these two parameters have focused on characterizing the properties of the output light beam, such as output intensity under certain incident states of polarization (SOPs), or the output SOP measured by point Stokes vector polarimetry.33 Those measurements and further characterization have intrinsic limitations, since they cannot comprehensively represent the full vectorial properties11–13 of the PICs. The subsequent optimization processes for these waveguides are therefore limited since the light–matter interaction has not been fully considered.
By analyzing the MM vector images of laser-written PICs in fused silica [Fig. 3(a)], we take a new perspective to reveal their intrinsic optical properties. This analysis first focuses on the value of and . validates the existence condition of linear polarizance and diattenuation properties; reveals the condition of multilayered linear retarders (see Supplementary Materials 1 and 2).
Figure 3.Direct laser written waveguides with their MMs and vectorial metric analysis. (a) A sketch of the geometry of the direct laser writing process and the illumination and detection paths of the subsequent imaging process. (b) Example experimental MMs, value of metrics for waveguides written with laser pulse energies of 42 and 67 nJ, respectively. (c) The value of depolarization, , and polarizance of different waveguides with respect to writing pulse energy. The statistical analysis was performed on the chosen subregions (detailed in Supplementary Material 5). The shaded area represents the standard deviation. The relationship of and with polarization properties can be found in Supplementary Materials 2, 6, and 8.
In Fig. 3(b), the experimental MMs are given for two straight waveguides fabricated at different laser writing pulse energies of 42 and 67 nJ. Further manufacturing details are provided in Supplementary Material 5. Selected optical properties for the waveguides from the MM imaging are plotted in Fig. 3(b) as well as quantification in Fig. 3(c) as a function of the fabrication pulse energy. The existence of non-zero indicates that such a system exhibits stronger diattenuation and less polarizance;34 this is equivalent to a layered structure consisting of a diattenuator followed by a depolarizer (see Supplementary Material 6). Such properties can be a result of the combination of Rayleigh scattering35 and complex nanograting36,37 induced anisotropic scattering38–40 inside the photonic waveguide. It is known that with increasing energy of the writing laser pulses, the status of such nanostructures can be changed during the fabrication process,41 here correlating with a reduction in and increasing depolarization. We validated the possibilities via Monte Carlo simulation with respect to the changes of the anisotropic scattering. Such simulation has been widely employed for quantitative analysis of the interactions between polarized photons and complex media, especially in the presence of multiple scattering, where analytical solutions are not available38,39 (see Supplementary Material 6). We also observed the existence of in the same waveguides shown in Fig. 3(b). We can see that asymmetry occurs between the fourth row and the fourth column of the MM, which supports the existence of multilayered linear retarders featuring directional dependency, and in effect can be a further validation of the quill effect in laser fabrication.42 Such an effect is also detailed in Supplementary Material 6, through measurement of different retardances for waveguides written with the opposite scanning direction.
The observation of trends in the vectorial metric values and their analysis give us a better insight into the vectorial properties of the photonic waveguides, including a better understanding of the loss and polarization effects as well as providing guidance for further customized fabrication. It reveals that (1) different types of complex layered polarization structures exist inside the waveguides (validated via and ); as can be interpreted as indicating an anisotropic absorption layer before a depolarization layer, can be used to characterize the contributions from stress birefringence induced, form birefringence induced, as well as scattering induced retardance; (2) decreased with increasing pulse energy, whereas the scattering induced depolarization increased. These observations imply that under such a writing parameter regime, the balance of polarization dependence loss () and scattering level (depolarization) should be considered while choosing the pulse energy to optimize waveguides for different applications. Such observations can only be made via full analysis of vectorial properties.
For the first time, by harnessing the vectorial metrics of MM images, we have performed vectorial analysis of the optical properties of direct laser written waveguides. These insights will help optimize fabrication processes to improve the properties of advanced PICs. They also provide a new perspective for investigation of light–matter interaction in the waveguides due to fabrication effects.
4 Revealing Structural Information of Cancerous Tissues for Differentiation
Cancer is one of the biggest threats to human health. Clinically, non-small cell lung carcinoma is the primary form of lung cancer constituting about 85% of all cases.43,44 There have been numerous proposed scalar and vectorial optical methods, based upon intensity imaging, for differentiating normal and cancerous tissues, as well as exploring their related pathological microstructures.45–47 Vectorial analysis of biomedical tissue has a shorter history but is continuously gaining more attention.45–47
Here, for the first time, by analyzing the vectorial metrics derived from MM images of normal human lung tissues and non-small cell lung carcinoma tissues, we differentiate the tissue types via the lateral images while revealing their pathological structural information using axial information via metric . Note that also represents the sequence of layers of LR and LD (see Supplementary Material 1).
We measured the MMs of five pairs of normal lung tissue areas (H1 to H5) and human non-small cell lung carcinoma tissue areas (C1 to C5) from samples 1 to 5 (each sample contains regions of H and C, decided by pathologists from Shenzhen Second People’s Hospital). Figure 4(a) shows the sketch of normal lung tissue and its alveoli, as well as the alveoli with pulmonary fibrosis processes.48 For each sample, we selected one normal-tissue-based region and one cancerous-tissue-based region as demonstrated in Fig. 4(a). For the measured MMs, absolute values of and decomposed retardance, which has been used as a quantitative parameter for cancer detection9,14,49 (see Supplementary Materials 3 and 7), as well as other parameters of two randomly chosen regions are illustrated in Fig. 4(b). For each region, we sampled 10 points and extracted the value of two parameters for later statistical analysis (for methods refer to Ref. 24). The statistical histogram of the data from sample 1 is shown in Fig. 4(c). It can be seen that the values of for all cancerous areas are significantly larger in magnitude than those in normal areas, and it shows similar statistical variation as the retardance. Though decomposed retardance has previously been proposed as a useful measure for abnormal fibrous tissue areas, has more advantages: it provides a physically interpretable, simply calculated index for quick clinical diagnosis and cancer boundary detection. Note here we focus on the efficient (and new) usage of compared with the widely used retardance value, hence validating its potential to be further used in pathological analysis. Detailed investigations of these applications would be the subject of further work. Details of all original data, statistical analysis including -value analysis, as well as sampling and processing methods can be found in Supplementary Material 7.
Figure 4.Normal/cancerous lung tissue samples with their MMs and metric information. (a) Sketches of normal lung tissue and alveoli and abnormal lung tissue with fibrosis. Demonstration for samples 1 (unstained sample and its H-E stained counterpart), showing a sketch with corresponding random sampling points in both cancerous and normal areas (see method in Supplementary Material 7). Scale bar: . (b) Experimental MMs sampled from sample C1, alongside with value of LD, LR, and at two randomly chosen regions. Note the scale used for LD and LR (and related MM elements) has been amplified by a factor of 100 for better visualization. (c) Demonstration of the data from samples 1 (H1 and C1 parts); the bar chart shows the mean value and the standard deviation of and retardance. Data were decomposed from the MMs for 10 points per each region of the sample. (d) A selected small region of and of the second cancerous MM is shown as well. This indicates the structure may have double-layered format—a sequence of linear retarder and linear diattenuator; details can be found in Supplementary Materials 1, 2, and 7.
Furthermore, as mentioned earlier, the existence of also relates to the sequential structure along the optical axis of a multilayered system. Here the determined relationship-based for those human lung carcinoma tissue pairs is shown in Fig. 4(d) (see Supplementary Material 1 for details). It effectively indicates the possibility that within some regions of lung cancer tissue, there exists a layered structure that may be treated as a linear retarder followed by a linear diattenuator. Such a fibrous structure model is supported with a detailed Monte Carlo simulation approach38,39 (see Supplementary Material 8 for details) and can potentially be used as evidence in support of the corresponding morphological explanations.50 Such parameters (related to newly revealed fibrous structures) are likely to be useful in quick, label-free determination of the specific cancerous development stages, or microstructural identification. Validation of this will require further research in the fields of both polarization biophotonics and clinical pathological diagnosis.
5 Discussion
In this work, we took advantage of the vectorial metrics derived from the MM—that can provide a simple representation of complex vectorial phenomena—to demonstrate the SHEL, to analyze the vectorial characteristics of laser written waveguides, and to facilitate the discrimination between healthy and cancerous tissue. It has shown that simplified metrics based upon simple combinations of MM elements can reveal useful information about specimen properties across diverse areas of technology. Further insight could again be derived from extension of the use of these metrics into other areas (metrics 1 to 4; or alternative metrics, see more in Supplementary Material 9). Furthermore, it is informative to consider the relationships between objects, vectorial metrics, and the complete MMs—in particular the inferences that can be drawn between each of them.
Some complex multiple layered structures can possess MMs with properties in common with certain simple, single-layered structures. These properties can be revealed in a straightforward way through the use of appropriately defined vectorial metrics. Hence the metrics can provide an intermediate way to link the properties of objects with the intrinsic characteristics of an MM. Based on this observation and the asymmetric inference that is used in the main article, more complex connections can be revealed [see Fig. 5(a)], based on three spaces: A (representing objects), B (representing the vectorial metrics), and C (representing the MMs). They are separate but linked concepts, between which there exists a complex inference relationship. The inference relationships between A and B have been explained and applied in the content above, where we characterized its asymmetry. A similar asymmetric inference can be found between the spaces B and C [see Fig. 5(a)], hence forming an overall complex connection via space B. The MM space C can also be divided into two subspaces and . represents MMs that demonstrate a connection between seemingly disparate physical systems. For example, this could mean that a single-layered system () and a multilayered system () can exhibit same forms of MM, while their internal structures are considerably different [see Figs. 5(b) (i) for the concept; and 5(b) (ii) for a real example consisting of a GRIN lens]. The latter subspace represents those MMs that do not demonstrate such a connection between and . Such property is linked via space B and hence can be revealed using vectorial metrics. Understanding such entangled phenomena could help enable various new potential applications, such as providing an advanced passive vectorial aberration compensation strategy.
Figure 5.Relationships between the three spaces and passive polarization aberration compensation. (a) The complex inference network among object (space A), vectorial metrics (space B), and MM (space C). (b) Panels (i) and (ii) show a sketch of the connectivity between A, B, and C, potential new metric (; defined with two diagonally opposed blocks; see details in Supplementary Material 9), as well as a demonstration of passive polarization compensation using GRIN lens and spatial half waveplate array. HWP: half wave plate. (iii) An illustration of the effect of aberration compensation. (c) Such spaces are linked with the new metric. The metric can first reveal hidden physical information of a complex system, such as uniform axis orientation in this application, then can optimize the operations, such as achieving an aberration compensated system.
We demonstrate here a potential new metric () that works under such a scope. For instance, we first use Monte Carlo simulation approach38,39 to simulate a multilayered complex birefringence system that includes the aberration, and then use the value of to serve as a feedback control. A general process would include three steps: (1) run the simulation and check the value of simultaneously, (2) record the multilayered system’s parameters when appeared to be the expected value, and (3) adopt such generated multilayered configuration in reality. Take a GRIN lens system in a specific configuration as an example [Fig. 5(b) (ii)]. Here the complex polarization aberration of the GRIN lens endoscope system would be equivalent to a simplified system—a retarder with uniform fast axis orientation, which also exhibits the same zero metric. This would be clearly seen if using metric . Hence, further aberration compensation would only require a phase correction device51,52 if used with - or -polarized illumination [Fig. 5(b) (iii)]. This case shows that the vectorial metric not only maintains the ability for characterization of complex optical properties but can also be used as a simple measure for feedback in an optimization procedure [see Fig. 5(c)]. More details as well as other potential roles that the metrics may serve are discussed further in Supplementary Material 9.
These observations indicate that a large unexplored space exists for research into related vector MM images. Our work paves the way for the broader usage of such entangled vectorial information, which is inherently connected through the vectorial metrics, in further applications spanning from quantum physics to clinical applications.
Chao He completed his DPhil (PhD) in the Department of Engineering Science at the University of Oxford from 2018 to 2020 (within 2 years). From 2020 (Feb) to 2021 (Aug), he was a postdoctoral researcher. In 2021 (Sep) he was appointed a Stipendiary Junior Research Fellowship in Engineering at St John’s College (independent researcher), and in 2021 (Oct) was concurrently appointed an Associate Member of Faculty in the Department of Engineering Science. He serves as a doctoral supervisor.
Patrick S. Salter is an Early Career EPSRC Fellow in the Department of Engineering Science at University of Oxford. He is working on using short pulse laser fabrication to enable new functional devices based upon synthetic diamond. He is also a Junior Research Fellow at New College. He is a member of SPIE.
Honghui He received his PhD in physics from Tsinghua University, Beijing, China, in 2011. He is currently an associate professor with Tsinghua Shenzhen International Graduate School, Tsinghua University, China. His research interests include Mueller matrix polarimetric techniques and their applications in biomedical diagnosis, especially cancerous tissues’ detection. He is a member of SPIE, Optica, and the Biomedical Photonics Committee of Chinese Optical Society.
Hui Ma is a professor of physics in the Tsinghua Shenzhen International Graduate School, Tsinghua University, China. He received his PhD from Imperial College London, UK, Department of Physics, in 1988. He is a member of SPIE.
Martin J. Booth holds a degree and a DPhil (PhD) in Engineering Science from the University of Oxford. He held a Research Fellowship at Christ Church, Oxford, a Royal Academy of Engineering/EPSRC Research Fellowship and a EPSRC Advanced Research Fellowship. He became Professor of Engineering Science in 2014. He has won numerous awards, and is a fellow of the Institute of Physics, SPIE, and Optica. He has published over 150 journal articles and has founded two spin-off companies arising from his research.
Biographies of the other authors are not available.
References
[1] M. Born, E. Wolf. Principles of Optics: Electromagnetic Theory of Propagation, Interference and Diffraction of Light(2013).
[2] K. Bliokh et al. Spin–orbit interactions of light. Nat. Photonics, 9, 796-808(2015).
[3] A. Forbes, M. De Oliveira, M. R. Dennis. Structured light. Nat. Photonics, 15, 253-262(2021).
[4] J. Wang et al. Integrated photonic quantum technologies. Nat. Photonics, 14, 273-284(2020).
[5] K. Dholakia, B. W. Drinkwater, M. Ritsch-Marte. Comparing acoustic and optical forces for biomedical research. Nat. Rev. Phys., 2, 480-491(2020).
[6] A. Dorrah et al. Metasurface optics for on-demand polarization transformations along the optical path. Nat. Photonics, 15, 287-296(2021).
[7] N. Hafi et al. Fluorescence nanoscopy by polarization modulation and polarization angle narrowing. Nat. Methods, 11, 579-584(2014).
[8] D. Jin et al. Nanoparticles for super-resolution microscopy and single-molecule tracking. Nat. Methods, 15, 415-423(2018).
[9] C. He et al. Polarisation optics for biomedical and clinical applications: a review. Light Sci. Appl., 10, 194(2021).
[10] N. A. Rubin, Z. Shi, F. Capasso. Polarization in diffractive optics and metasurfaces. Adv. Opt. Photonics, 13, 836-970(2021).
[11] D. H. Goldstein. Polarized Light(2017).
[12] R. A. Chipman, W.-S. T. Lam, G. Young. Polarized Light and Optical Systems(2018).
[13] J. J. G. Pérez, R. Ossikovski. Polarized Light and the Mueller Matrix Approach(2017).
[14] V. V. Tuchin, N. Zeng, D. Zhu, E. A. Genina et al. Tissue optical clearing for Mueller matrix microscopy. Handbook of Tissue Optical Clearing: New Prospects in Optical Imaging, 31(2022).
[15] P. Li et al. Separating azimuthal orientation dependence in polarization measurements of anisotropic media. Opt. Express, 26, 3791-3800(2018).
[16] P. Li et al. Characteristic Mueller matrices for direct assessment of the breaking of symmetries. Opt. Lett., 45, 706-709(2020).
[17] P. Li et al. Polaromics: deriving polarization parameters from a Mueller matrix for quantitative characterization of biomedical specimen. J. Phys. D Appl. Phys., 55, 034002(2021).
[18] X. Ling et al. Recent advances in the spin Hall effect of light. Rep. Prog. Phys., 80, 066401(2017).
[19] J. Zhou et al. Optical edge detection based on high-efficiency dielectric metasurface. Proc. Natl. Acad. Sci., 116, 11137-11140(2019).
[20] C. Prajapati, S. Pidishety, N. K. Viswanathan. Polarimetric measurement method to calculate optical beam shifts. Opt. Lett., 39, 4388-4391(2014).
[21] O. Hosten, P. Kwiat. Observation of the spin Hall effect of light via weak measurements. Science, 319, 787-790(2008).
[22] K. Bliokh et al. Spin-Hall effect and circular birefringence of a uniaxial crystal plate. Optica, 3, 1039-1047(2016).
[23] C. T. Samlan, N. K. Viswanathan. Field-controllable spin-Hall effect of light in optical crystals: a conoscopic Mueller matrix analysis. Sci. Rep., 8, 2002(2018).
[24] C. He et al. Complex vectorial optics through gradient index lens cascades. Nat. Commun., 10, 4264(2019).
[25] D. M. Huland et al. In vivo imaging of unstained tissues using long gradient index lens multiphoton endoscopic systems. Biomed. Opt. Express, 3, 1077-1085(2012).
[26] A. K. Ghatak. Optics(2005).
[27] J. Zhou et al. Broadband photonic spin Hall meta-lens. ACS Nano, 12, 82-88(2018).
[28] P. S. Salter, M. J. Booth. Adaptive optics in laser processing. Light Sci. Appl., 8, 110(2019).
[29] G. Della Valle, R. Osellame, P. Laporta. Micromachining of photonic devices by femtosecond laser pulses. J. Opt. A, 11, 013001(2009).
[30] A. Crespi et al. Integrated multimode interferometers with arbitrary designs for photonic boson sampling. Nat. Photonics, 7, 545-549(2013).
[31] G. D. Marshall et al. Laser written waveguide photonic quantum circuits. Opt. Express, 17, 12546-12554(2009).
[32] M. Tillmann et al. Experimental boson sampling. Nat. Photonics, 7, 540-544(2013).
[33] J. Guan et al. Hybrid laser written waveguides in fused silica for low loss and polarization independence. Opt. Express, 25, 4845-4859(2017).
[34] R. Chipman. Depolarization index and the average degree of polarization. Appl. Opt., 44, 2490-2495(2005).
[35] S. M. Eaton et al. Spectral loss characterization of femtosecond laser written waveguides in glass with application to demultiplexing of 1300 and 1550 nm wavelengths. J. Lightwave Technol., 27, 1079-1085(2009).
[36] Y. Shimotsuma et al. Self-organized nanogratings in glass irradiated by ultrashort light pulses. Phys. Rev. Lett., 91, 247405(2003).
[37] K. Hirao, K. Miura. Writing waveguides and gratings in silica and related materials by a femtosecond laser. J. Non Crys. Solids, 239, 91-95(1998).
[38] L. Wang, S. L. Jacques, L. Zheng. MCML—Monte Carlo modeling of light transport in multi-layered tissues. Comput. Methods Programs Biomed., 47, 131-146(1995).
[39] T. Yun et al. Monte Carlo simulation of polarized photon scattering in anisotropic media. Opt. Express, 17, 16590-16602(2009).
[40] H. He et al. Mueller matrix polarimetry—an emerging new tool for characterizing the microstructural feature of complex biological specimen. J. Lightwave Technol., 37, 2534-2548(2019).
[41] C. Hnatovsky et al. Pulse duration dependence of femtosecond-laser-fabricated nanogratings in fused silica. Appl. Phys. Lett., 87, 014104(2005).
[42] P. G. Kazansky et al. ‘Quill’ writing with ultrashort light pulses in transparent materials. Appl. Phys. Lett., 90, 151120(2007).
[43] R. S. Herbst, D. Morgensztern, C. Boshoff. The biology and management of non-small cell lung cancer. Nature, 553, 446-454(2018).
[44] M. Reck et al. Management of non-small-cell lung cancer: recent developments. Lancet, 382, 709-719(2013).
[45] N. Ghosh, A. I. Vitkin. Tissue polarimetry: concepts, challenges, applications, and outlook. J. Biomed. Opt., 16, 110801(2011).
[46] V. Tuchin. Polarized light interaction with tissues. J. Biomed. Opt., 21, 071114(2016).
[47] J. Ramella-Roman, I. Saytashev, M. Piccini. A review of polarization-based imaging technologies for clinical and pre-clinical applications. J. Opt., 22, 123001(2020).
[48] S. C. Litin, S. Nanda. Mayo Clinic Family Health Book(2009).
[49] Y. Dong et al. Quantitatively characterizing the microstructural features of breast ductal carcinoma tissues in different progression stages by Mueller matrix microscope. Biomed. Opt. Express, 8, 3643-3655(2017).
[50] T. E. King, A. Pardo, M. Selman. Idiopathic pulmonary fibrosis. Lancet, 378, 1949-1961(2011).
[51] M. J. Booth. Adaptive optical microscopy: the ongoing quest for a perfect image. Light Sci. Appl., 3, e165(2014).
[52] Q. Hu et al. Arbitrary vectorial state conversion using liquid crystal spatial light modulators. Opt. Commun., 459, 125028(2020).